Download as PDF, PPTX
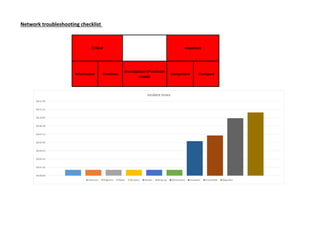
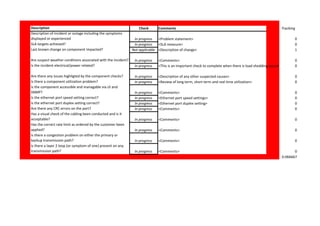
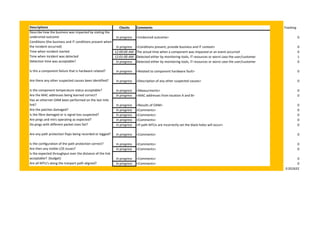


The document provides a network troubleshooting checklist to help investigate incidents and outages. It includes timelines for key stages of the troubleshooting process like detection, diagnosis, repair, and recovery. It also includes a list of checks to perform in areas like component status, configuration, environmental factors, and utilization to help identify the root cause. Priority levels are assigned to ensure critical checks are completed first.