Download as PDF, PPTX

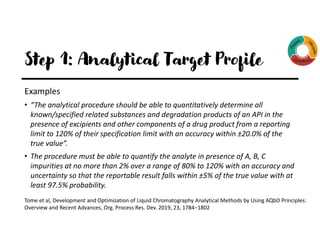
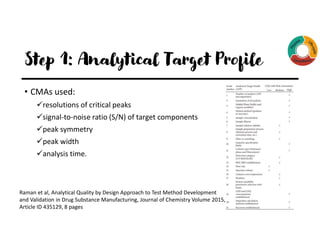
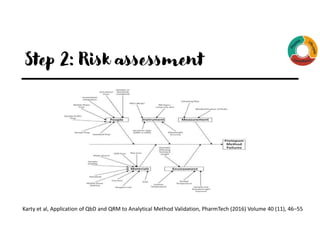
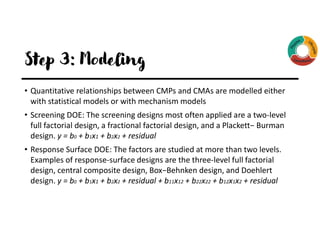

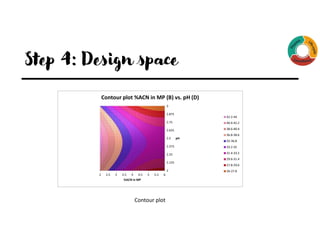
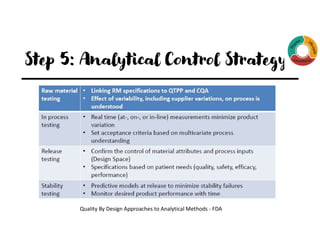
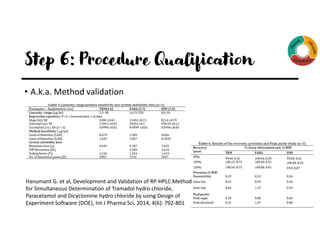


The document outlines the implementation of Quality by Design (QbD) principles in developing High-Performance Liquid Chromatography (HPLC) analytical methods. It details the steps involved, including establishing analytical target profiles, risk assessments, modeling approaches, defining design spaces, and procedural qualifications for method validation. Emphasis is placed on ensuring robustness and accuracy in analytical procedures through statistical and design of experiments (DOE) methodologies.


