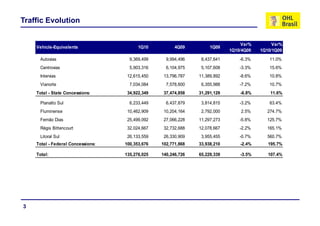
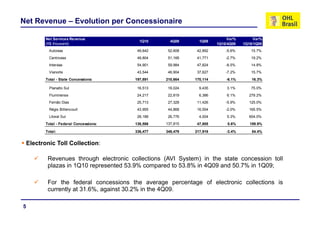
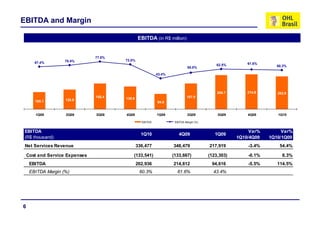
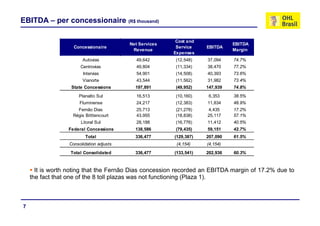
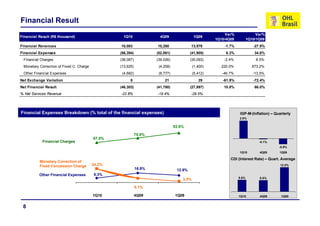
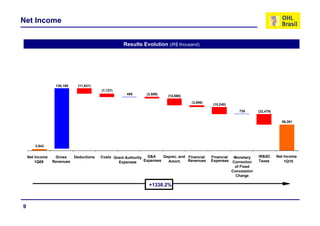
The document provides financial results and traffic data for OHL Brasil for the first quarter of 2010. Some key points:
- Total traffic increased 11.6% compared to the first quarter of 2009 across state concessions and 195.7% across federal concessions.
- Net revenue increased 54.4% overall compared to the first quarter of 2009, with strong growth across all concessions.
- EBITDA was R$202.9 million for the quarter, a 114.5% increase over the first quarter of 2009, with an EBITDA margin of 60.3%.
- Net income was R$56.4 million for the quarter compared to a net loss in the prior year period
2. Notice
This presentation contains forward-looking statements relating to the prospects of the
business, estimates for operating and financial results, and those related to growth prospects
of OHL Brasil, these are merely projections and, as such, are based exclusively on the
, y p j , , y
expectations of OHL Brasil’s management concerning the future of the business and its
continued access to capital to fund the Company’s business plan.
Such forward looking statements depend substantially on changes in market conditions
forward-looking depend, substantially, conditions,
government regulations, competitive pressures, the performance of the Brazilian economy and
the industry and are, therefore, subject to change without prior notice.
2
4. Tariff
Average Toll Tariff Var% Var%
1Q10 4Q09 1Q09
(in R$/Vehicle-Equivalents) 1Q10/4Q09 1Q10/1Q09
Autovias 5.75 5.71 5.51 0.7% 4.4%
Centrovias 9.15 9.10 8.86 0.5% 3.3%
Intervias 4.70
4 70 4.69
4 69 4.53
4 53 0.2%
0 2% 3.8%
3 8%
Vianorte 6.73 6.73 6.44 0.0% 4.5%
Average - State Concessions: 6.14 6.09 5.89 0.8% 4.2%
Planalto Sul 2.90 2.73 2.70 6.2% 7.4%
Fluminense 2.56 2.50 2.50 2.4% 2.4%
Fernão Dias 1.10 1.10 1.10 0.0% 0.0%
Régis Bittencourt 1.50 1.50 1.50 0.0% 0.0%
Litoral Sul 1.17
1 17 1.10
1 10 1.10
1 10 6.4%
6 4% 6.4%
6 4%
Average - Federal Concessions: 1.51 1.47 1.54 2.7% -1.9%
Tariff Adjustment of 3.64% in July 01, 2009 based on the accumulated variation of the
IGP-M from June/2008 to May/2009.
Tariff Adjustment: In February of 2009, the basic tolls for the Fluminense and Litoral Sul
concessions were increased, based on the criterion of rounding up the first decimal place
and the cumulative variation in the IPCA inflation index from February 2009 to January
2010 (+4.59%).
( 4.59%).
4
5. Net Revenue – Evolution per Concessionaire
Net Services Revenue Var% Var%
1Q10 4Q09 1Q09
(R$ thousand) 1Q10/4Q09 1Q10/1Q09
Autovias 49,642 52,608 42,892 -5.6% 15.7%
Centrovias 49,804 51,168 41,771 -2.7% 19.2%
Intervias 54,901 59,984 47,824 -8.5% 14.8%
Vianorte 43,544 46,904 37,627 -7.2% 15.7%
Total - State Concessions: 197,891 210,664 170,114 -6.1% 16.3%
Planalto S l
Pl lt Sul 16,513
16 513 16,024
16 024 9,435
9 435 3.1%
3 1% 75.0%
75 0%
Fluminense 24,217 22,819 6,386 6.1% 279.2%
Fernão Dias 25,713 27,328 11,426 -5.9% 125.0%
Régis Bittencourt 43,955 44,868 16,554 -2.0% 165.5%
Litoral Sul 28,188 26,776 4,004 5.3% 604.0%
Total - Federal Concessions: 138,586 137,815 47,805 0.6% 189.9%
Total: 336,477 348,479 217,919 -3.4% 54.4%
Electronic Toll Collection:
Revenues through electronic collections (AVI System) in the state concession toll
plazas in 1Q10 represented 53 9% compared to 53 8% in 4Q09 and 50 7% in 1Q09;
53.9% 53.8% 50.7%
For the federal concessions the average percentage of electronic collections is
currently at 31 6% against 30 2% in the 4Q09
31.6%, 30.2% 4Q09.
5
7. EBITDA – per concessionaire (R$ thousand)
Cost and
Net Services EBITDA
Concessionaire Service EBITDA
Revenue Margin
Expenses
Autovias 49,642
, ( ,
(12,548)
) 37,094
, 74.7%
Centrovias 49,804 (11,334) 38,470 77.2%
Intervias 54,901 (14,508) 40,393 73.6%
Vianorte 43,544 (11,562) 31,982 73.4%
State Concessions 197,891
197 891 (49,952)
(49 952) 147,939
147 939 74.8%
74 8%
Planalto Sul 16,513 (10,160) 6,353 38.5%
Fluminense 24,217 (12,383) 11,834 48.9%
Fernão Dias 25,713 (21,278) 4,435 17.2%
Régis Bitttencourt 43,955 (18,838) 25,117 57.1%
Litoral Sul 28,188 (16,776) 11,412 40.5%
Federal Concessions 138,586 (79,435) 59,151 42.7%
Total ,
336,477 (
(129,387)
, ) 207,090
, 61.5%
Consolidation adjusts (4,154) (4,154)
Total Consolidated 336,477 (133,541) 202,936 60.3%
It is worth noting that the Fernão Dias concession recorded an EBITDA margin of 17.2% due to
the fact that one of the 8 toll plazas was not functioning (Plaza 1).
7
8. Financial Result
Var% Var%
Financial Result (R$ thousand) 1Q10 4Q09 1Q09
1Q10/4Q09 1Q10/1Q09
Financial Revenues 10,083 10,260 13,979 -1.7% -27.9%
Financial Expenses (56,394) (52,061) (41,905) 8.3% 34.6%
Financial Charges (38,087) (39,026) (35,093) -2.4% 8.5%
Monetary Correction of Fixed C. Charge (13,625) (4,258) (1,400) 220.0% 873.2%
Other Financial Expenses (4,682) (8,777) (5,412) -46.7% -13.5%
Net Exchange Variation 8 21 29 -61.9% -72.4%
Net Financial Result (46,303)
(46 303) (41,780)
(41 780) (27,897)
(27 897) 10.8%
10 8% 66.0%
66 0%
% Net Services Revenue -22.8% -19.4% -29.5%
Financial Expenses Breakdown (% total of the financial expenses) IGP M- (Inflation) – Quarterly
IGP-M
2.8%
83.8%
75.0%
67.5%
67 5%
Financial Charges -0.1%
-0.9%
1Q10 4Q09 1Q09
CDI (Interest Rate) – Quart. Average
Monetary Correction of
Fixed Concession Charge 24.2%
24 2% 12.5%
12 5%
16.9% 12.9%
Other Financial Expenses 8.3%
8.6% 8.5%
3.3%
8.1%
1Q10 4Q09 1Q09 1Q10 4Q09 1Q09
8
9. Net Income
Results Evolution (iR$ thousand)
130,189
, ( ,
(11,631)
)
(7,137)
488 (3,589) (14,666)
(3,896)
(15,240)
730 ( ,
(22,479)
)
56,391
3,943
Net Income Gross Deductions Costs Grant Authority G&A Deprec. and Financial Financial Monetary IR&SC Net Income
1Q09 Revenues Expenses Expenses Amort. Revenues Expenses Correction Taxes 1Q10
of Fixed
Concession
Charge
+1330.2%
9
10. Debt Structure
Gross Indebtedness (in R$ million) Leverage Ratio and Net Debt (in R$ million)
Dívida Bruta (R$ Milhões)
1,936 Grau de Alavancagem e Dívida Líquida (R$ Milhões)
1,794 1,821
1,657 37
2.5x
2 5x 2.6x 2.4x
2 4x
1,425
1 425 739 2.2x
1.9x
1.9x
267 847 1.4x
1,012 1,037 922 1.0x 1.1x
691 690 1,784
1,291 1,325 1,346 1,354
1,197 1,174
375 355 933 935 1,158
947 915
735 652
316 335 416 471
79 102
1Q08 2Q08 3Q08 4Q08 1Q09 2Q09 3Q09 4Q09 1Q10 1Q08 2Q08 3Q08 4Q08 1Q09 2Q09 3Q09 4Q09 1Q10
Long Term Short Term Net Debt Net Debt/ (EBITDA-Fixed Concession Charge Paid) (LTM)
Debt Cost Breakdown Debt Amortization Schedule (in R$ million)
91.4%
Debt Amortization Schedule (R$ million)
985.8
53.0% CDI 813.8
50.3%
49.5%
49 5% 46.9%
46 9% TJLP
8.2% 12.8 5.0 3.6
0.2% 0.1% Other
apr/10 to 2011 2012 2013 2014
0.4%
dec/10
1Q09 4Q09 1Q10
10
11. Indebtedness
BNDES Bridge Loan (Federal Concessions):
In 1Q10, R$15.1 million was drawn by the federal concessions. By March 31, 2010, R$798.4 million had
, y y , ,
already been disbursed of the R$1.0 billion made available by the “BNDES Bridge Loan” contracted by the
federal concessions.
BNDES Long Term Loan (Federal Concessions):
The Company is structuring the long-term financing of the federal concessions with the BNDES. The first
disbursements of this credit line are expected in mid-2010.
Long-Term Loan (State Concessions):
The Autovias, Centrovias, Intervias and Vianorte state concessions have concluded their debenture issue
operation in the amount of R$1,372.8 million. The liquidation took place between the days of April 26 and 28,
2010.
2010
The resources from the issue will be chiefly allocated to: (i) refinancing of promissory notes issued in
November 2009 with a combined value of R$700 million, falling due in April 2010, from the Autovias,
Centrovias and Intervias concessions; (ii) settlement of the promissory notes issued in February 2010 and
used to pay Vianorte debt to the BNDES, in the amount of R$50 million, in advance and; (iii) additional
resources in the amount of R$622.8 million allocated to future investments and the payment of dividends of
these concessions.
11
12. Indebtedness
Issuers Autovias Centrovias Vianorte Intervias
R$285 Million R$286.1 Million R$153,8 Million R$307,9 Million
CDI + 1,6% CDI + 1,7% CDI + 1,7% CDI + 1,5%
Term: 5 years Term: 5 years Term: 5 years Term: 5 years
CDI Tranche Volume Duration: 2.3 years Duration: 2.3 years Duration: 2.3 years Duration: 2.3 years
Total CDI Volume: R$ 1,032.8 Million
R$120 Million R$120 Million R$100 Million
IPC-A
IPC A + 8% IPC-A
IPC A + 8% IPC-A
IPC A + 8%
Term: 7 years Term: 7 years Term: 7 years
IPC-A Tranche Volume Duration: 5 years Duration: 5 years Duration: 5 years
Total IPC-A Volume: R$ 340 Million
Total Volume Total Local Debentures Volume: R$ 1,372.8 Million
$
Issuance Date March 15, 2010
Rating (Moody s)
(Moody’s) Aa2.Br
Aa2 Br Aa3.Br
Aa3 Br Aa3.Br
Aa3 Br Aa1.Br
Aa1 Br
• Net Debt/ (EBITDA – Fixed Concession Fee) ≤ 3.50
Financial Covenants
• DSCR = (Cash + Net cash provided by operating activities) / Short Term Debt ≥1,2
Coordinators Itaú BBA, BTG Pactual and Santander (Co Manager)
BBA (Co-Manager)
Bookbuilding April 9, 2010
Closing Date April 30 2010
30,
12
13. CapEx
CapEx Breakdown 1Q10 – R$128 6 million*
C E B kd R$128.6 illi *
11.76% 3.94%
11.48%
5.67%
21.53% 7.72%
10.14%
20.54% 7.23%
Estimated investments for the next 5 years (2010 to 2014), as scheduled under the
concession agreements:
State Concessions: R$598 million;
St t C i illi
Federal Concessions: R$3.8 billion.
* Not considering investments in other subsidiaries, holding and adjustments of consolidation.
13