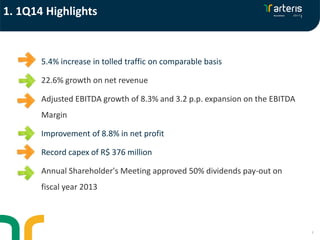
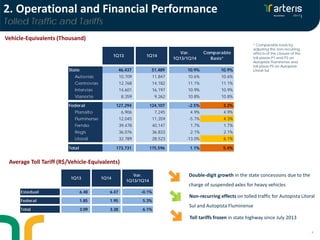
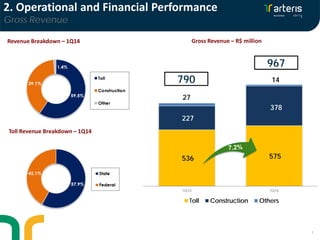
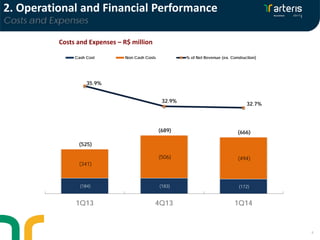
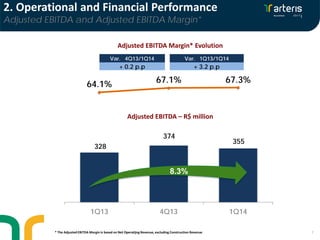
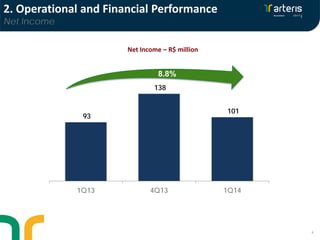
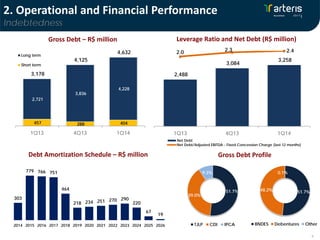
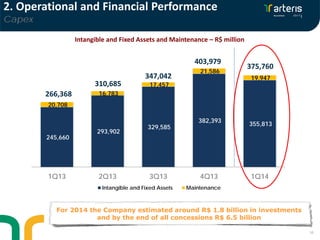
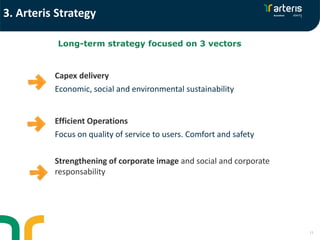
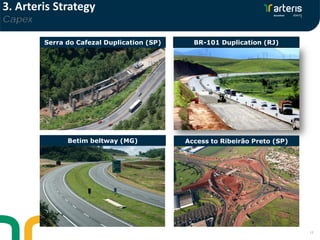
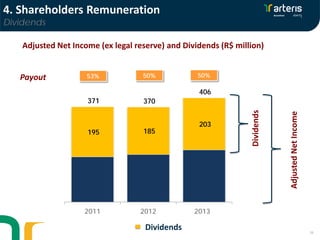
The document summarizes Arteris' 1Q14 results conference call. It discusses the company's operational and financial performance for the quarter, including a 5.4% increase in tolled traffic and growth in revenue and EBITDA. It also outlines the company's strategy going forward, which focuses on efficient capex delivery, sustainability, operations, and strengthening its corporate image. The document notes Arteris plans to pay a 50% dividend for fiscal year 2013 results.
Excellent Results which underline how the process of intense change started in 2014 has transformed Eni into a company able to grow and create value even in difficult market conditions.
Meet generation Z, the 12- to 19-year-old cohort, who care deeply about ethical consumption, are the most progressive generation to date, use digital technology more than any previous group, and are set to change the world with their optimism and ambition.
This is an executive summary of the report. To purchase the full 79-page report, visit www.jwtintelligence.com.
2. index
2Investor Relations
1. 1Q14 Highlights
2. Operational and Financial Performance
3. Strategy
4. Shareholders Remuneration
5. Q & A
3. 3
5.4% increase in tolled traffic on comparable basis
22.6% growth on net revenue
Adjusted EBITDA growth of 8.3% and 3.2 p.p. expansion on the EBITDA
Margin
Improvement of 8.8% in net profit
Record capex of R$ 376 million
Annual Shareholder's Meeting approved 50% dividends pay-out on
fiscal year 2013
1. 1Q14 Highlights
4. 4
Average Toll Tariff (R$/Vehicle-Equivalents)
Vehicle-Equivalents (Thousand)
2. Operational and Financial Performance
Tolled Traffic and Tariffs
Double-digit growth in the state concessions due to the
charge of suspended axles for heavy vehicles
Non-recurring effects on tolled traffic for Autopista Litoral
Sul and Autopista Fluminense
Toll tariffs frozen in state highway since July 2013
* Comparable basis by
adjusting the non-recurring
effects of the closure of the
toll plazas P1 and P2 on
Autopista Fluminense and
toll plaza P5 on Autopista
Litoral Sul
1Q13 1Q14
Var.
1Q13/1Q14
Comparable
Basis*
State 46,437 51,489 10.9% 10.9%
Autovias 10,709 11,847 10.6% 10.6%
Centrovias 12,768 14,182 11.1% 11.1%
Intervias 14,601 16,197 10.9% 10.9%
Vianorte 8,359 9,262 10.8% 10.8%
Federal 127,294 124,107 -2.5% 3.2%
Planalto 6,906 7,245 4.9% 4.9%
Fluminense 12,045 11,359 -5.7% 4.3%
Fernão 39,478 40,147 1.7% 1.7%
Regis 36,076 36,833 2.1% 2.1%
Litoral 32,789 28,523 -13.0% 6.1%
Total 173,731 175,596 1.1% 5.4%
1Q13 1Q14
Var.
1Q13/1Q14
Estadual 6.48 6.47 -0.1%
Federal 1.85 1.95 5.3%
Total 3.09 3.28 6.1%
6. 6
Costs and Expenses – R$ million
2. Operational and Financial Performance
Costs and Expenses
(184) (183) (172)
(341)
(506) (494)
(525)
(689) (666)
35.9%
32.9%
32.7%
20%
22%
24%
26%
28%
30%
32%
34%
36%
38%
40%(1600.0)
(1400.0)
(1200.0)
(1000.0)
(800.0)
(600.0)
(400.0)
(200.0)
-
1Q13 4Q13 1Q14
Cash Cost Non Cash Costs % of Net Revenue (ex. Construction)
7. 7
Var. 4Q13/1Q14 Var. 1Q13/1Q14
+ 0.2 p.p + 3.2 p.p
Adjusted EBITDA Margin* Evolution
Adjusted EBITDA – R$ million
* The Adjusted EBITDA Margin is based on Net Operatijng Revenue, excluding Construction Revenue
2. Operational and Financial Performance
Adjusted EBITDA and Adjusted EBITDA Margin*
328
374
355
64.1% 67.1% 67.3%
1Q13 4Q13 1Q14
8.3%
8. 8
Net Income – R$ million
8.8%
2. Operational and Financial Performance
Net Income
93
138
101
1Q13 4Q13 1Q14
9. 9
51.7%
39.0%
9.3%
TJLP CDI IPCA
Leverage Ratio and Net Debt (R$ million)Gross Debt – R$ million
Debt Amortization Schedule – R$ million Gross Debt Profile
303
779 766 751
464
218 234 251 270 290
220
67
19
2014 2015 2016 2017 2018 2019 2020 2021 2022 2023 2024 2025 2026
2. Operational and Financial Performance
Indebtedness
51.7%48.2%
0.1%
BNDES Debentures Other
457 288 404
2,721
3,836
4,228
3,178
4,125
4,632
1Q13 4Q13 1Q14
Long term
Short term
2,488
3,084
3,258
2.0 2.3 2.4
1Q13 4Q13 1Q14
Net Debt
Net Debt/Adjusted EBITDA - Fixed Concession Charge (last 12 months)
10. 10
266,368
310,685
347,042
403,979
375,760
Intangible and Fixed Assets and Maintenance – R$ million
For 2014 the Company estimated around R$ 1.8 billion in investments
and by the end of all concessions R$ 6.5 billion
2. Operational and Financial Performance
Capex
245,660
293,902
329,585
382,393
355,813
20,708
16,783
17,457
21,586
19,947
1Q13 2Q13 3Q13 4Q13 1Q14
Intangible and Fixed Assets Maintenance
11. Capex delivery
Economic, social and environmental sustainability
Efficient Operations
Focus on quality of service to users. Comfort and safety
Strengthening of corporate image and social and corporate
responsability
Long-term strategy focused on 3 vectors
11
3. Arteris Strategy
12. Serra do Cafezal Duplication (SP) BR-101 Duplication (RJ)
Betim beltway (MG) Access to Ribeirão Preto (SP)
12
3. Arteris Strategy
Capex
12
15. A more efficient organization
Commitment to improve security:
– To reduce the numbers of accidents and deaths on the roads
Redefinition of corporate policies and controlling shareholders ´s best practices
model as benchmark
– Focus on manageable costs
– Centralized purchasing
– Shared Services Center
– SAP implementation
– Toll collection process improvement
Remuneration based on performance
Goal is to reduce R$ 60 million per year on cash costs after the full
implementation of the efficiency plan
15
3. Arteris Strategy
Efficient Operations
16. Adjusted Net Income (ex legal reserve) and Dividends (R$ million)
50% 50%Payout 25%
Dividends
AdjustedNetIncome
16
195 185
203
371 370
406
2011 2012 2013E
53%
4. Shareholders Remuneration
Dividends
Dividends