Download as PDF, PPTX
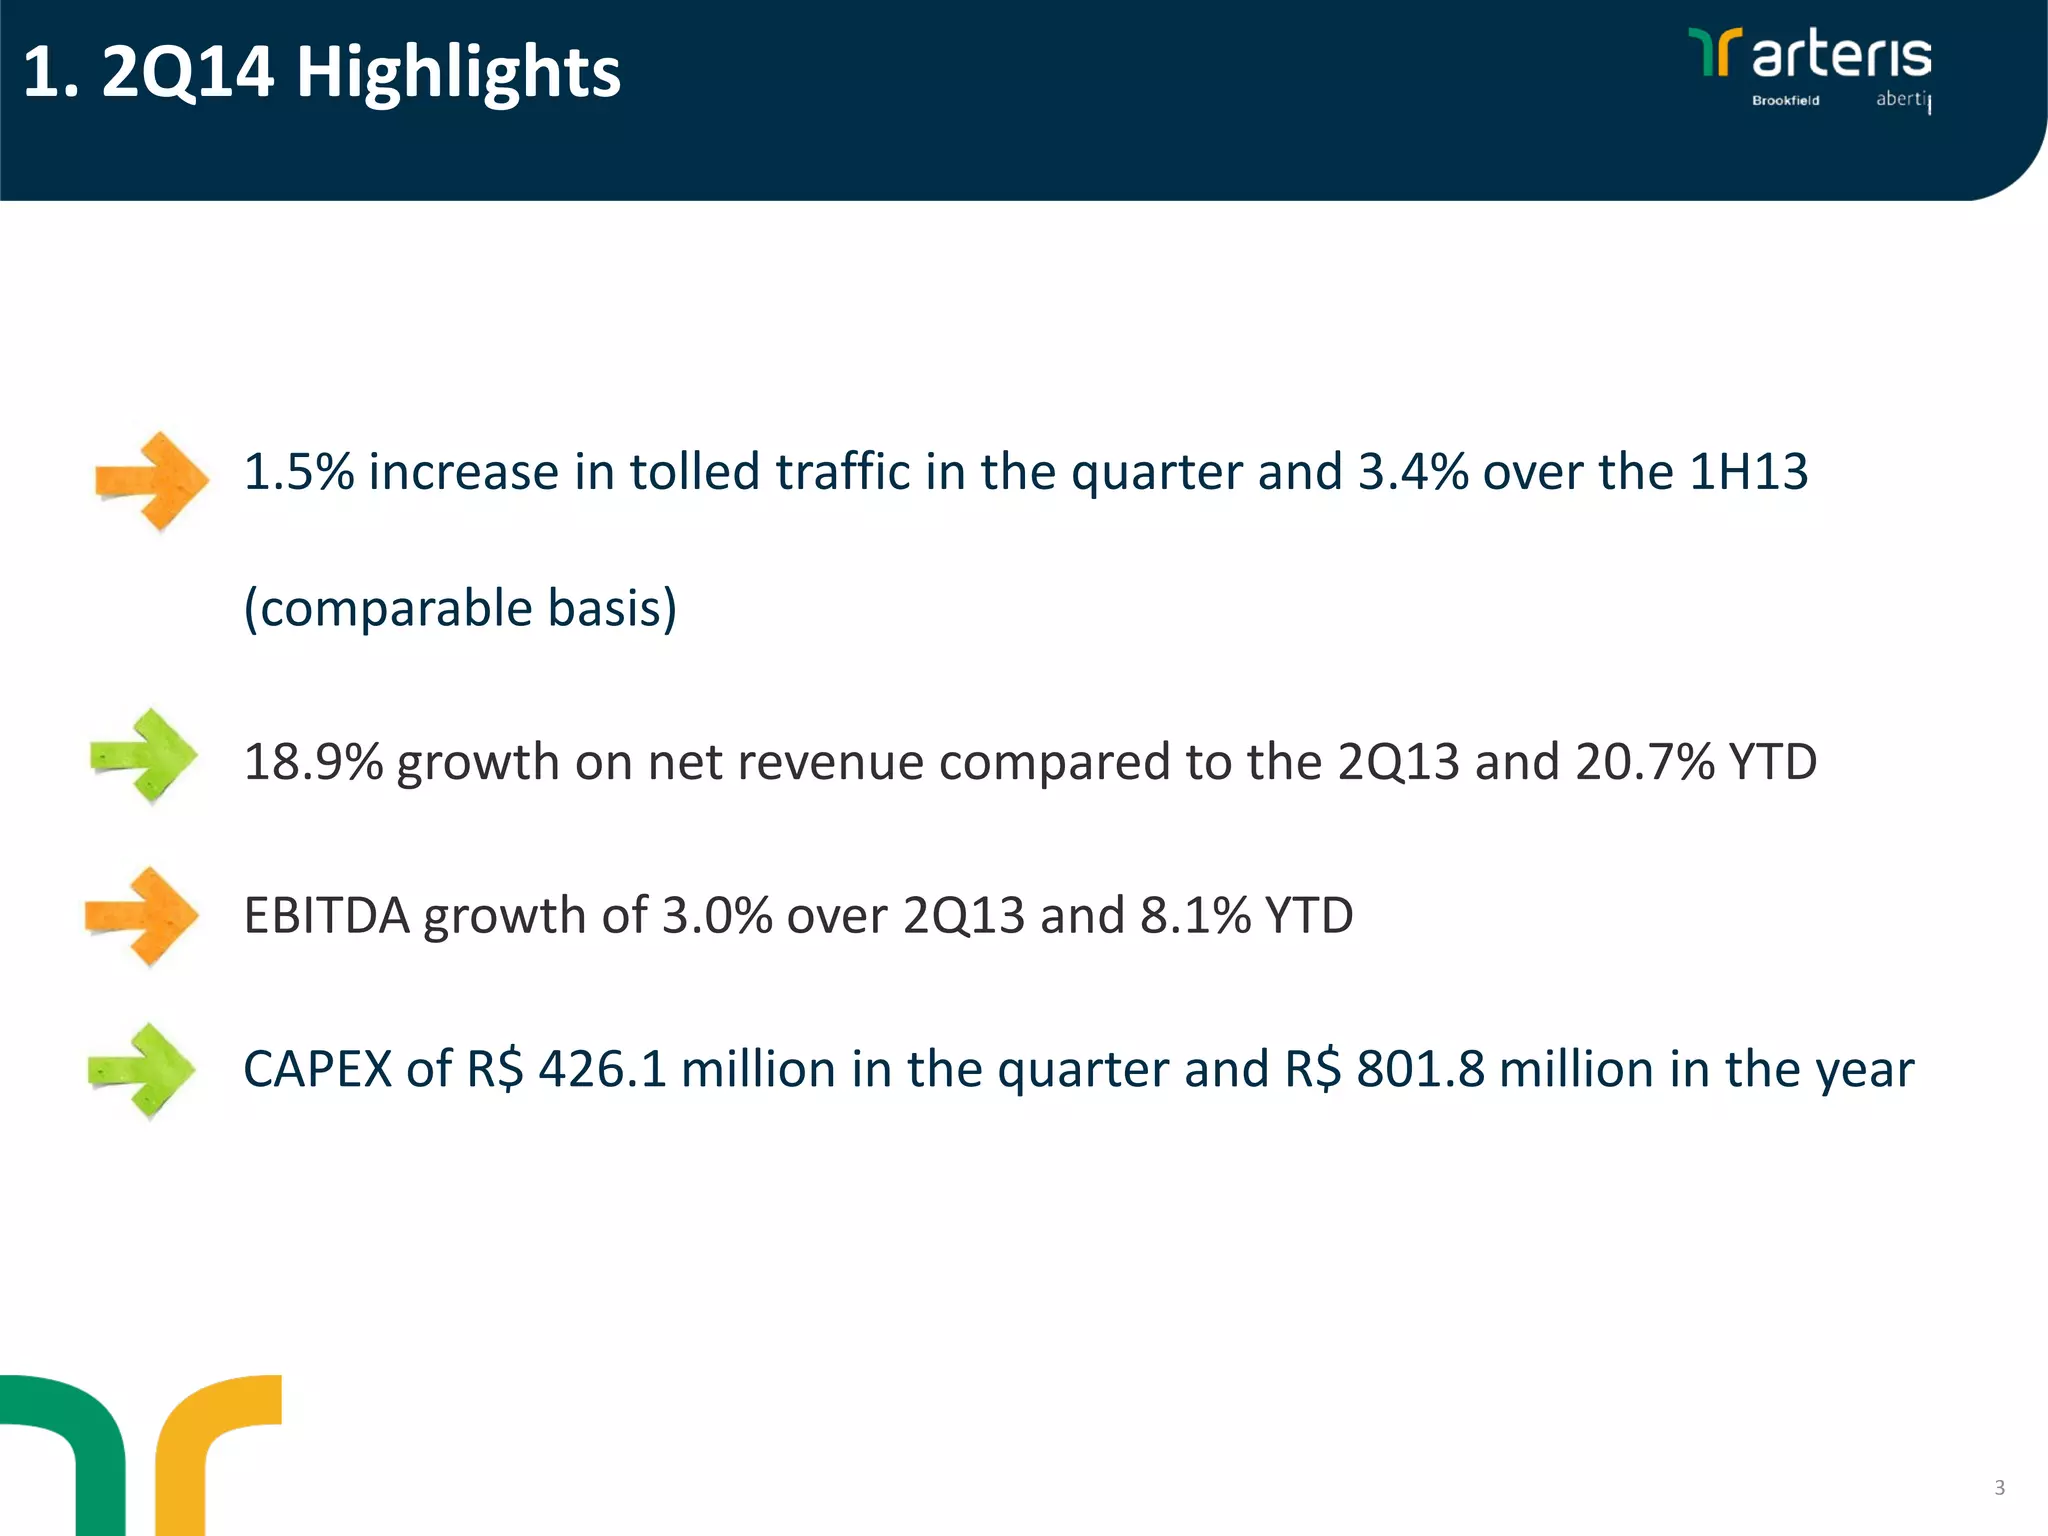
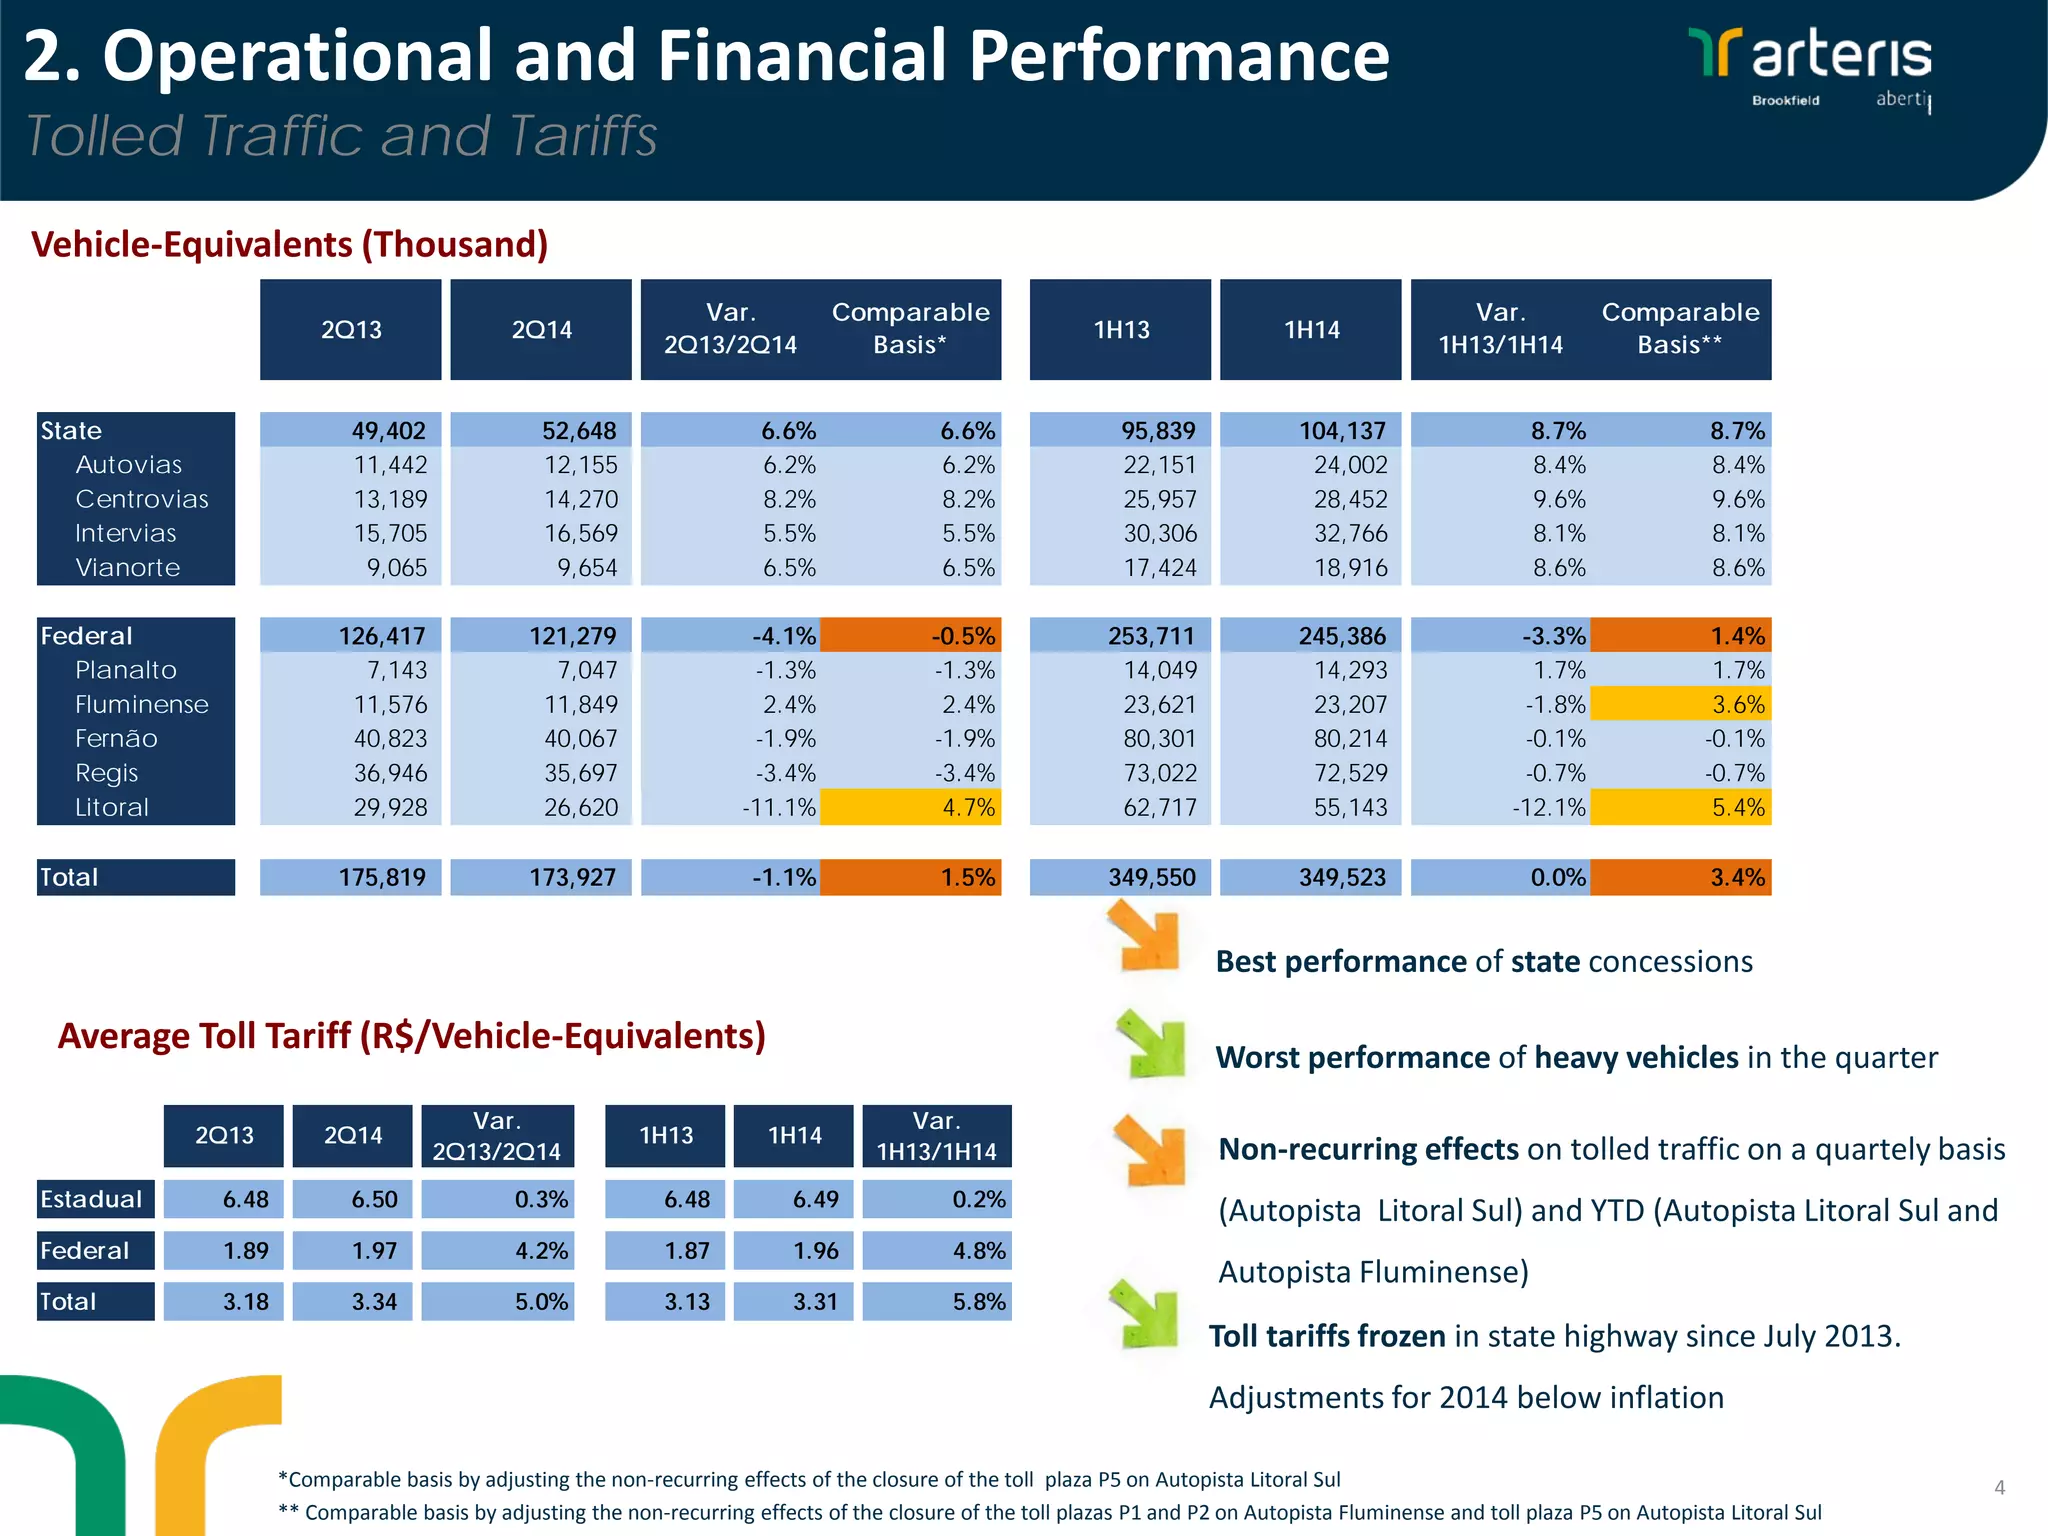
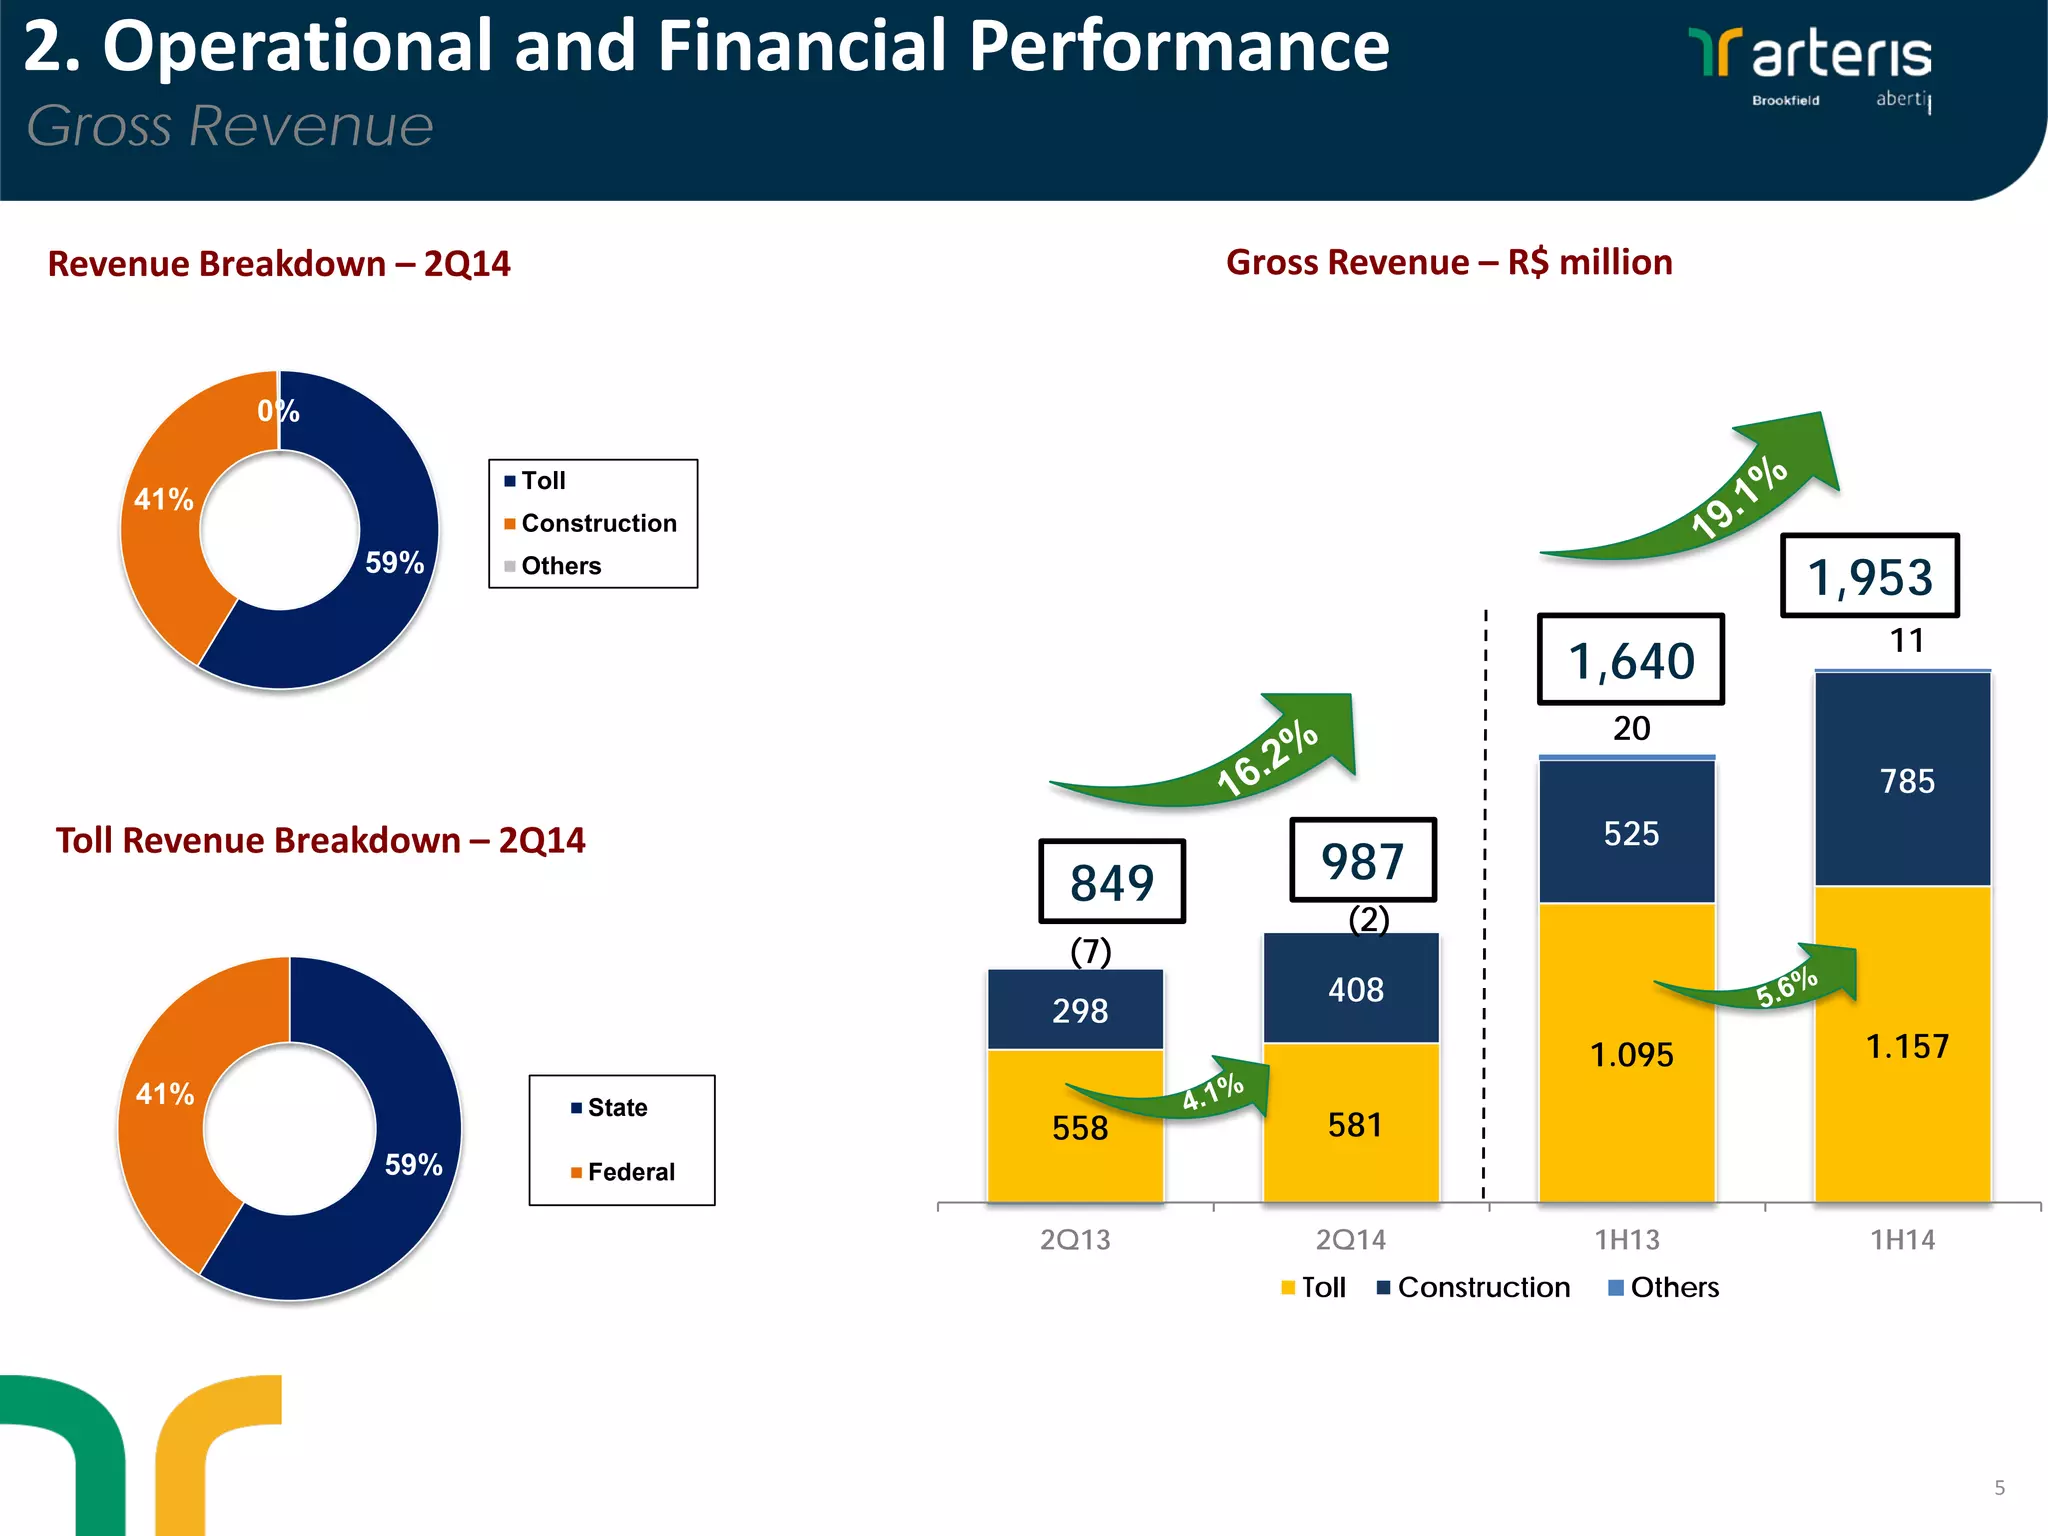
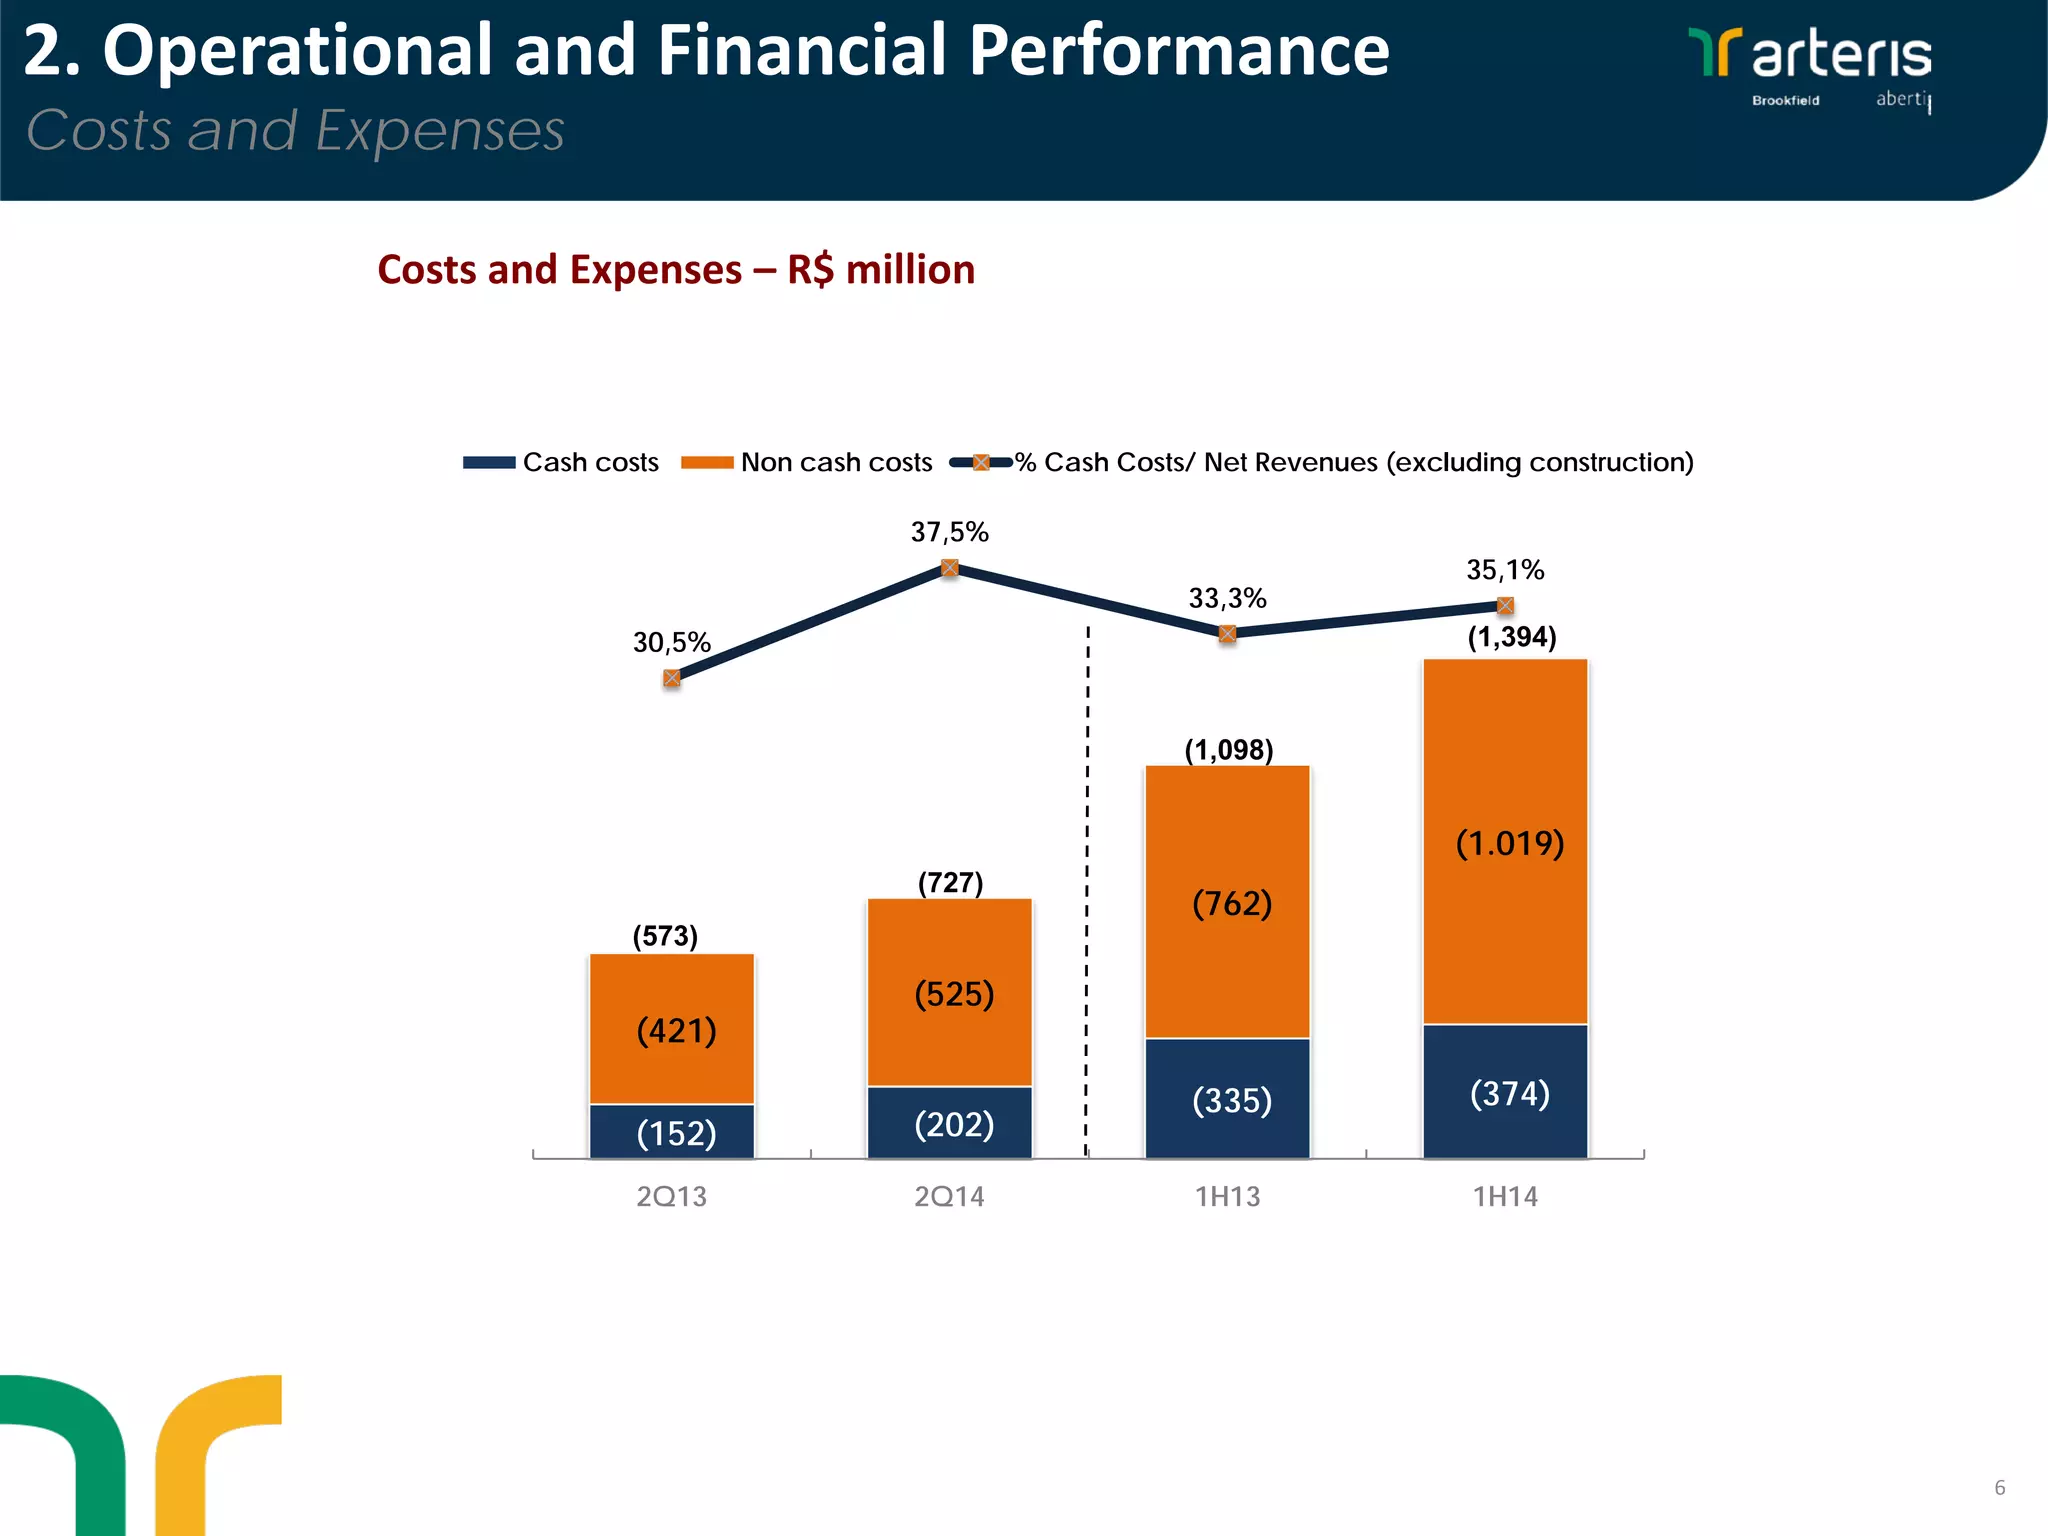
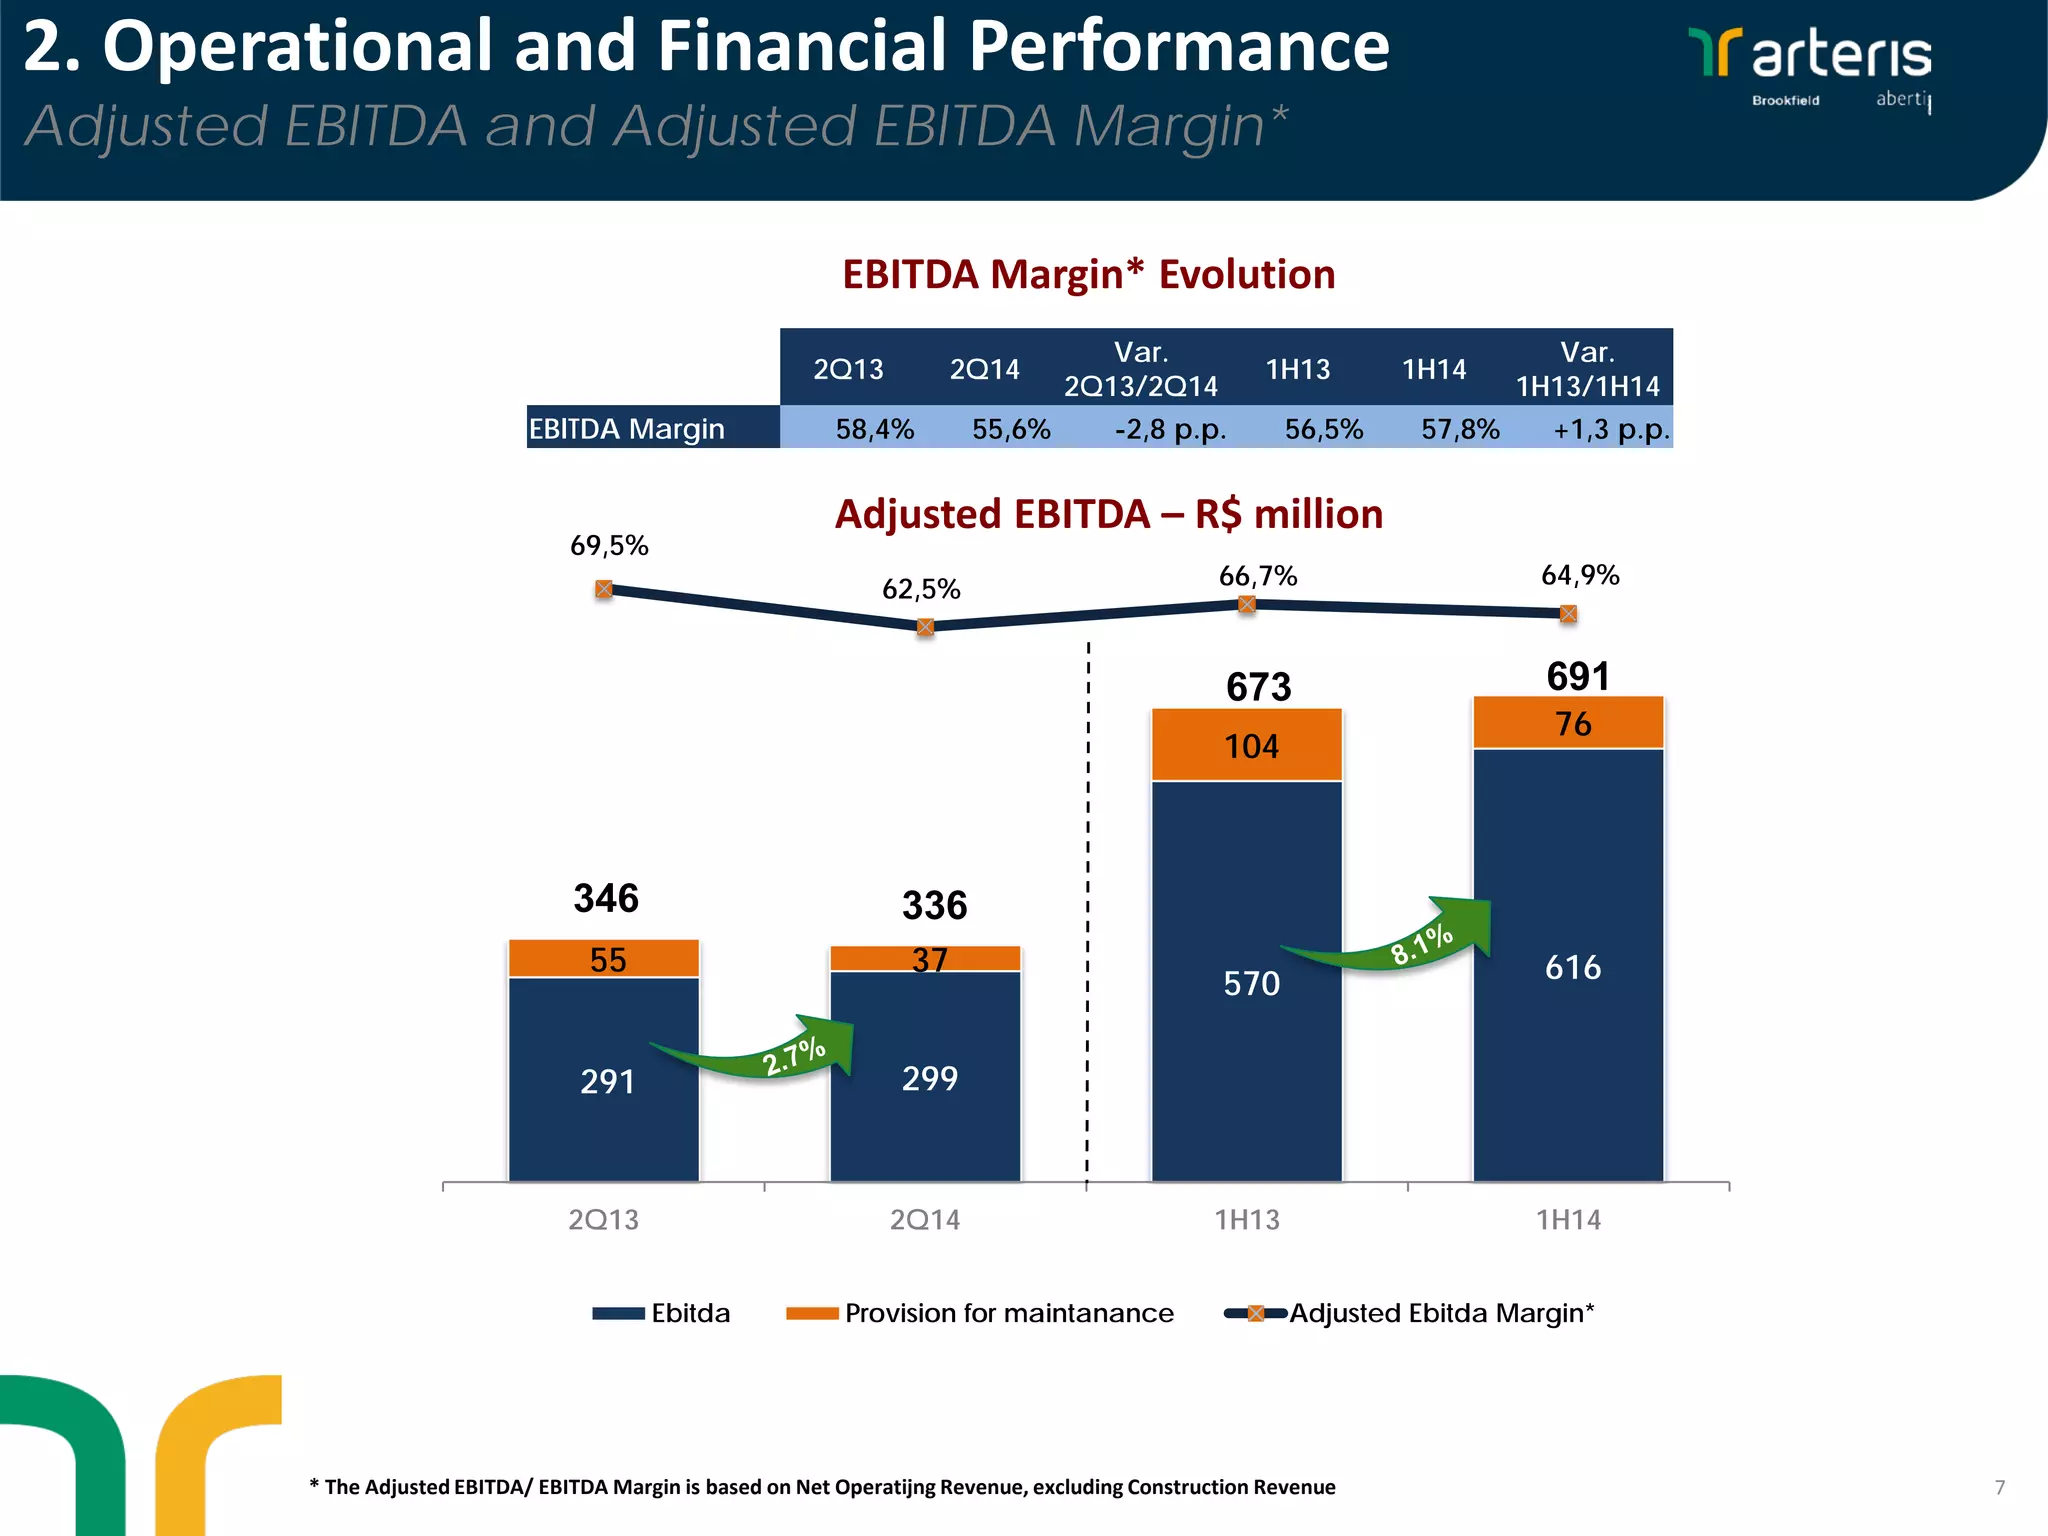
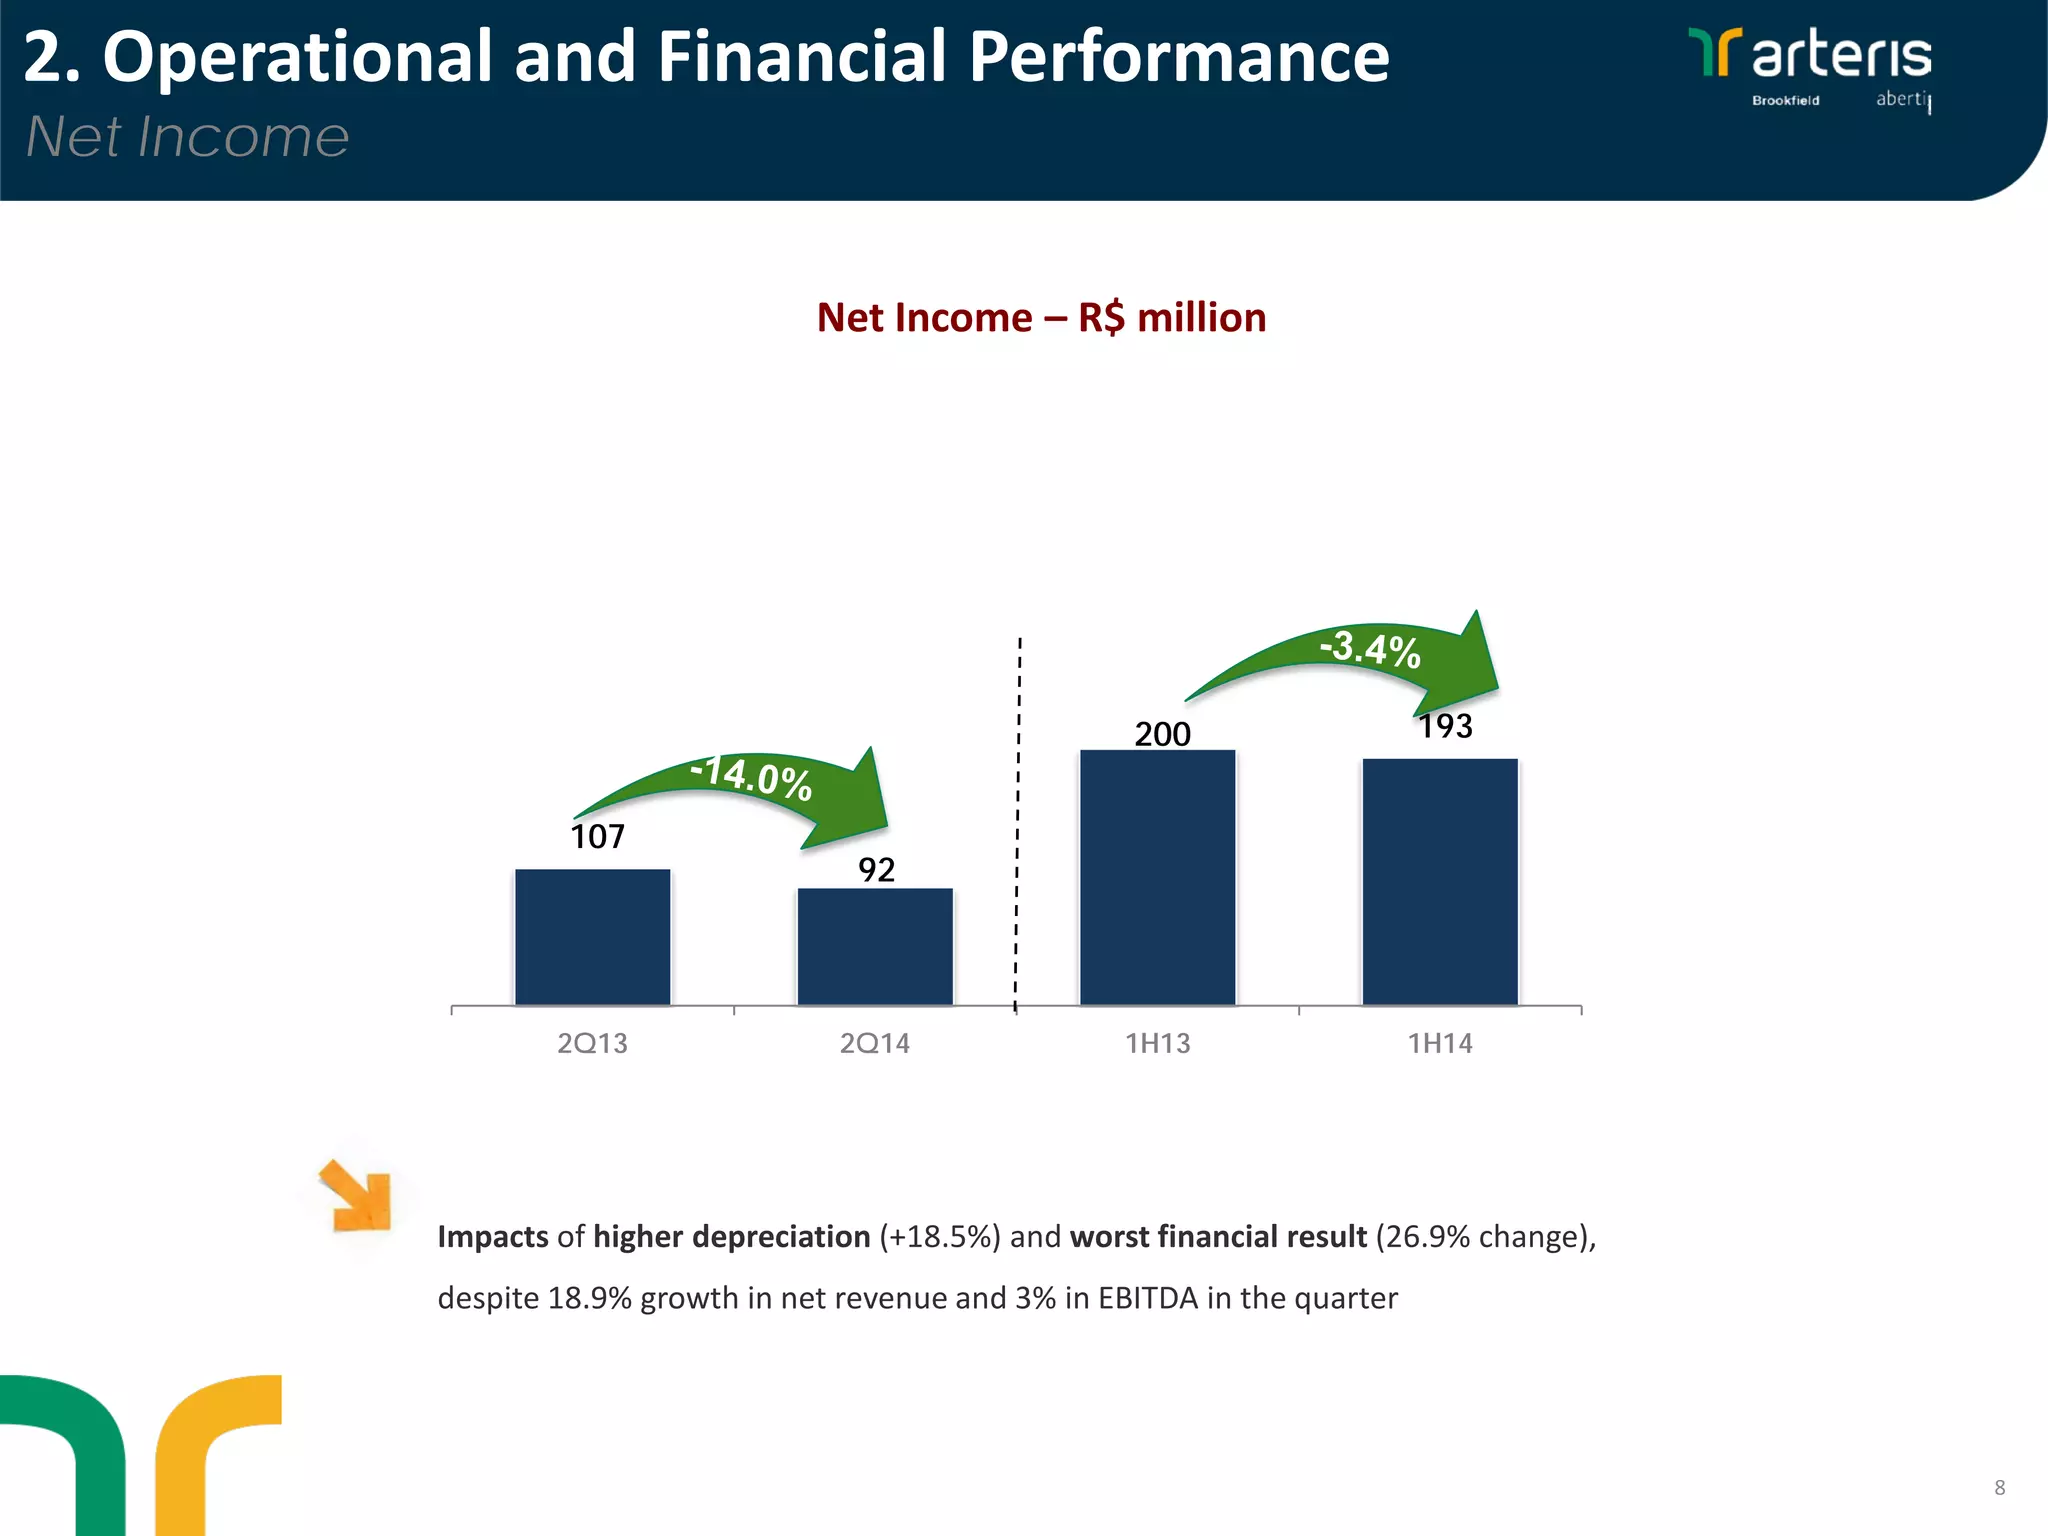

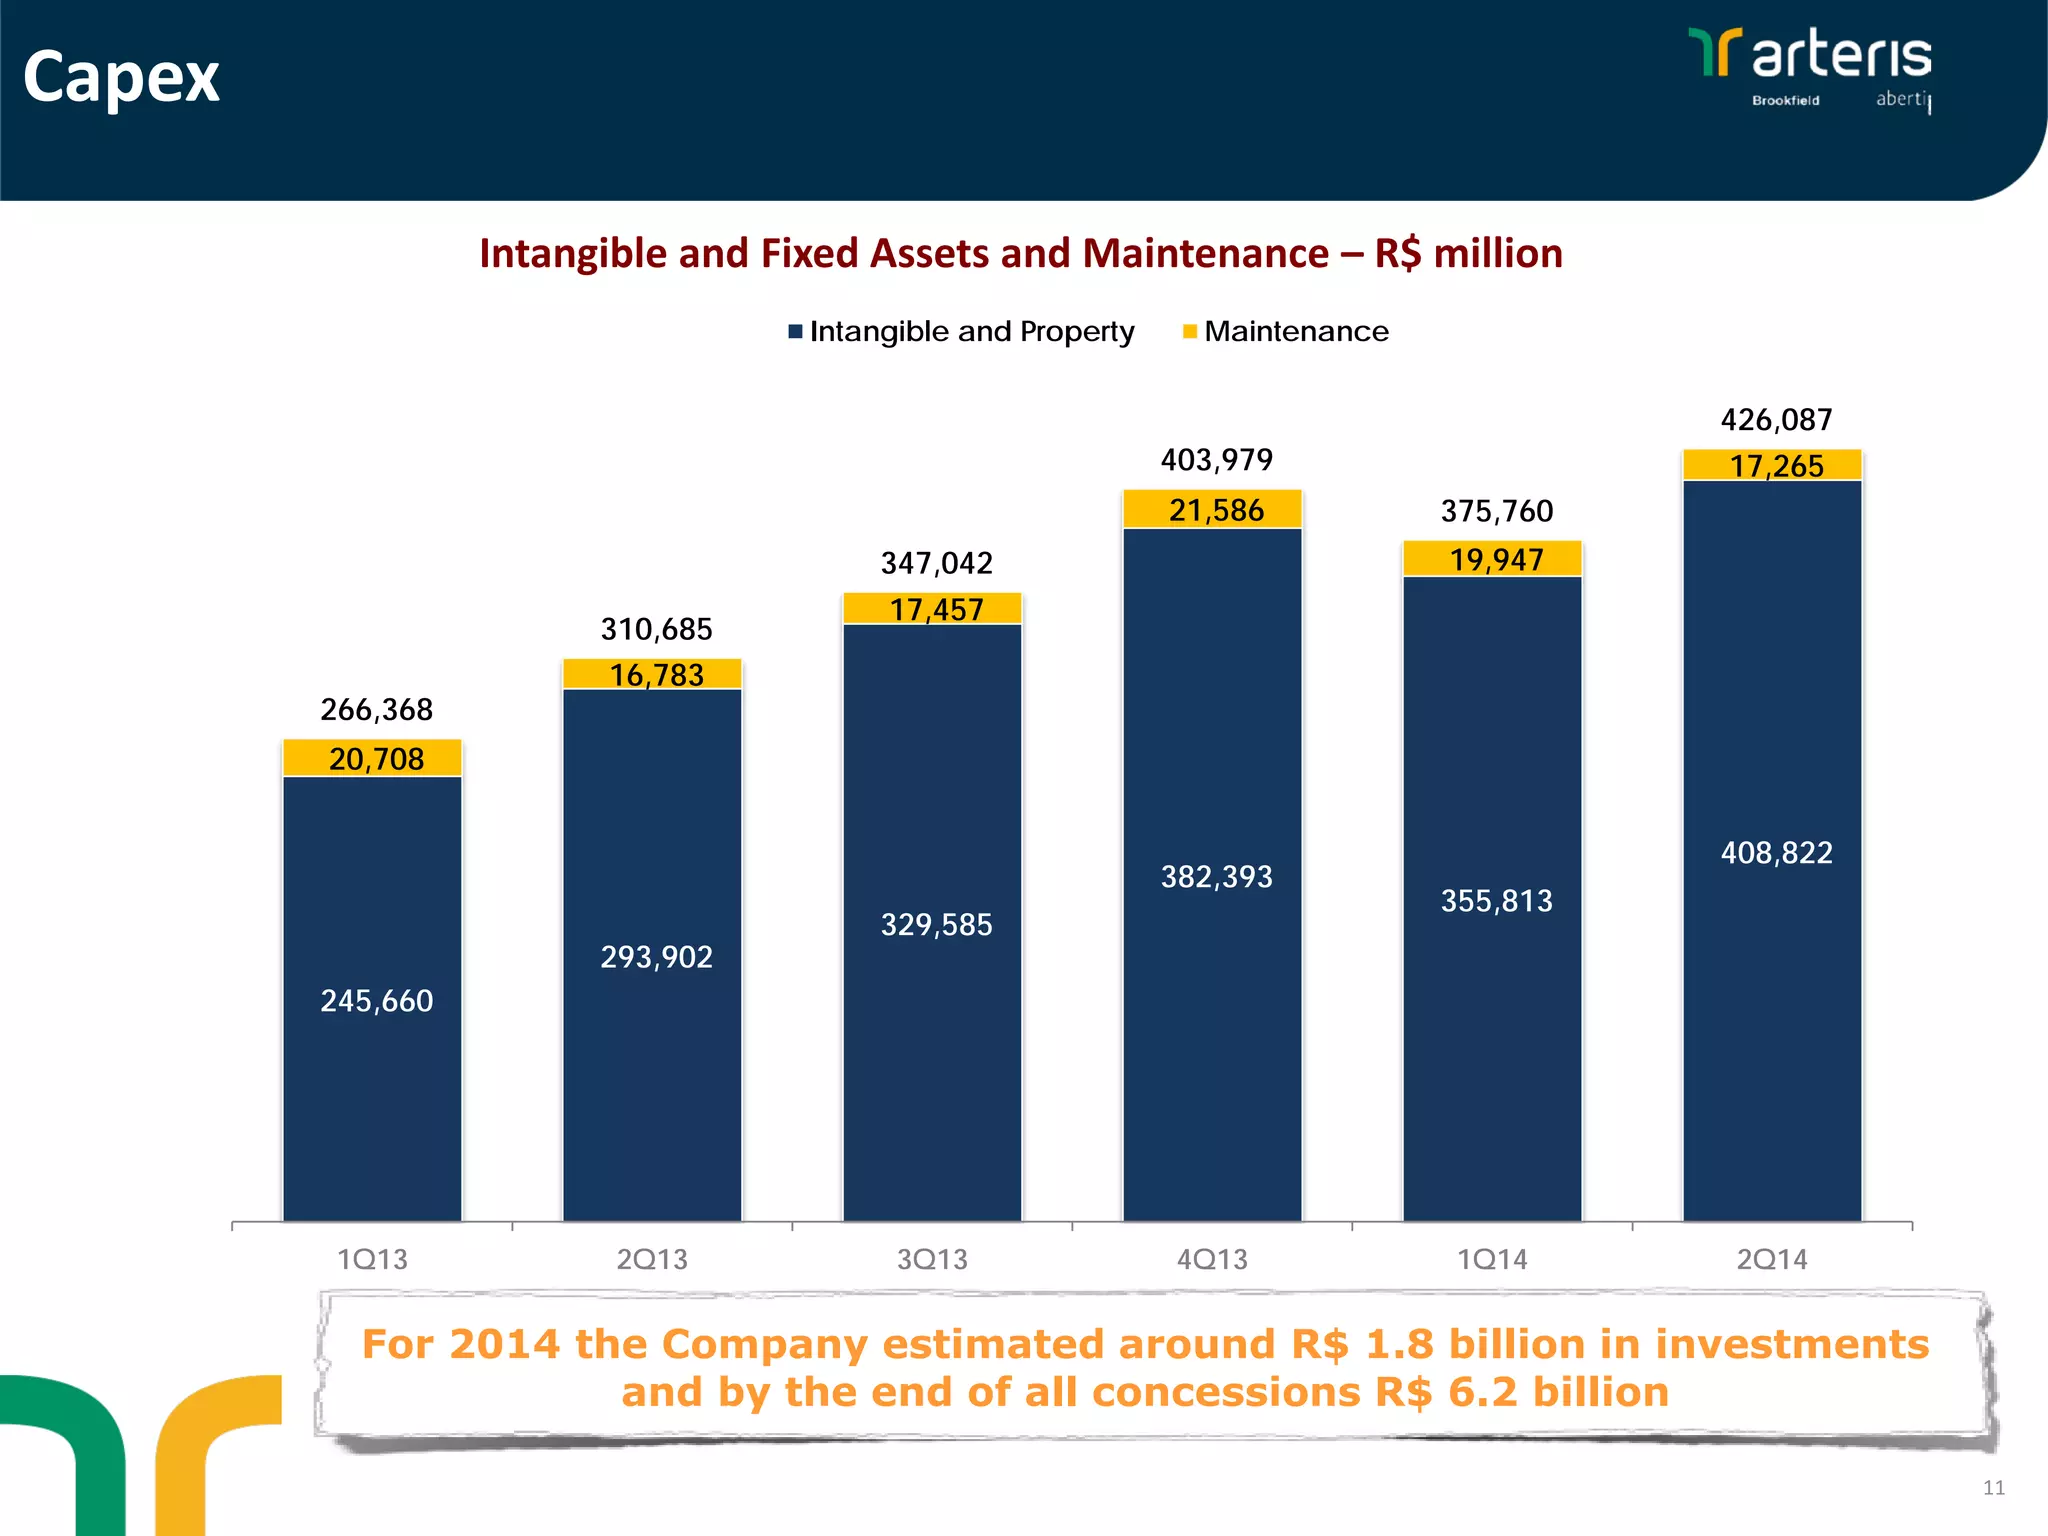

The document summarizes Arteris' second quarter 2014 results conference call. It highlights a 1.5% increase in tolled traffic and 18.9% growth in net revenue compared to Q2 2013. EBITDA grew 3% over Q2 2013. Capex totaled R$426.1 million for the quarter. Management discussed operational and financial performance, strategy focused on economic, social and environmental sustainability, and estimated capex of R$1.8 billion for 2014.


