Download to read offline

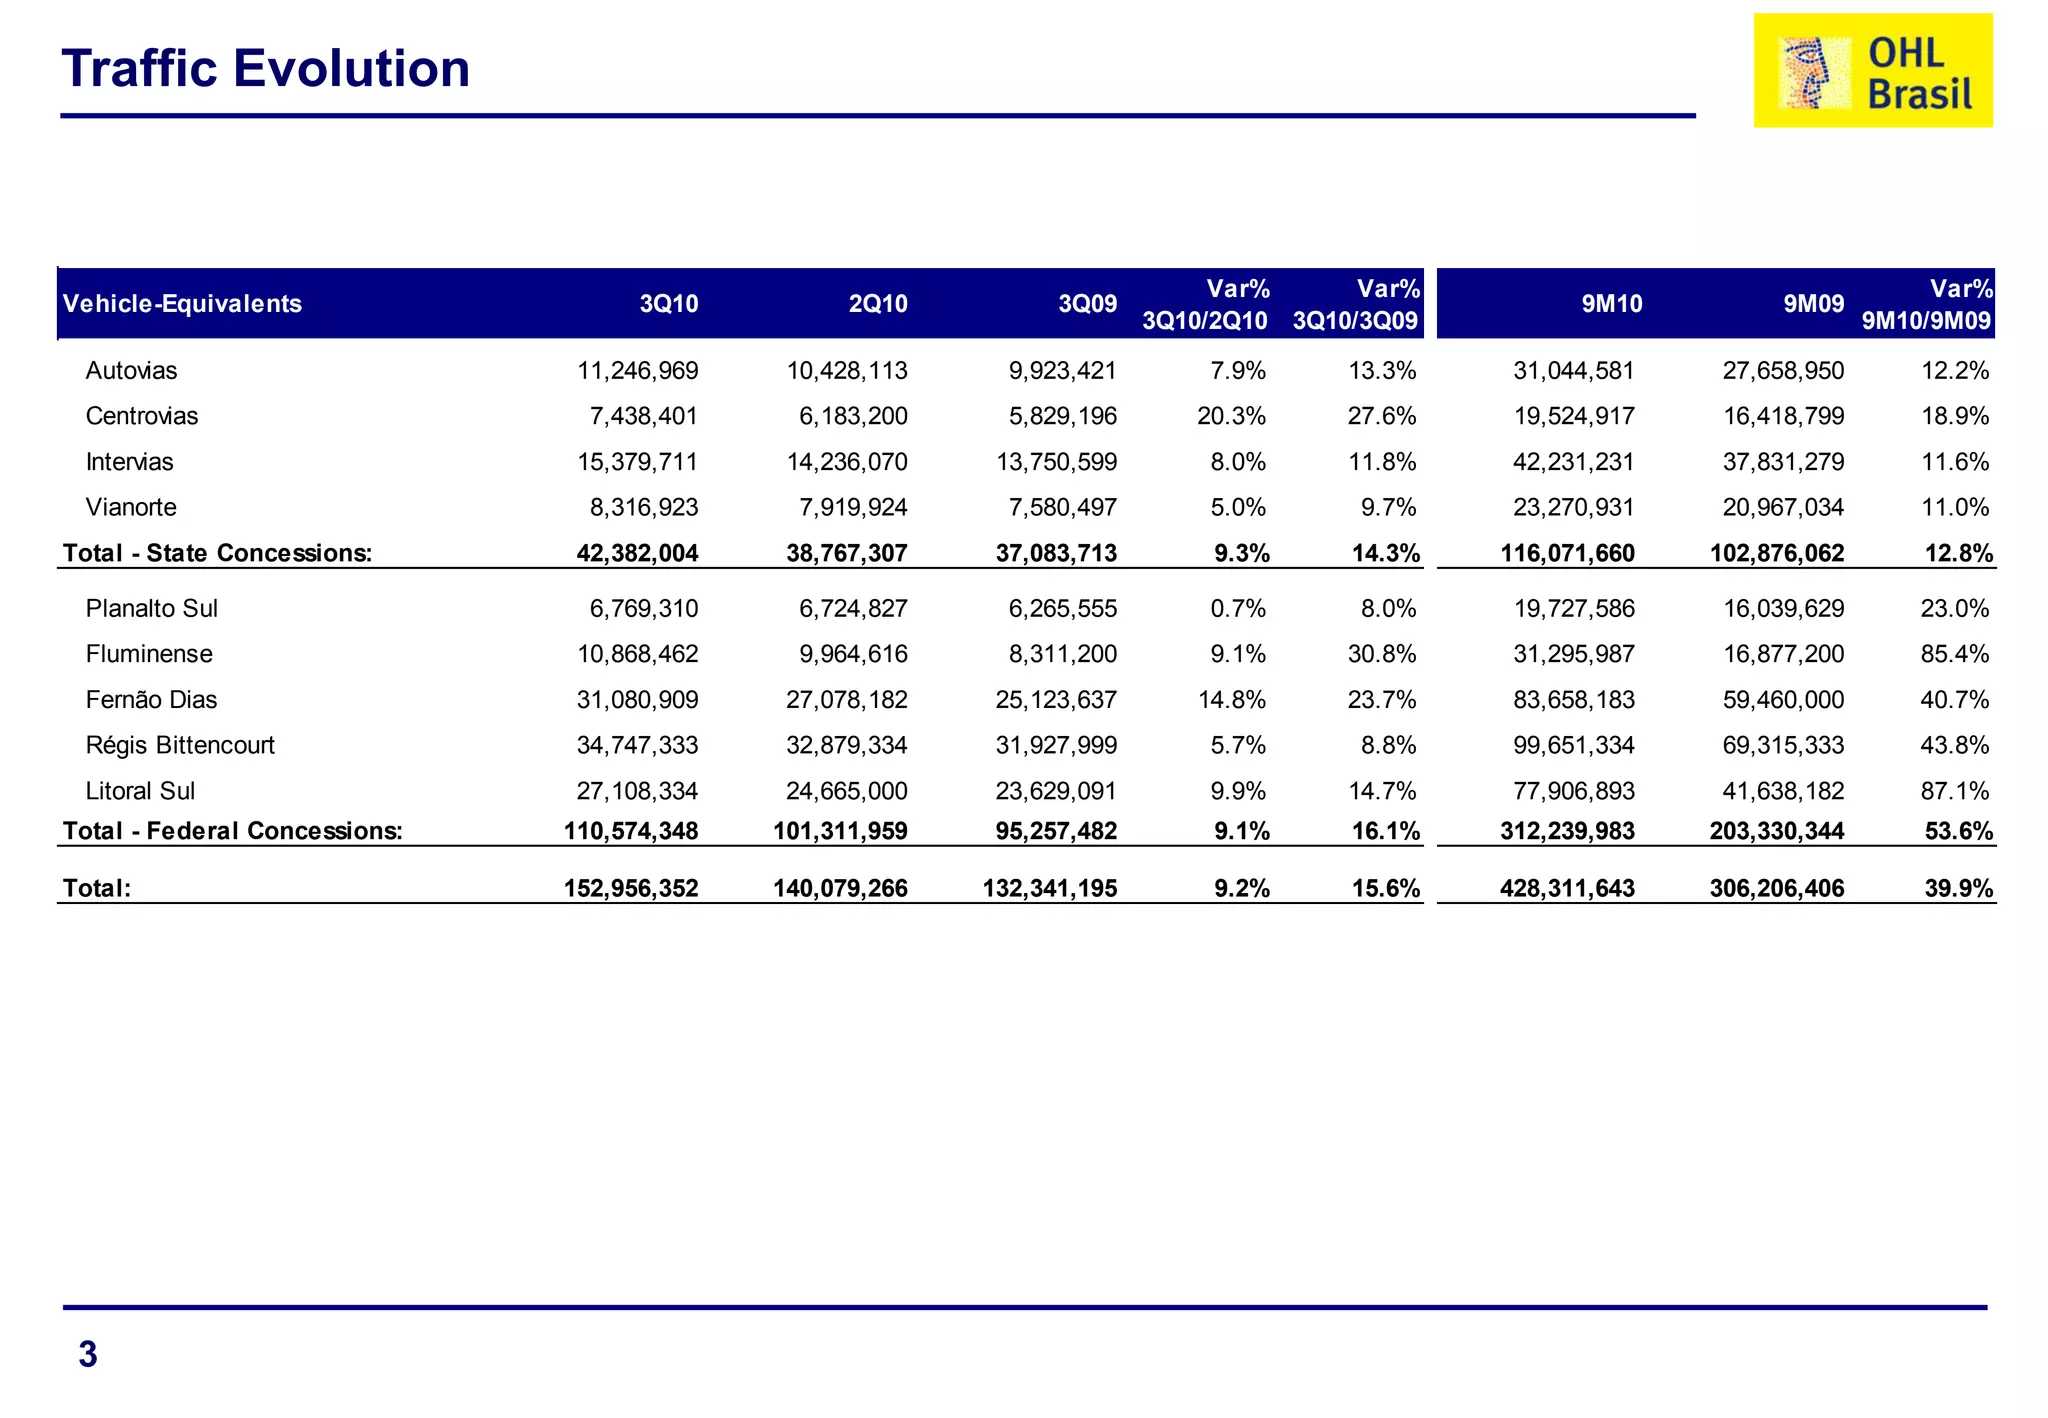
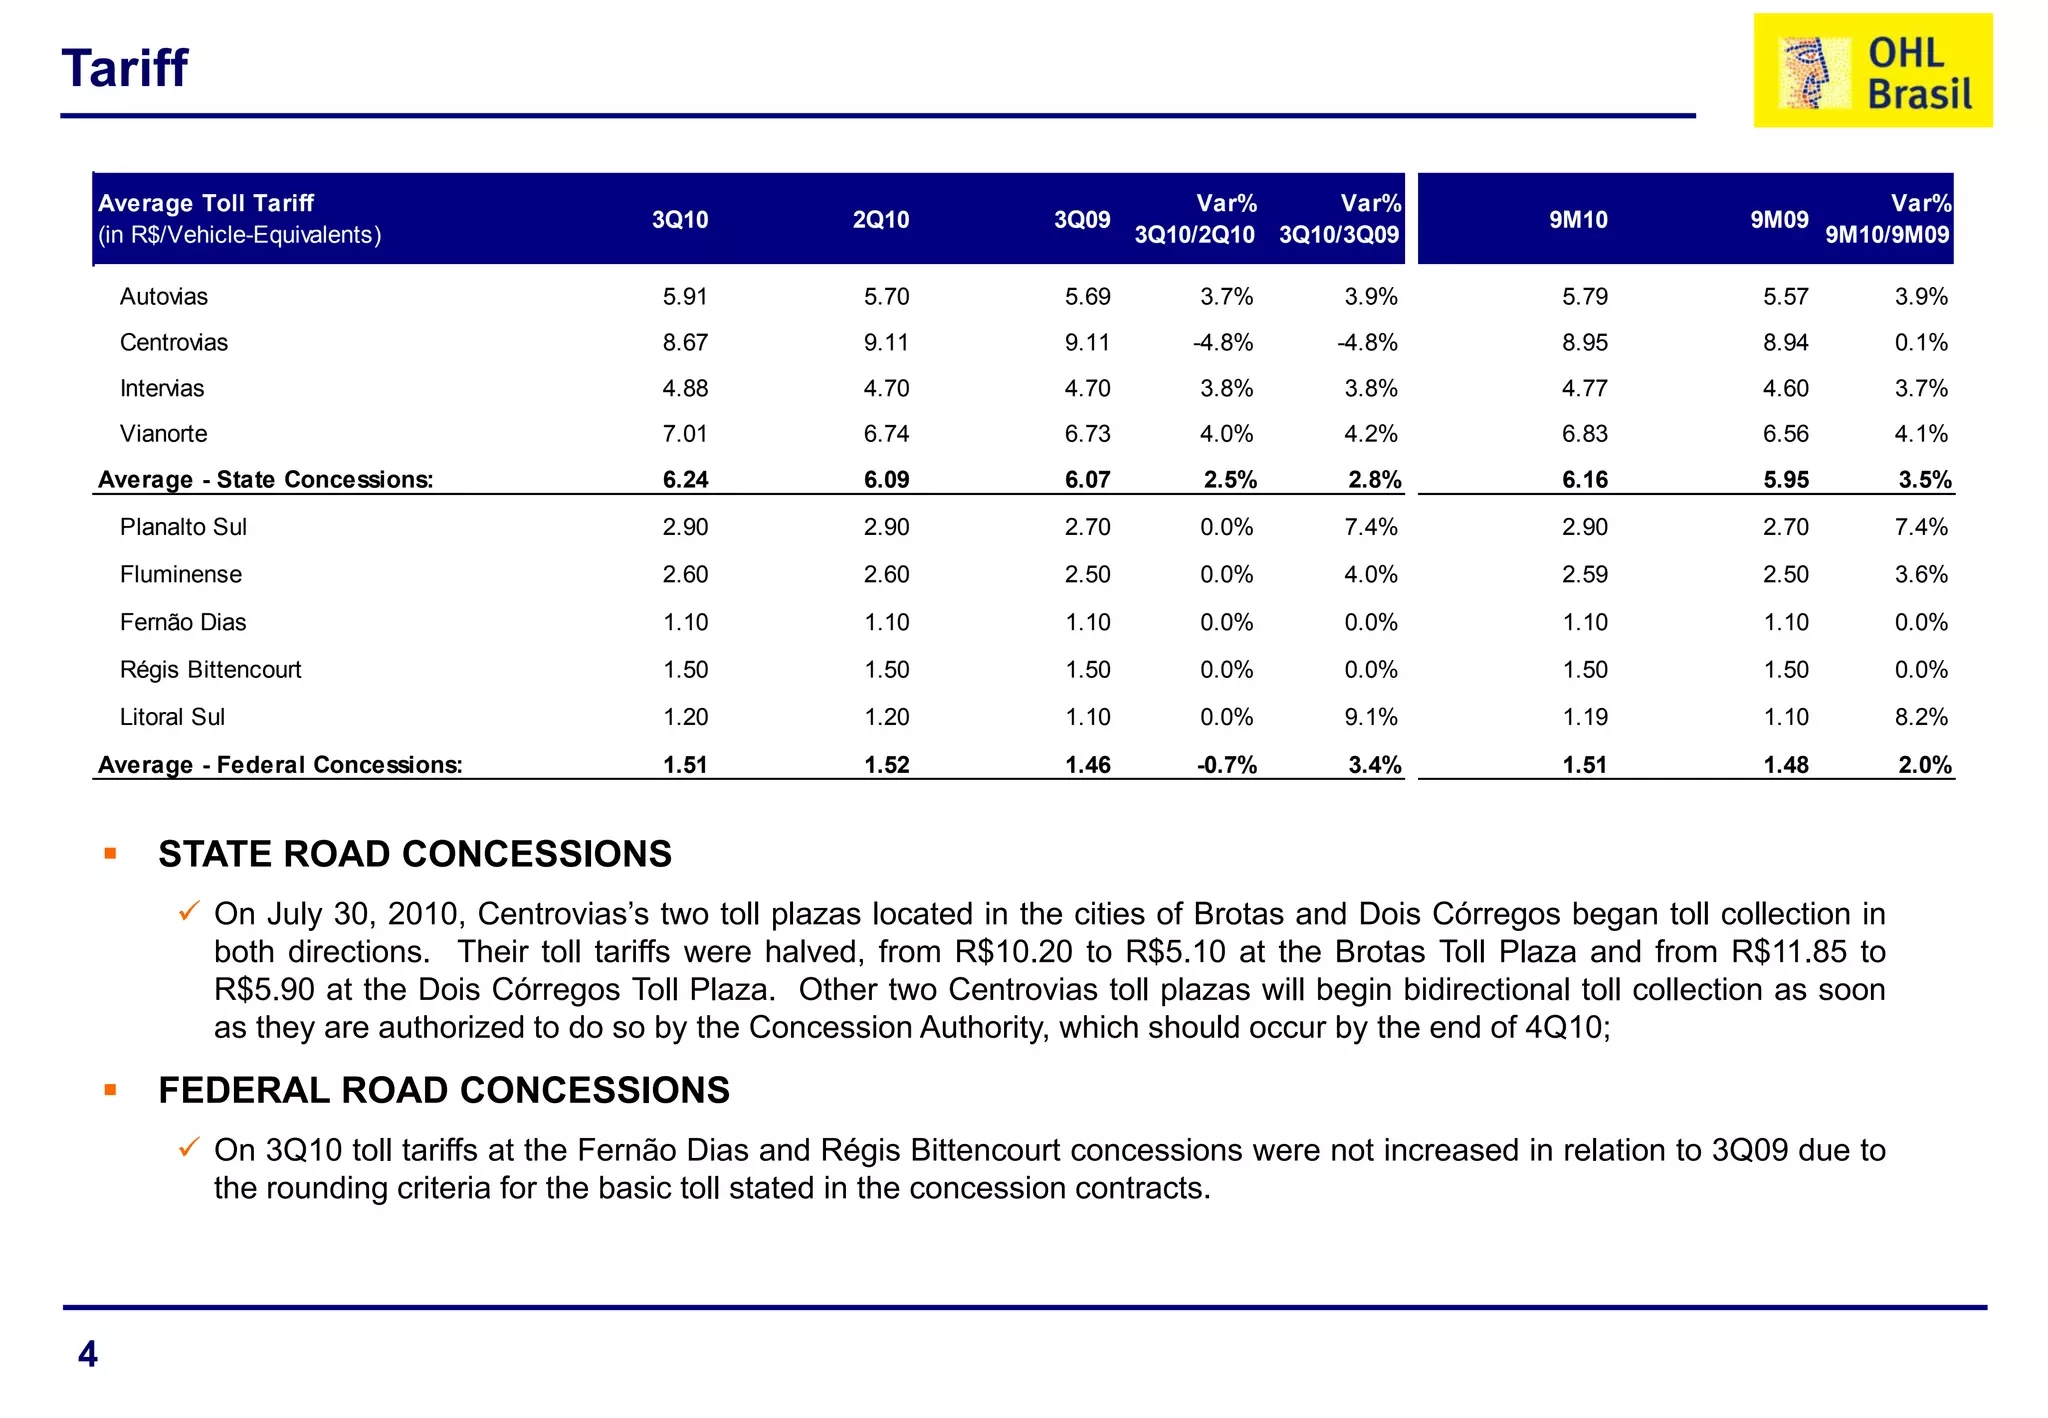
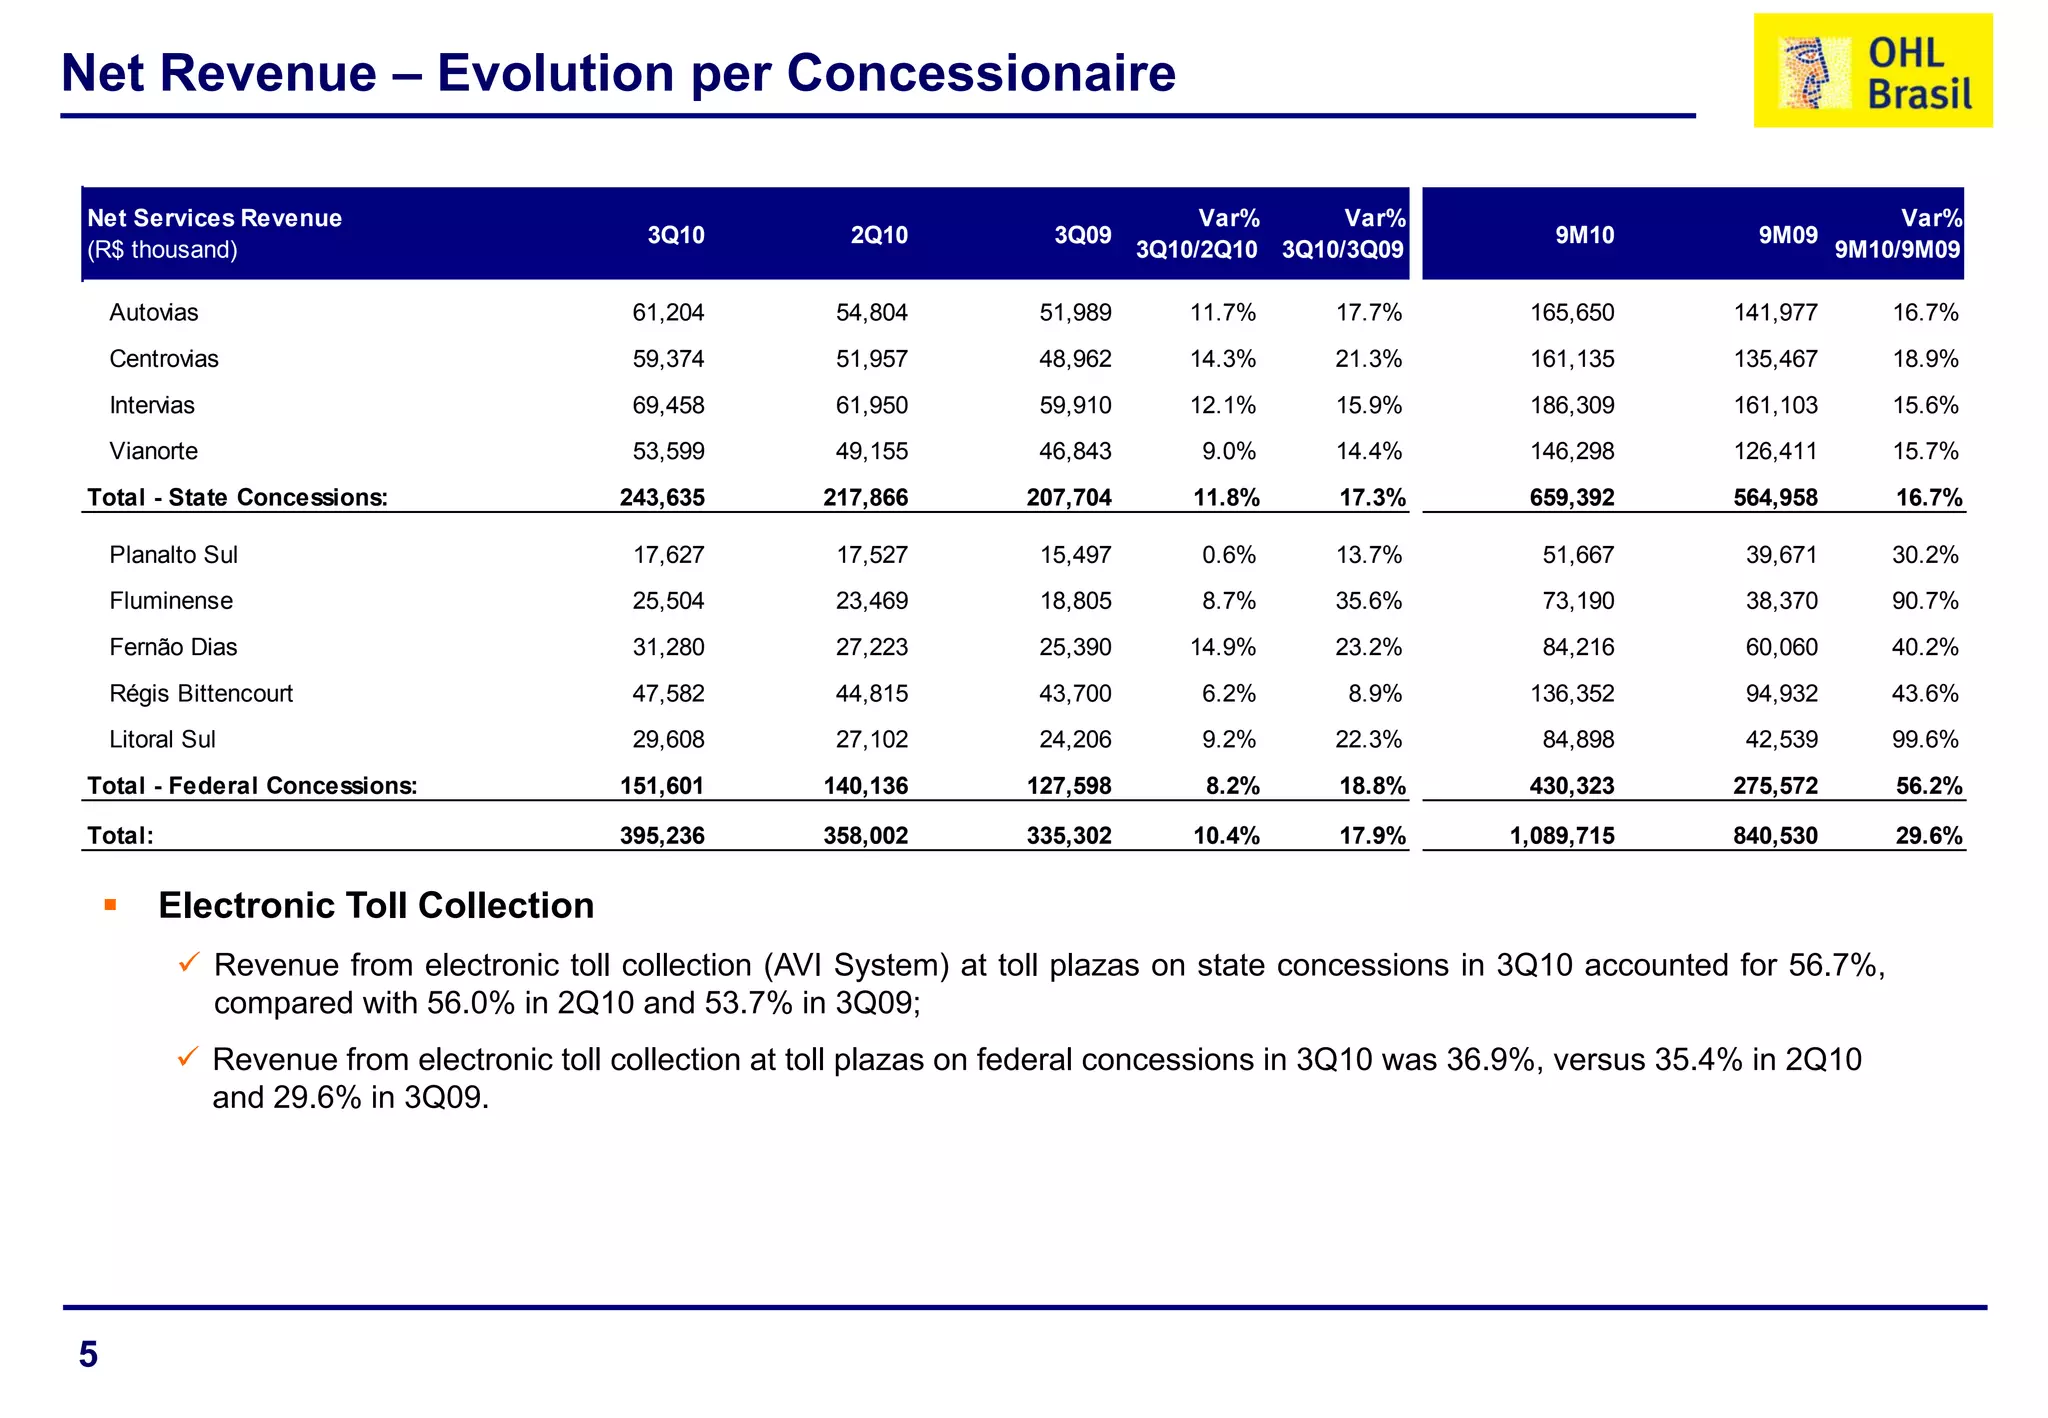
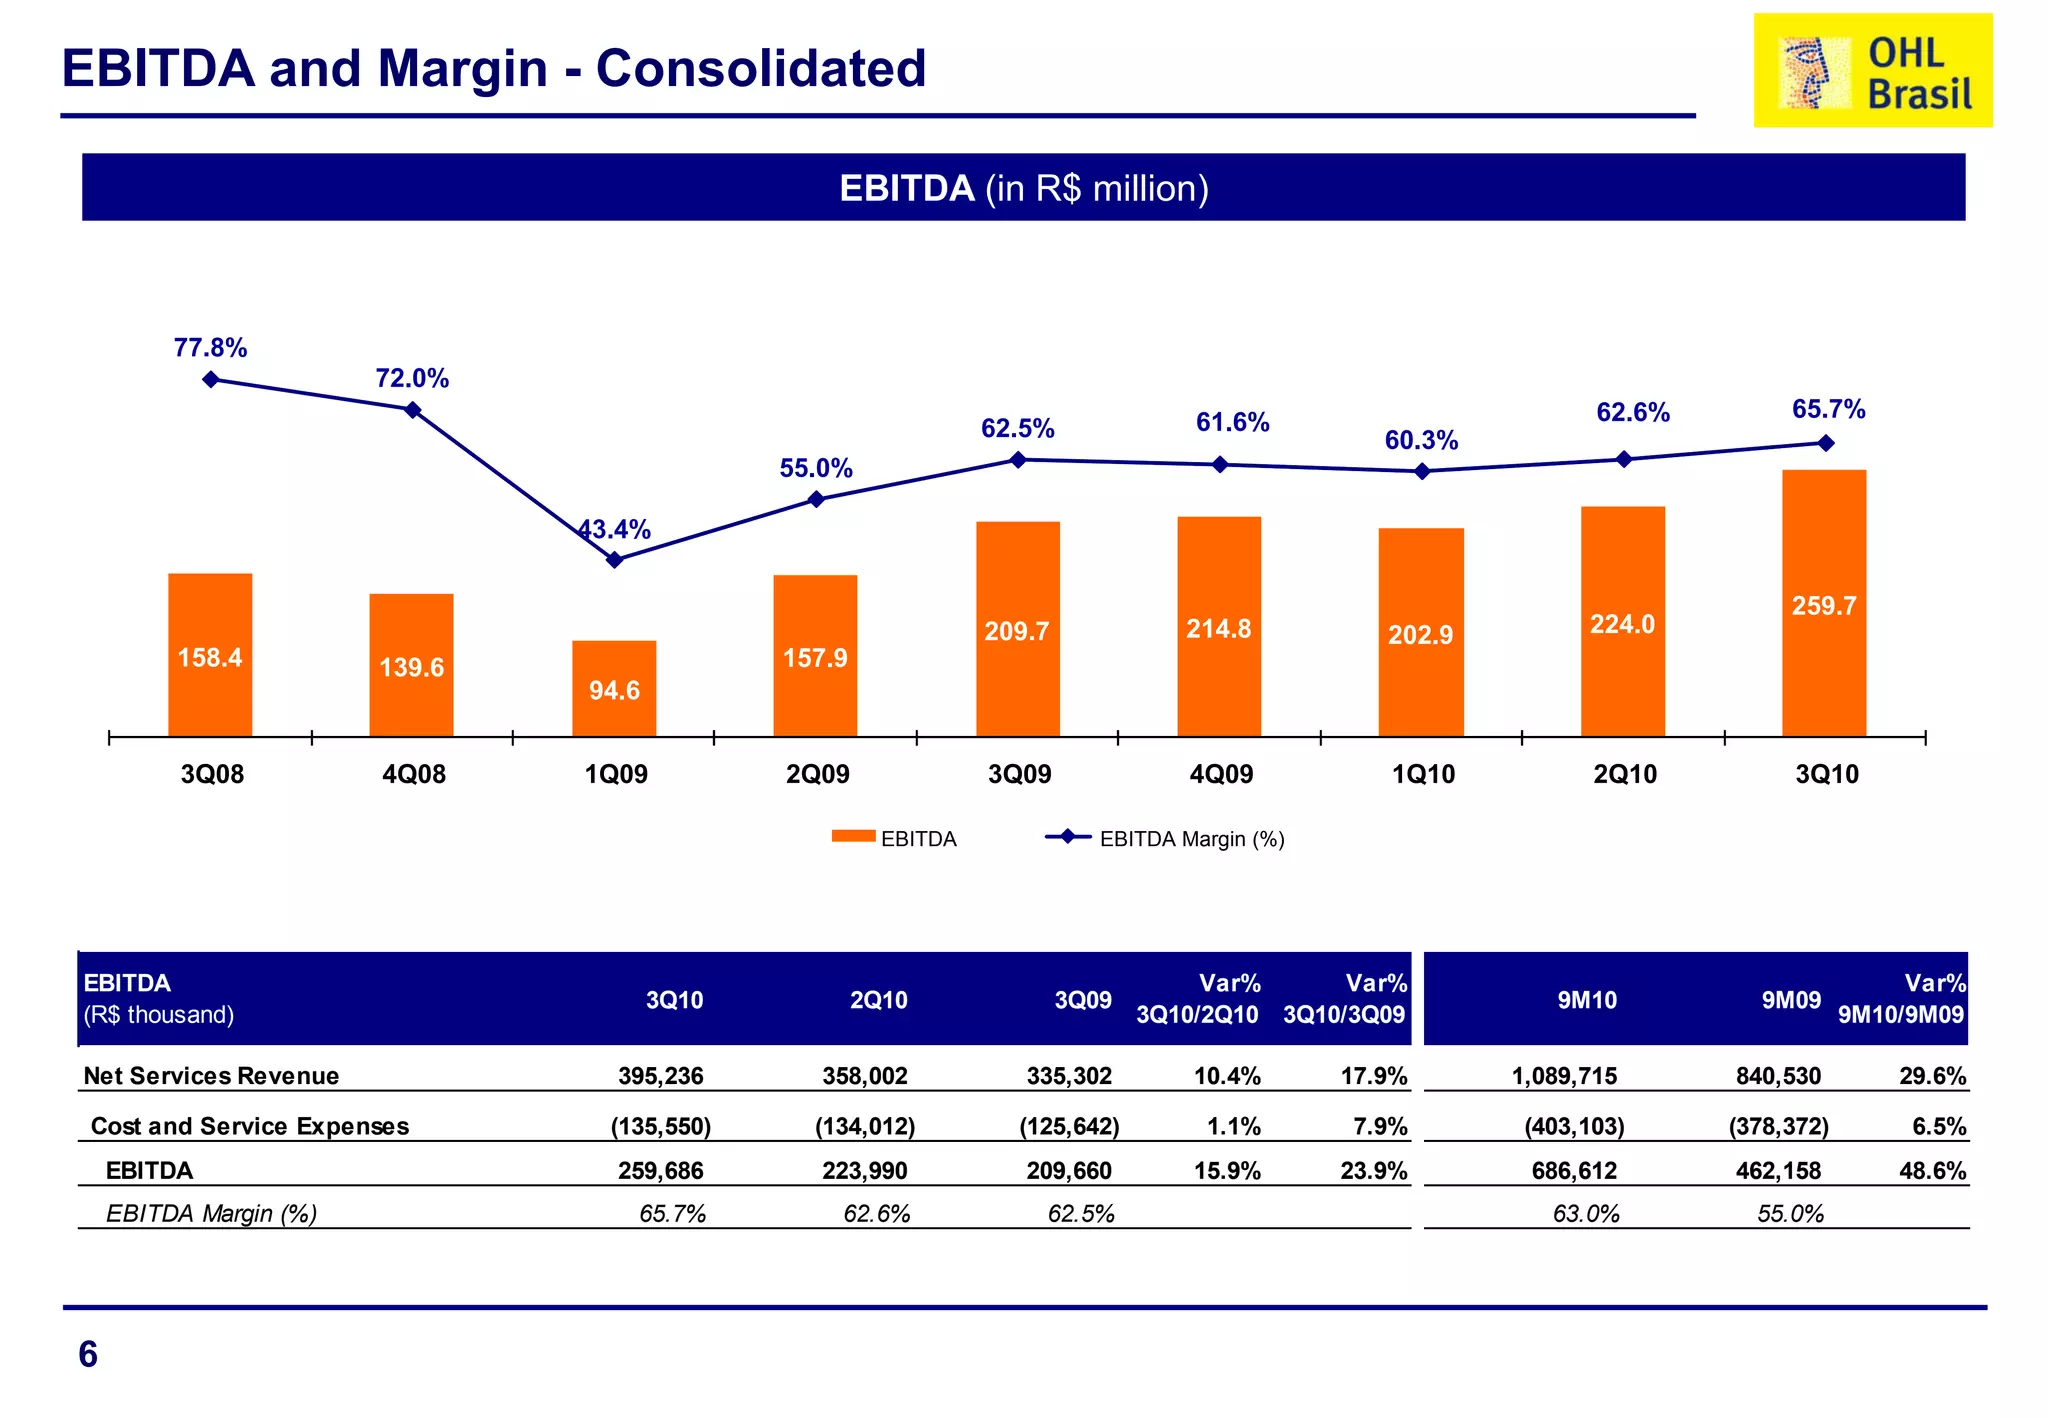
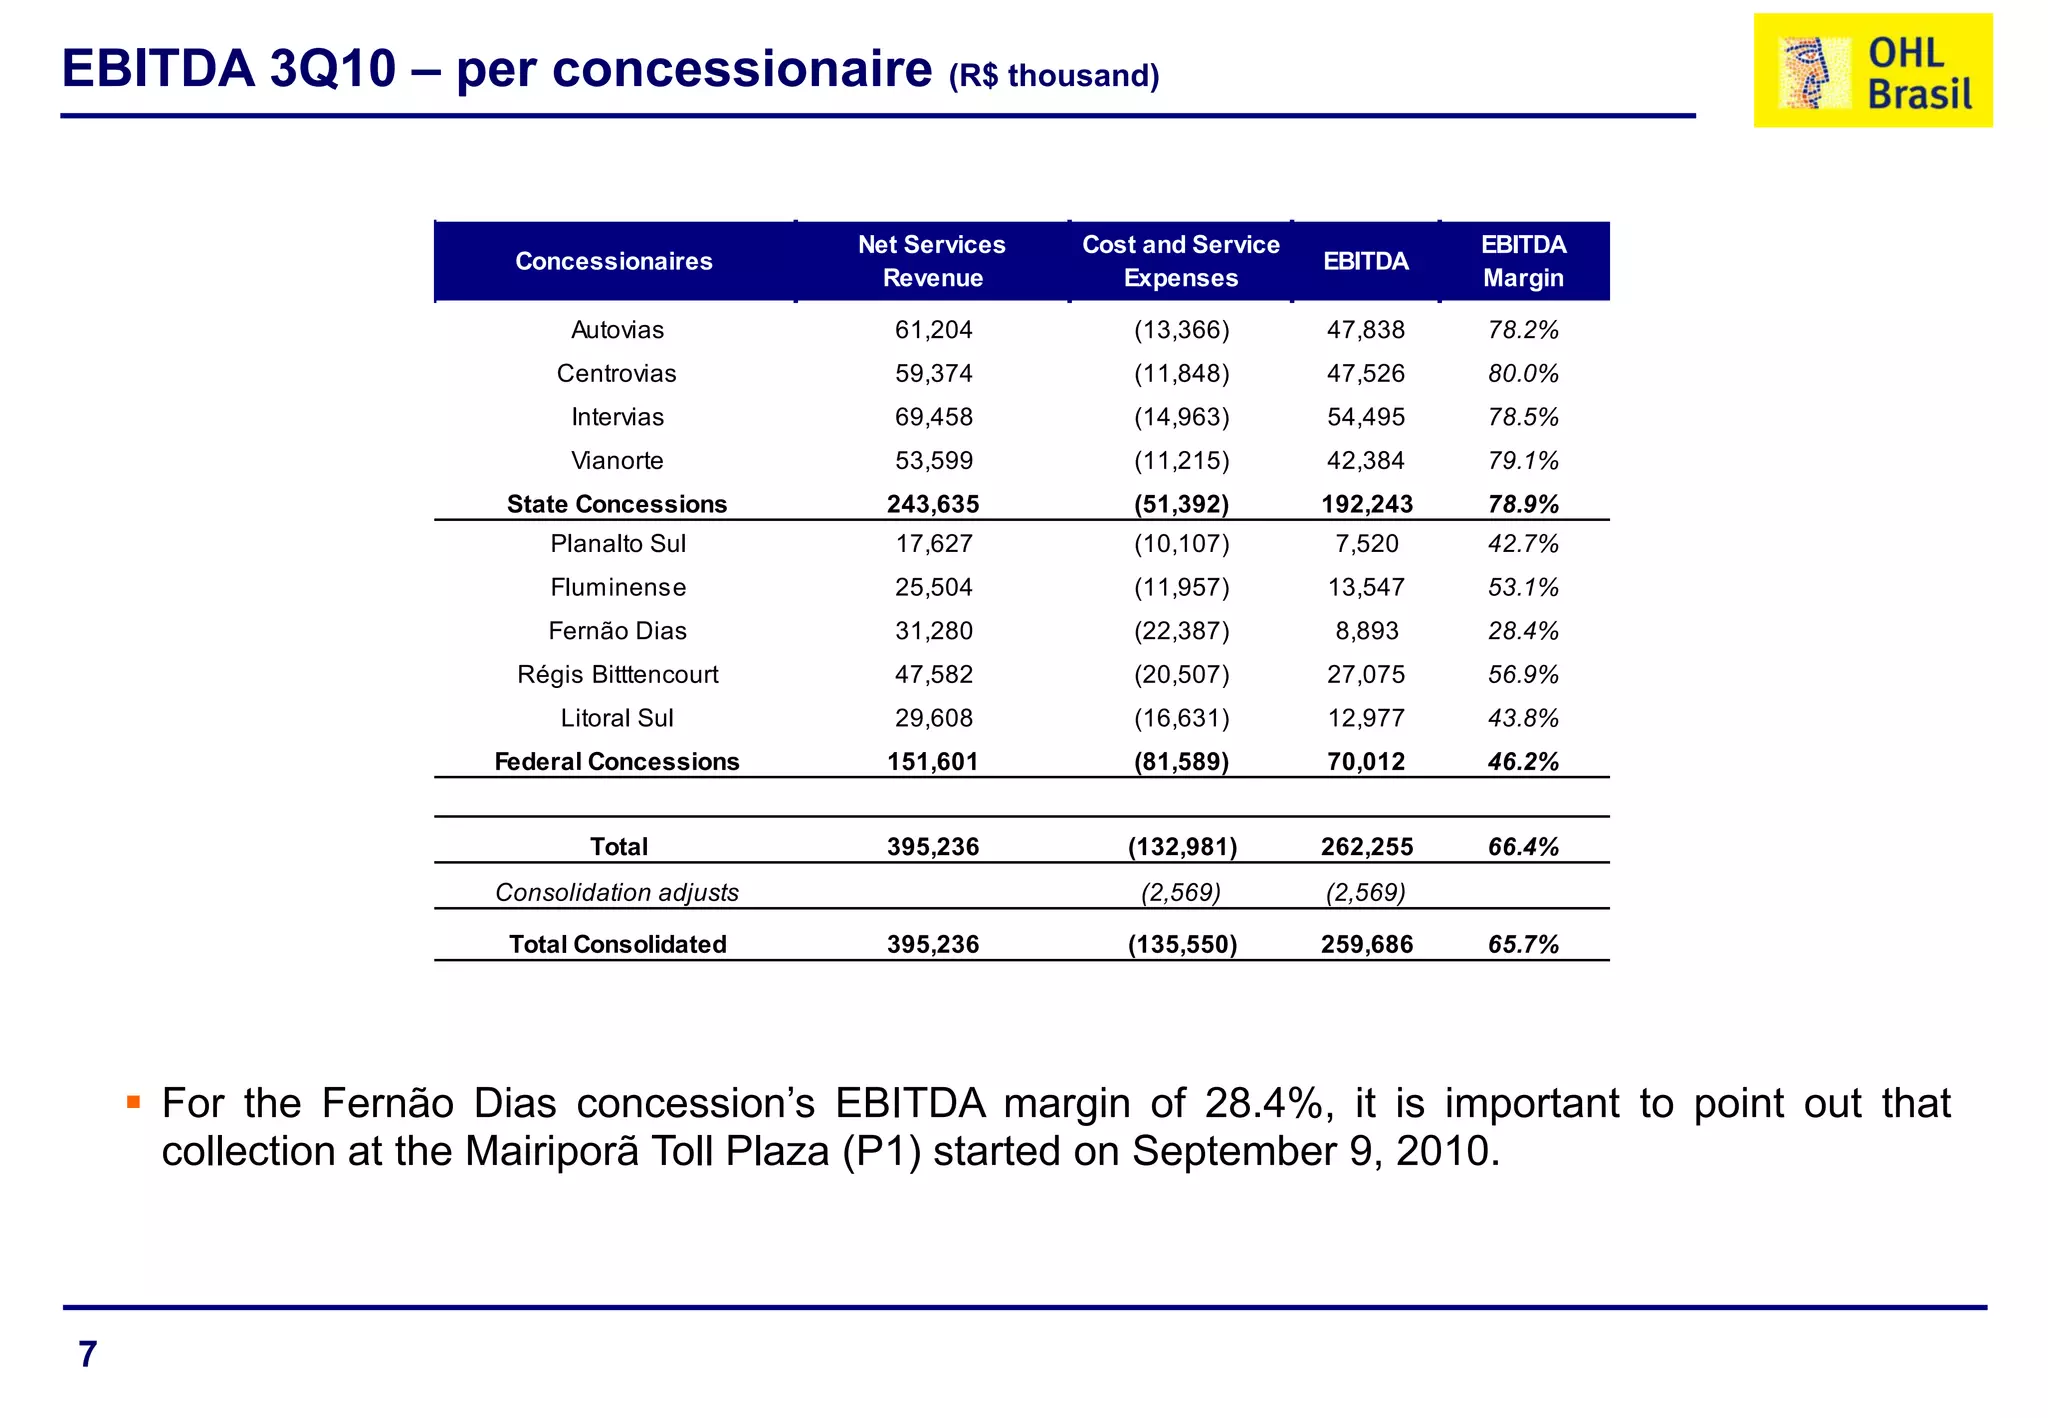
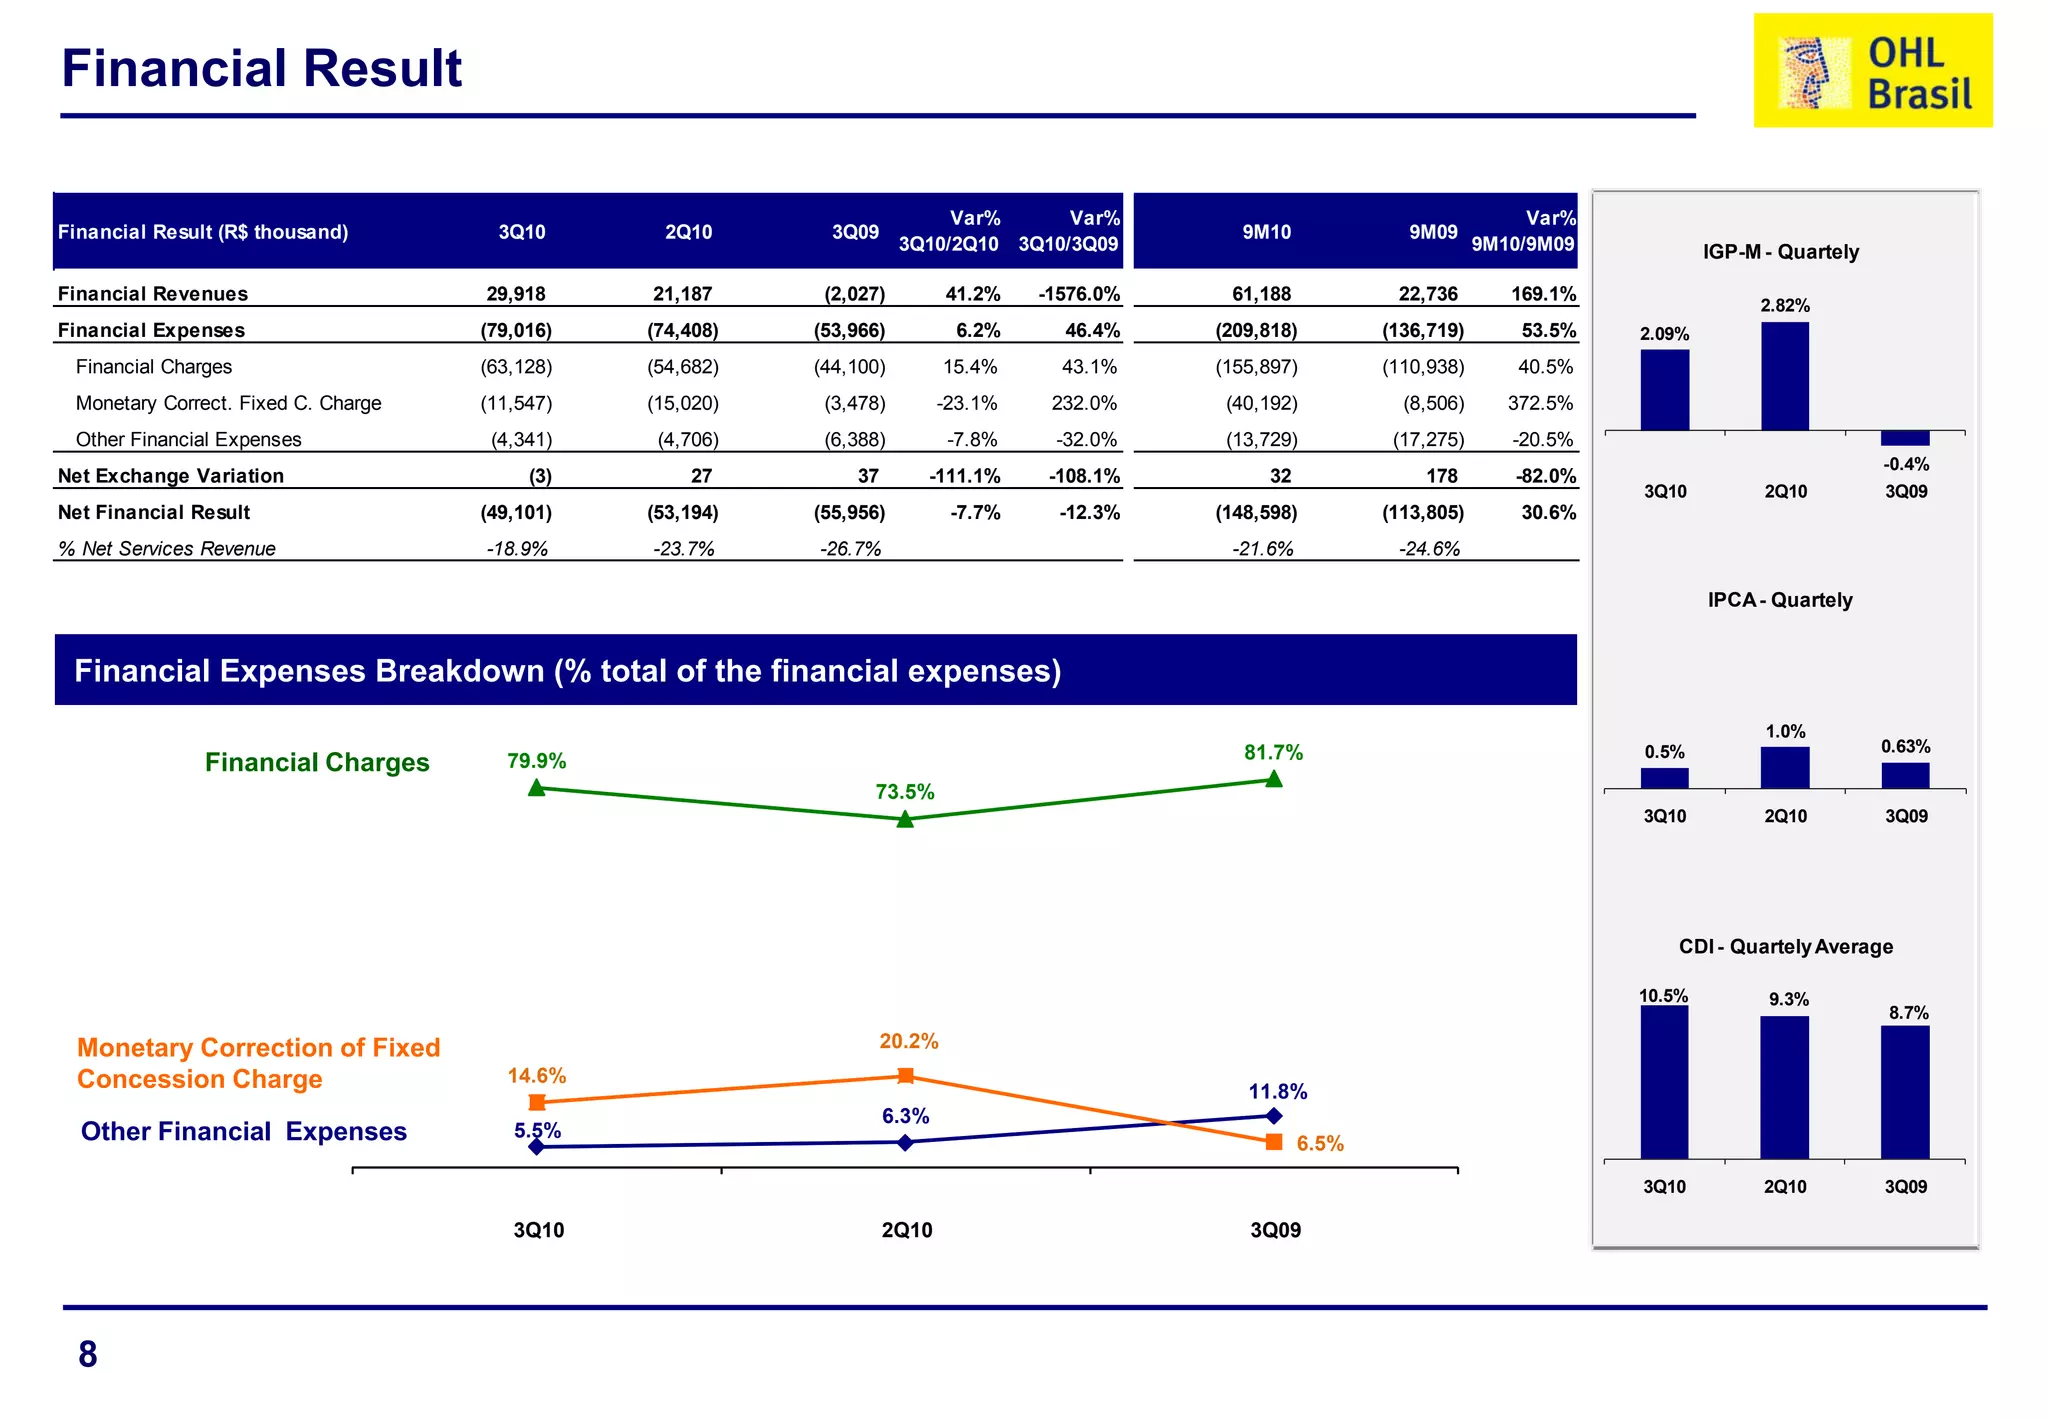
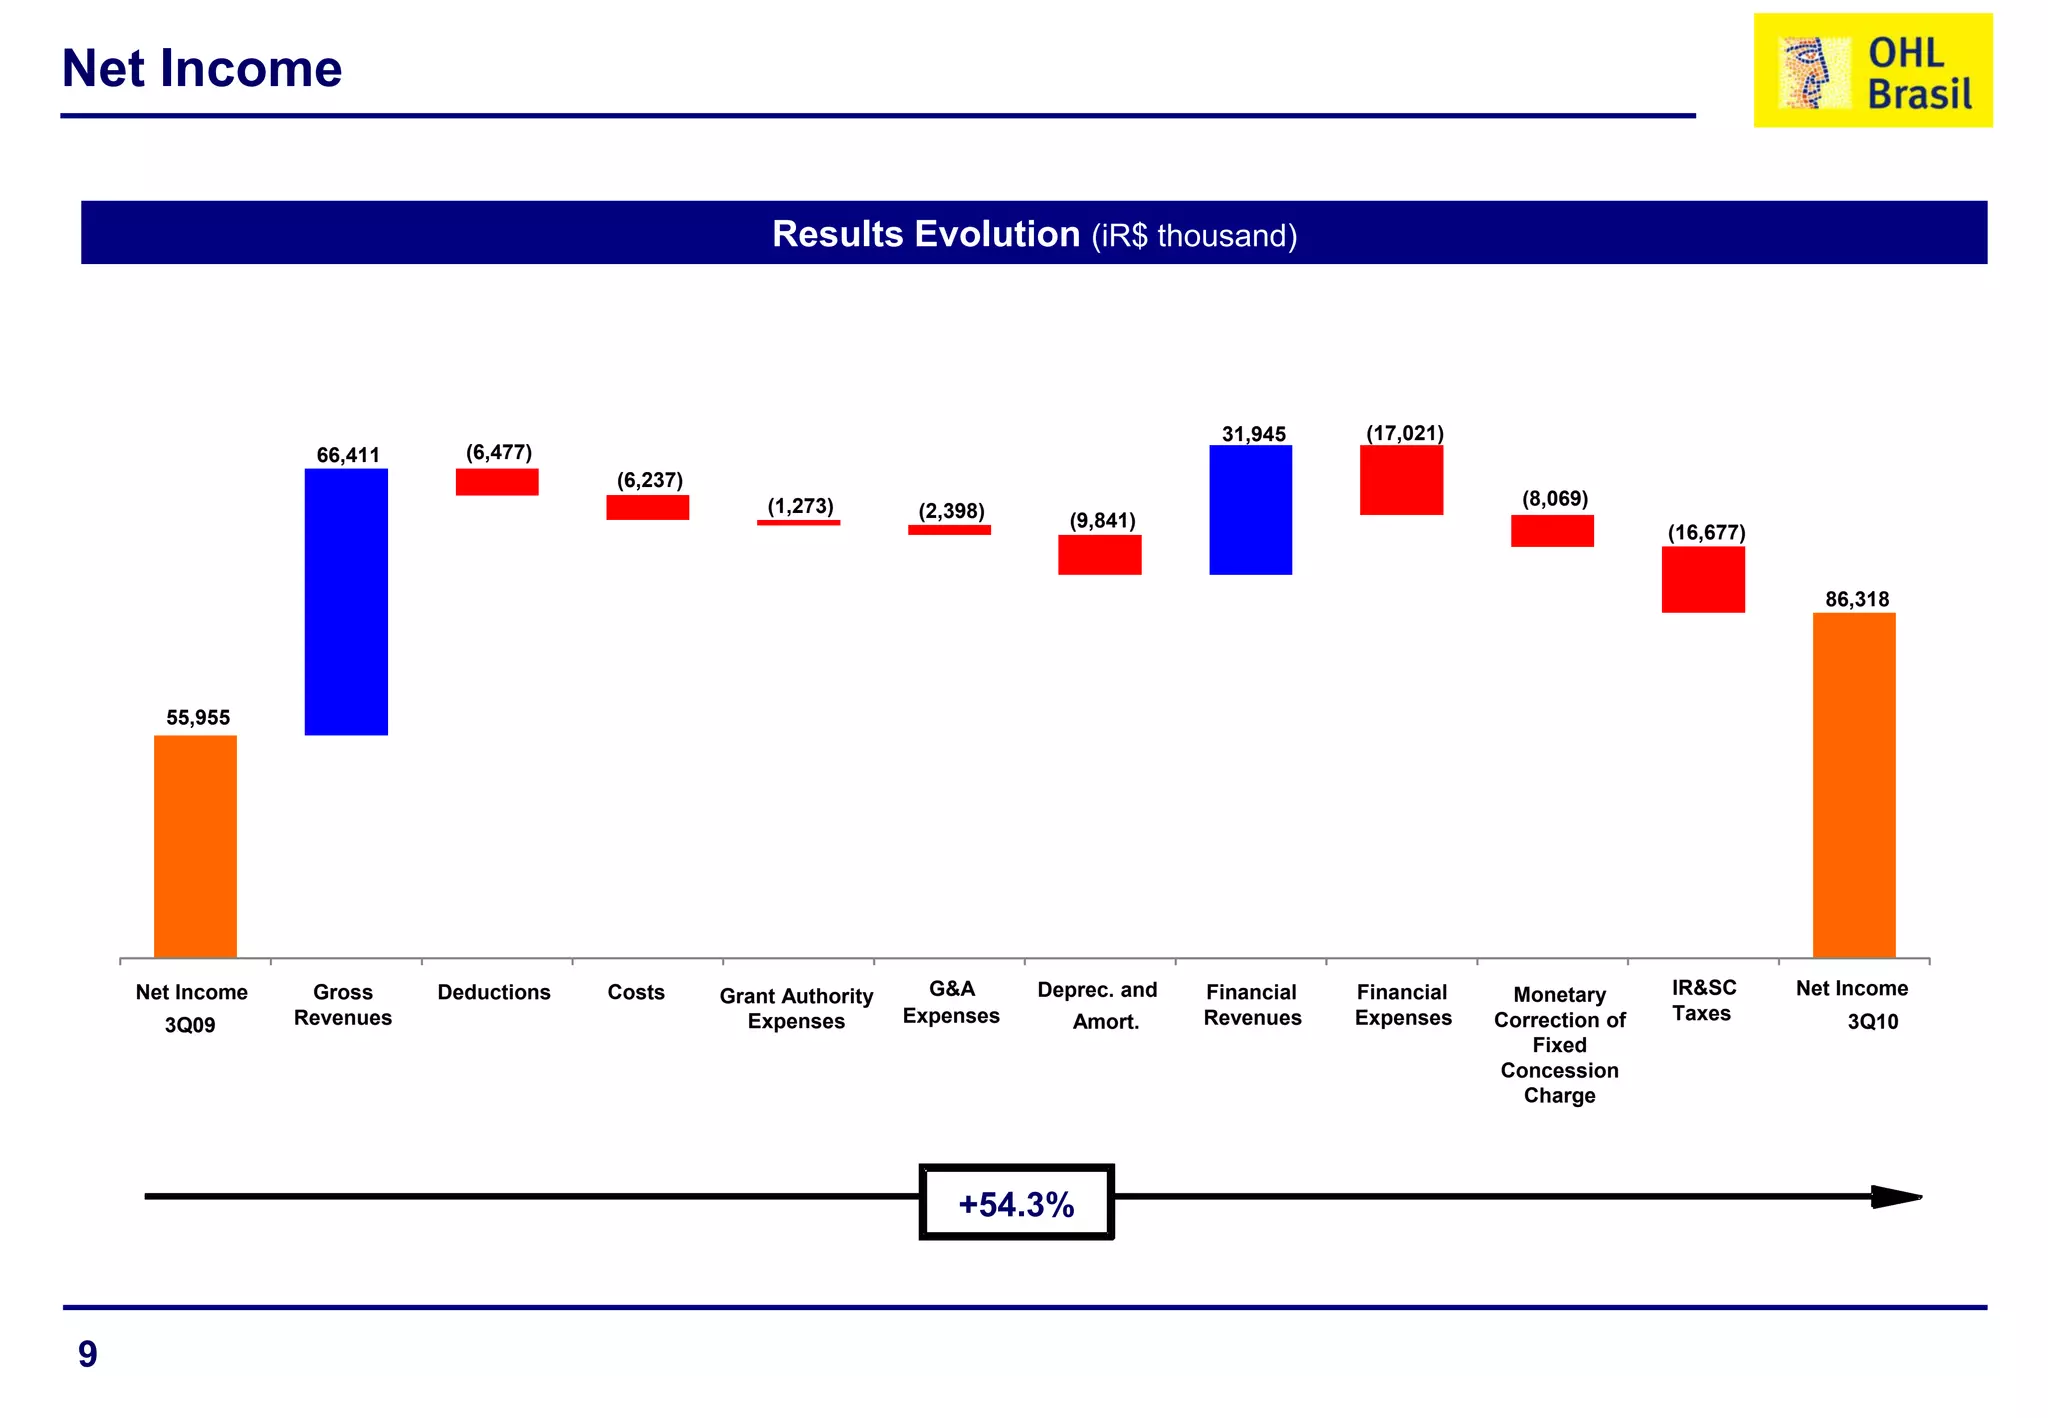
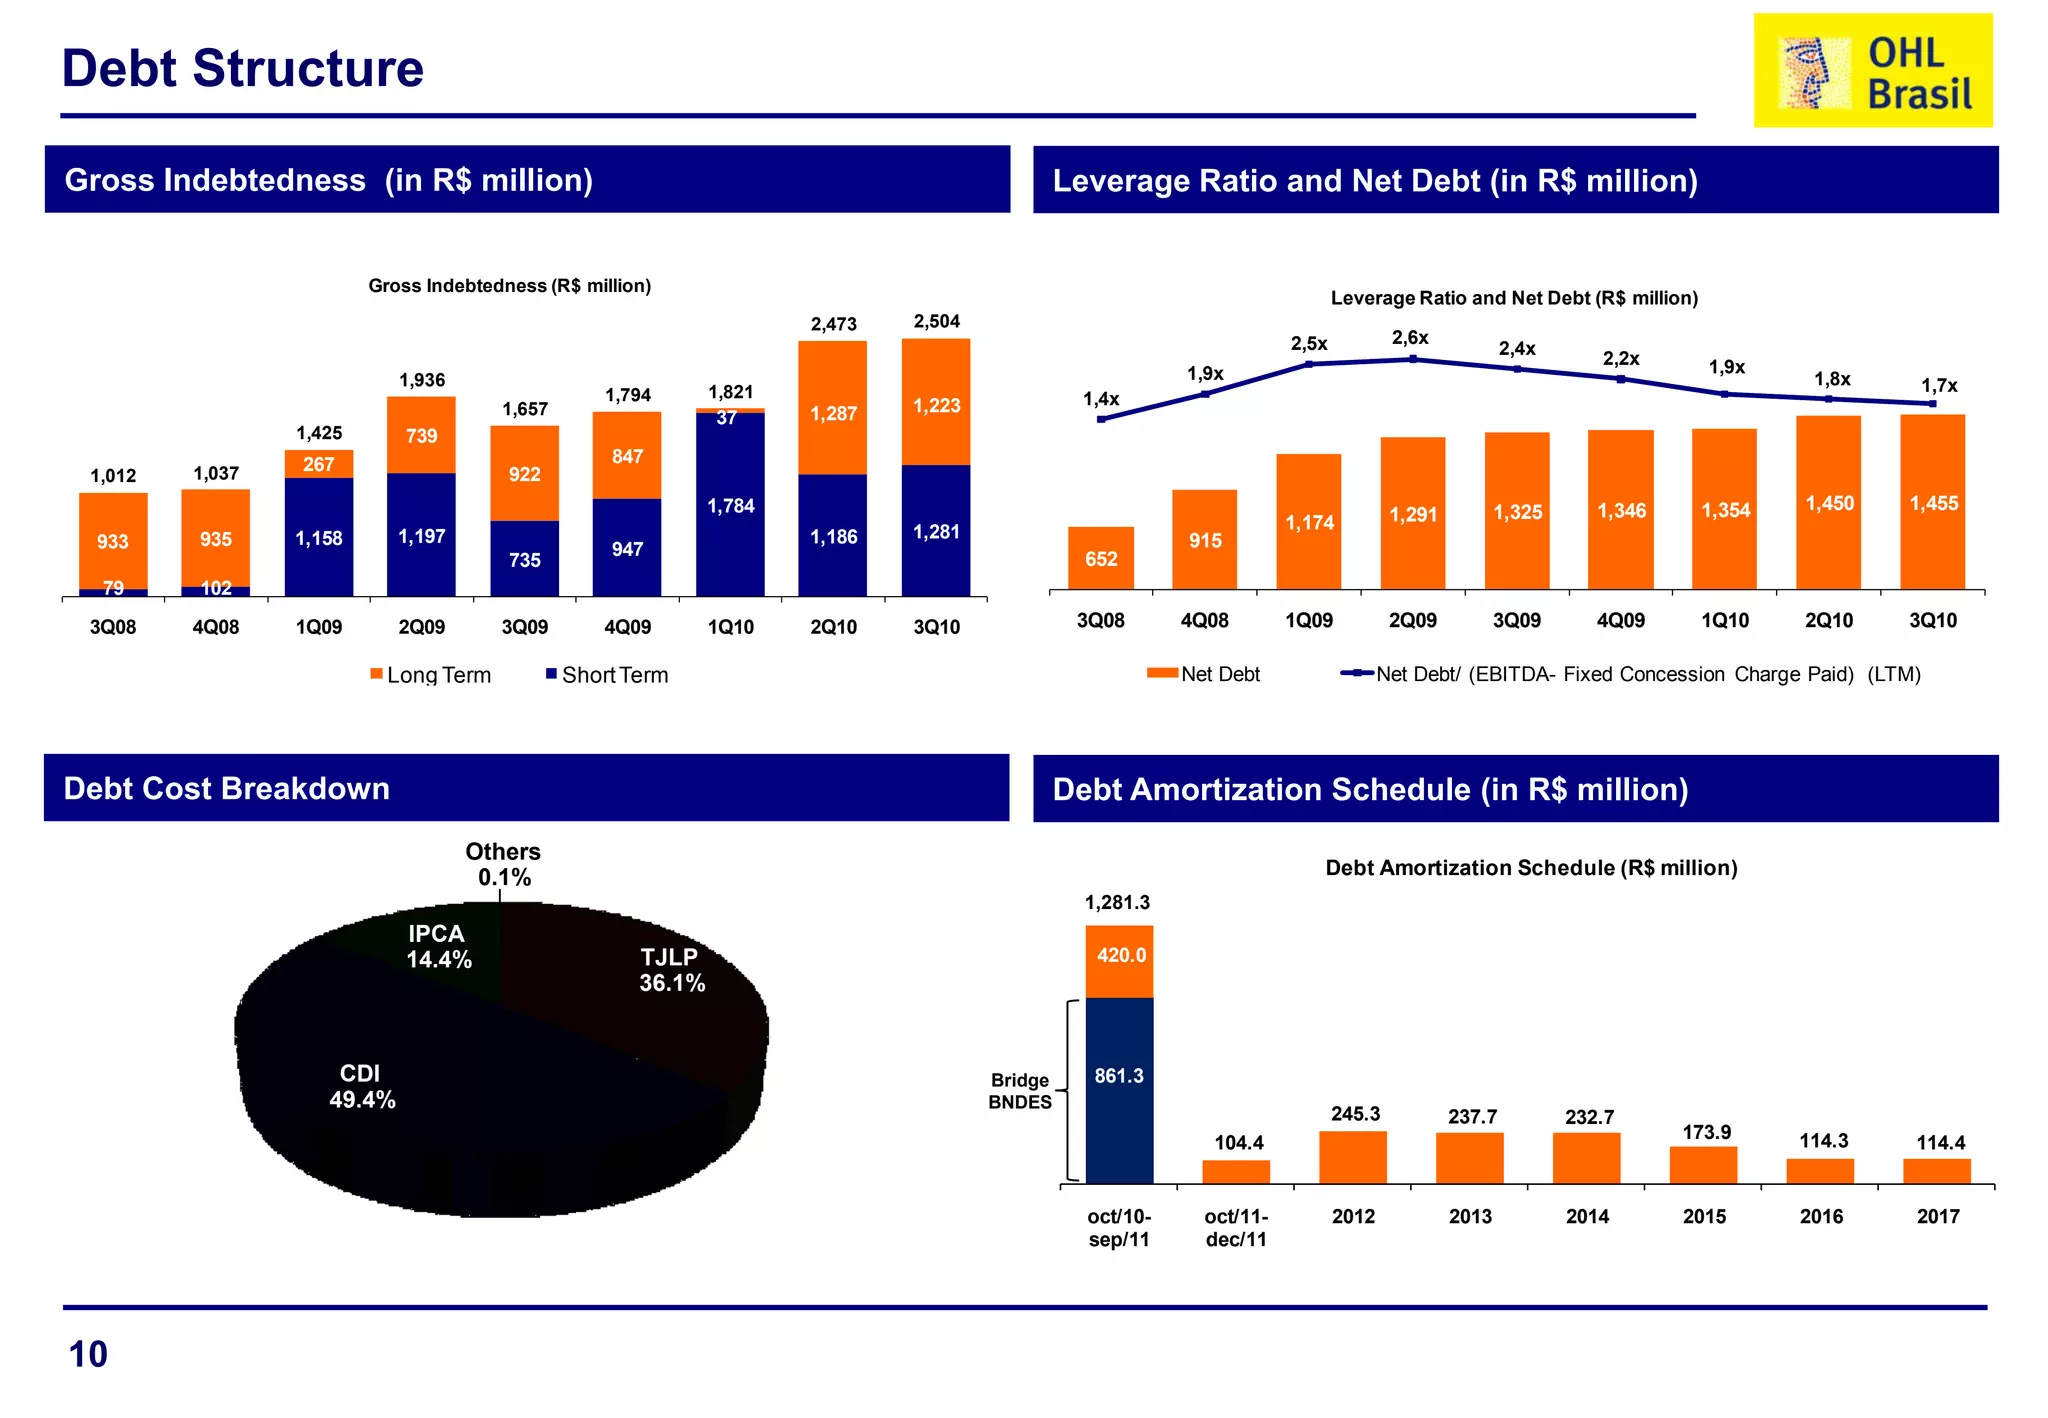
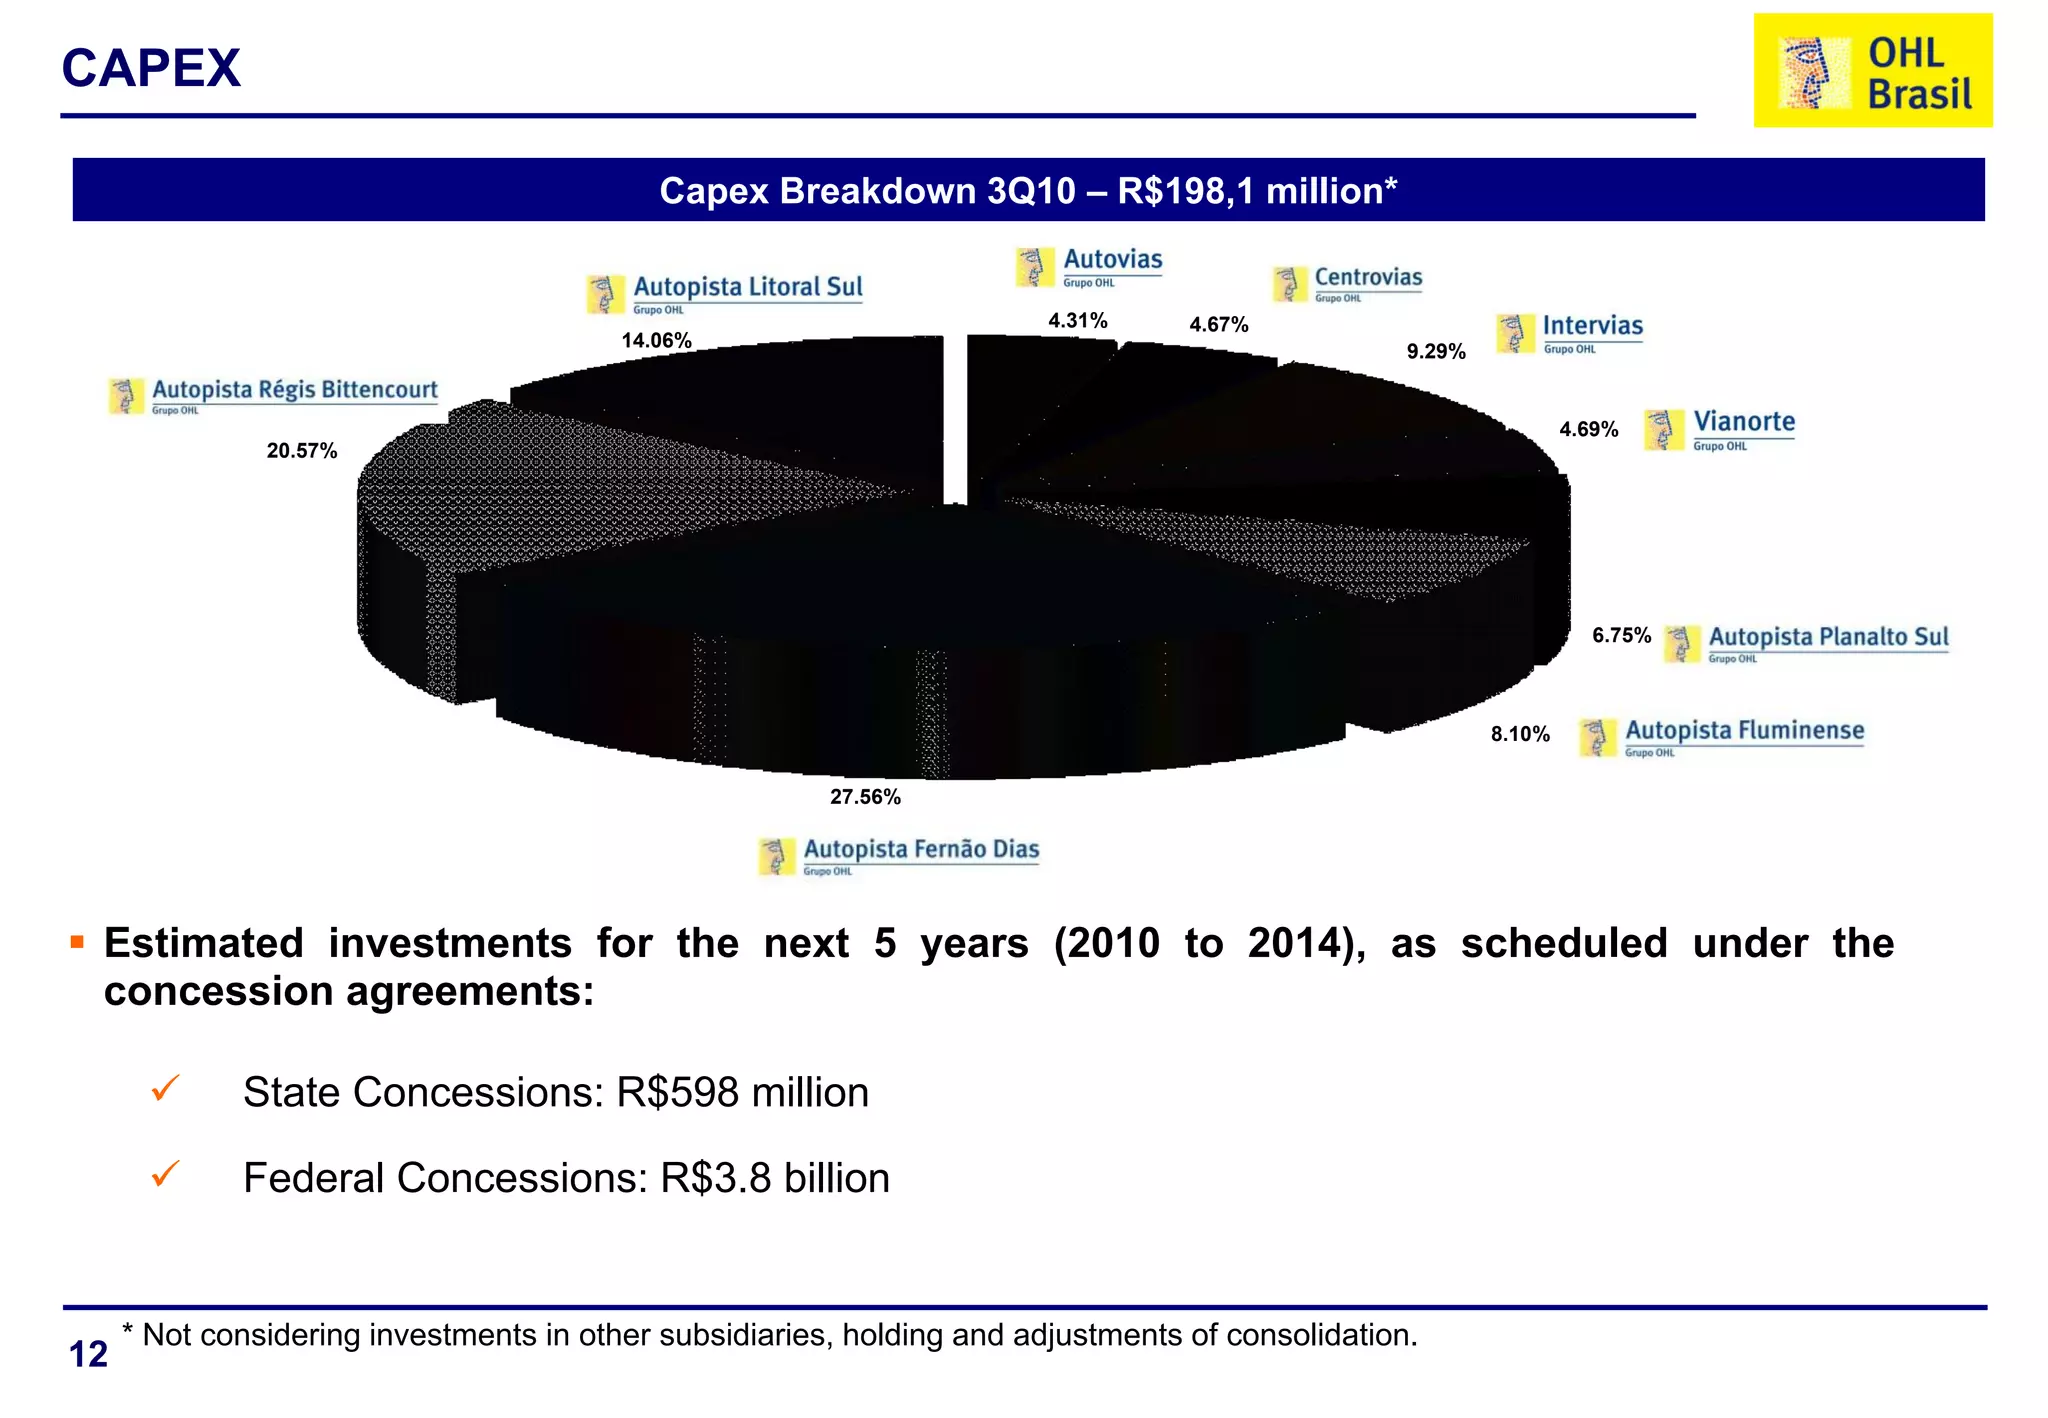

This document summarizes the 3Q10 earnings results of OHL Brasil. It shows increases in vehicle traffic across OHL Brasil's state and federal road concessions compared to previous periods. Revenue, EBITDA, and net income all increased for 3Q10 compared to 2Q10 and 3Q09. The document also provides details on debt levels, financial results, and toll tariff information.


