Download as PDF, PPTX

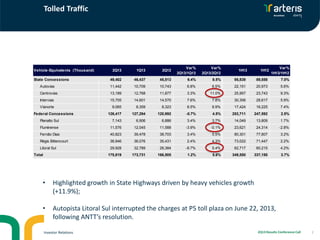
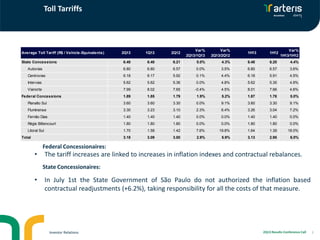
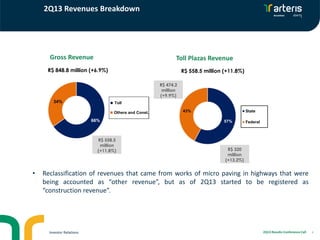
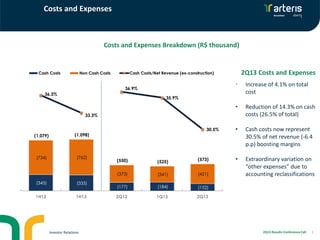
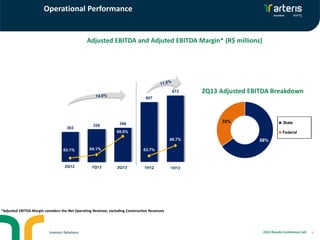
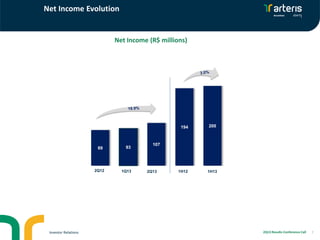
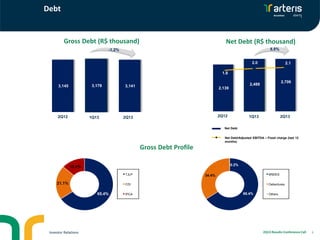
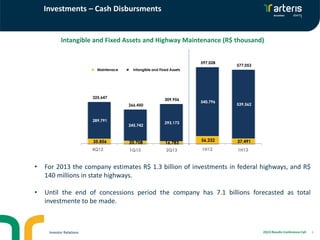


- The document summarizes the results of a 2Q13 earnings conference call for Arteris, a toll road operator in Brazil. It reported increased toll revenues and traffic volumes compared to 1Q13 and 2Q12. Adjusted EBITDA and net income were up for the quarter and half year period. Cash costs declined and margins increased. Total investments in road maintenance and infrastructure were lower in 2Q13 compared to prior periods. The company is on track to invest over R$1.3 billion in federal highways and R$140 million in state highways for 2013. Debt levels rose slightly but remained at comfortable ratios to cash flow.


