Download to read offline


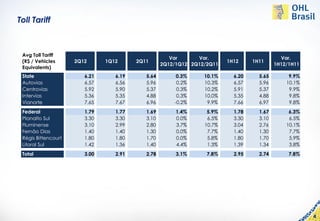


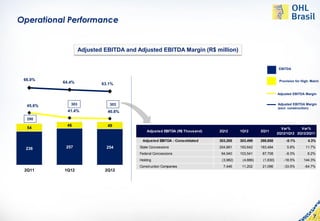

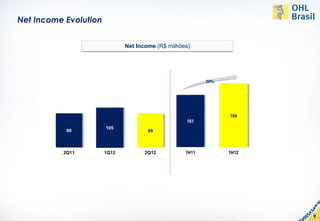
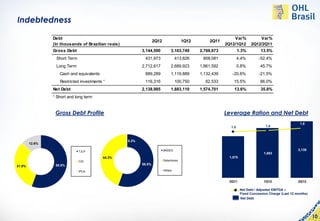
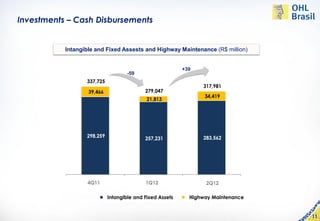


This document provides financial results and performance metrics for OHL Brasil for 2Q12 and comparisons to 1Q12 and 2Q11. Some key highlights: - Tolled traffic increased 2.1% in 2Q12 compared to 2Q11. Toll tariffs increased 7.8% on average. - Adjusted EBITDA was R$303 million in 2Q12, a 4.3% increase from 2Q11. Net income increased to R$161 million in 2Q12. - Gross revenue composition was 31% from tolls, 24% from construction, and 16% from others. - Total costs increased 21.6% in 1H12 compared


