Download as PDF, PPTX
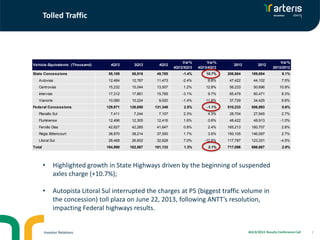
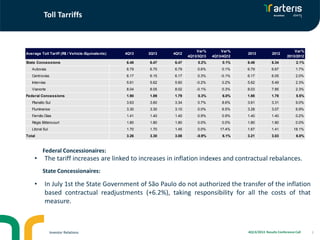
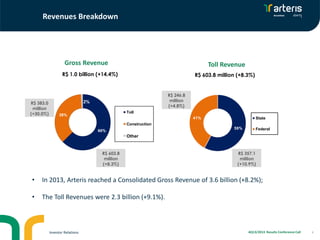
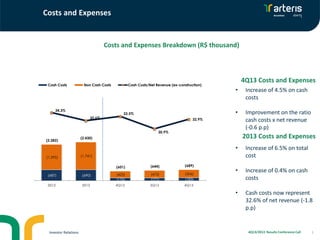
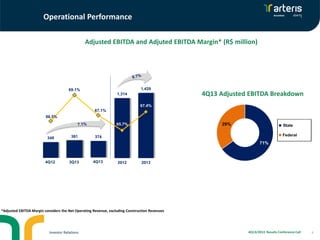
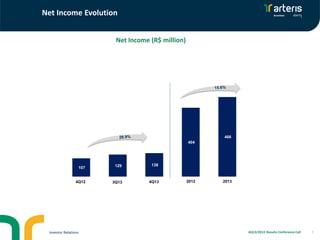
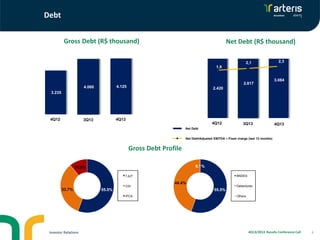
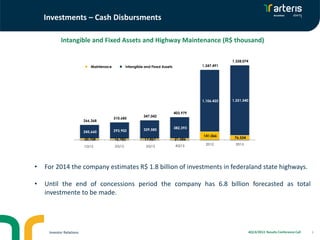

The document summarizes Arteris' results for the fourth quarter and full year of 2013. It shows that toll revenues grew 9.1% in 2013 driven by suspended axles charges and tariff increases. However, one concession had to stop charging tolls at a major plaza due to a regulatory decision, impacting results. Overall, gross revenue increased 8.2% while costs grew at a slower pace than revenues, improving margins. Adjusted EBITDA was up 8.3% and net income increased year-over-year. The company also provided details on its debt profile and forecasted investments of R$1.8 billion for 2014 as it continues expanding and maintaining its highway concessions.


