Download to read offline

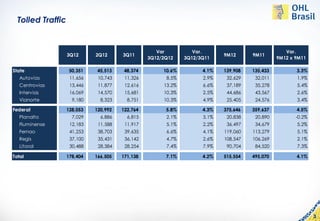
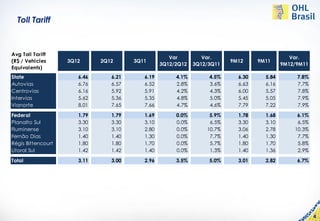
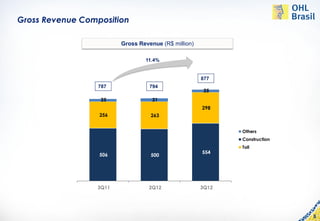
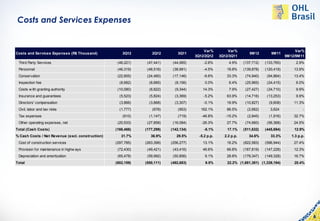
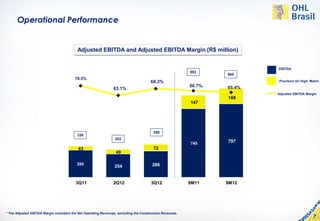
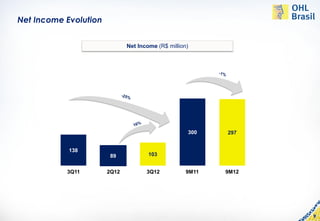
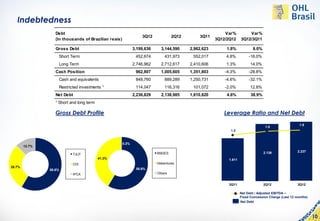
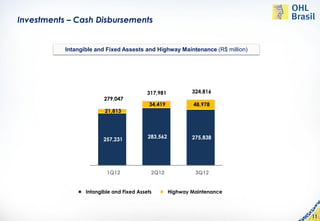


This document summarizes OHL Brasil's financial results for the third quarter of 2012. Some key points: - Tolled traffic increased 7.1% compared to the third quarter of 2011. Average toll tariffs increased 5% year-over-year. - Revenue was R$877 million, up 11.4% from the third quarter of 2011. Construction revenue was R$298 million. - Adjusted EBITDA was R$339 million, up 20.4% from the third quarter of 2011, with an EBITDA margin of 63.1%. - Net income was R$103 million, up significantly from R$89 million in the second quarter.


