Download to read offline
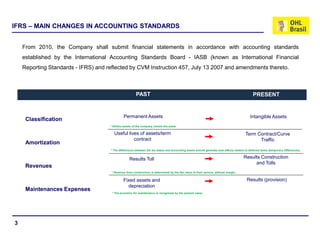
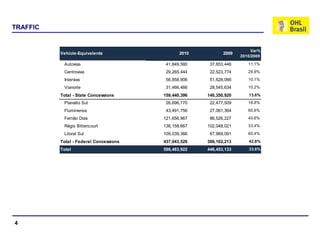
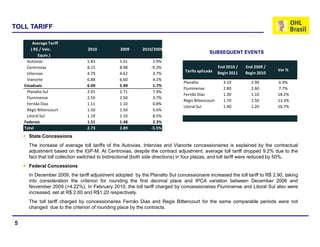
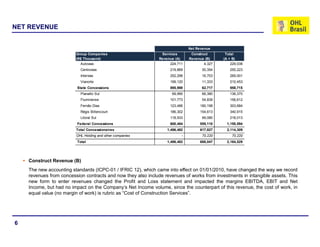
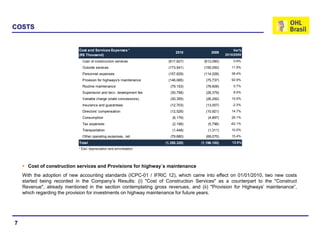
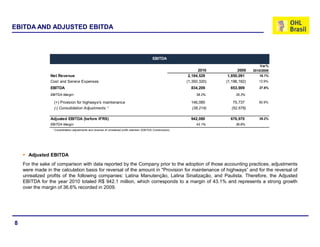
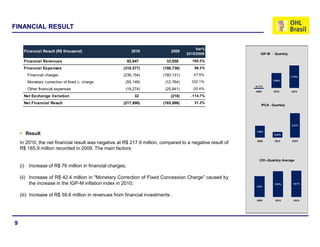
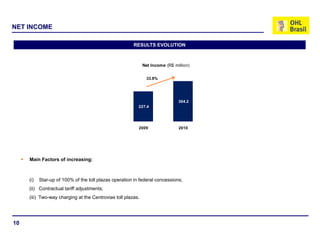
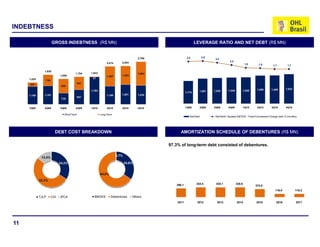

This document provides an overview of OHL Brasil's 2010 earnings results conference call. It includes information on traffic levels, toll tariffs, revenues, costs, EBITDA, financial results, and debt levels. Key points include a 13.6% increase in state concession traffic and a 42.8% increase in federal concession traffic compared to 2009. Net revenue grew 18.1% to over R$2 billion while adjusted EBITDA increased 39.2% to R$942 million. Net income grew 33.8% to R$304 million. Gross indebtedness increased but leverage ratios improved.


