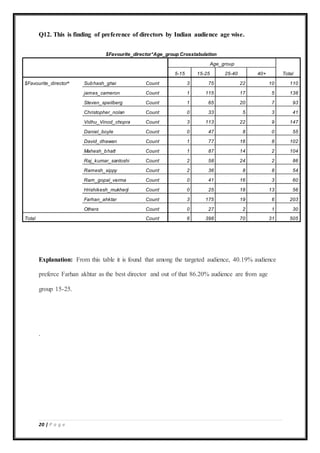
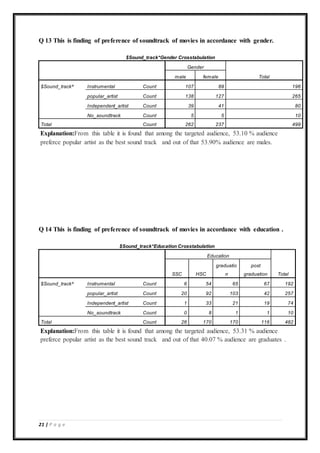
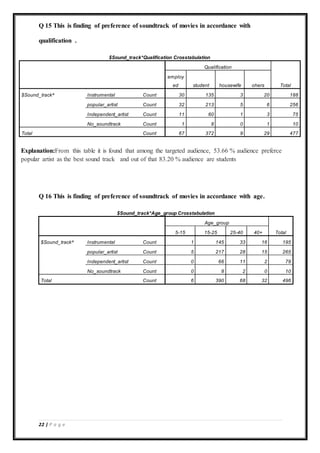
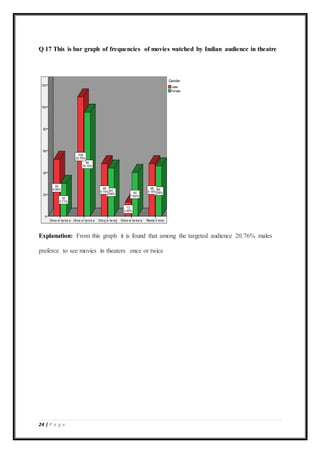
1 | P a g e
PROJECT REPORT ON SURVEY OF
“Preference of Indian audience towards movies”
UNDER THE GUIDANCE OF
Mr Ramkrishna Poojari
SUBMITTED BY
Dhiraj bafna
Fenil Gosar
Laxminarayan Vishwakarma
Dinesh Annappa Sanadi
IN PARTIAL FULFILMENT OF
THE CERTIFICATE COURSE IN
STATISTICAL ANALYSIS WITH HANDS ON TRAINING IN SPSS
(STATISTICAL PACKAGE FOR SOCIAL SCINECE )
TO
DEPARTMENT OF MATHEMATICS AND STATISITCS IN COLLABORATION
WITH DEPARTMENT OF BIOINFORMATICS ,GNIRD OF
GURU NANAK KHALSA COLLEGE
OF ARTS ,SCIENCE & COMMERCE
MATUNGA , MUMBAI -400019
2 | P a g e
ACKNOWLEDGEMENTS
We take this opportunity to extend our heartfelt and sincere gratitude to Mr Ramkrishna
Poojari for allowing us to do our survey project . It is indeed a matter of great pleasure and
proud privilege to be able to present this project on “Preference of Indian audience
towards movies”
3 | P a g e
TABLE OF CONTENTS
S.No. Chapters Page No.
1 Introduction 5
1.2 Objective(s) of the Study 6
1.3 The Scope of the Study 7
2. ResearchMethodology 8
2.1 Research design 8
2.2 Sampling design 9
2.3 Data collection tools/methods used 10
3. Findings 12
3.1 Data Intepretation 12-35
4. Conclusion 36
5. Limitation of study 37
6. References 38
6.1 Bibliography 38
6.2 Webliography 38
7. Appendices 39
4 | P a g e
5 | P a g e
1 Introduction
Film also called as movie or motion picture, is a series of still or
moving images. It is produced by recording photographic images with
cameras, or by creating images using animation techniques or visual
effects. The process of filmmaking has developed into an art form and
industry. In India film industry is one of the major revenue generation
industries
Movies shown in India try to show the replica of Indian society as
whole. It is one of oldest and largest industry in India after
independence .Indian film industry has annual growth rate of 9.3%
over the next five years reaching to 13650 crores in 2015 from 8750
crores in year 2010 (as per report from price water copper ltd
company). It generates lots of employment. Basically Indian movie
industry is nothing but an entertainment industry which tries to
entertain Indian audience in the art form which is liked and watched
by most of Indians .There are many aspects to Indian movie industry.
Movie industry also tries to show the current happening in the
country. Besides Indians being a multi linguistic, multicultural
country, the people of India are very much secular about movies.
Even in various types of diversity like that of states, languages,
religions, casts, cultures, they shows uniformity towards movies.
Movie industries is one of trend setters among youths. In this survey
we intend to find the preferences of Indian audience towards movies.
.
6 | P a g e
1.2 Objectives of the Study
Some of the objectives of the project were:-
 To identify the preference of Indian audience towards movies.
 To identify changing trends of Indian audience
 To understand the Scope of Indian film industry
7 | P a g e
Scope of the study
 The problem is that, volumes of audience very vast, spread across many dimension,
but do we are able to reach only few of that.
 Most important what is their recall/remembrance value.
 If we could have use online or internet media then we could have reach vast Indian
audience living out of India,
 how many audience could be reply such type of questionnaires or websites that
provide research survey or how many actually opt for it if we would be online.
 Large number of inidan audieance through out of the world would have been able to
reply such type of queationalr if we could be placed online .
8 | P a g e
Research Methodology
Research is a systematic method of finding solutions to problems. It is essentially an
investigation, a recording and an analysis of evidence for the purpose of gaining knowledge.
According to Clifford woody, “research comprises of defining and redefining problem,
formulating hypothesis or suggested solutions, collecting, organizing and evaluating data,
reaching conclusions, testing conclusions to determine whether they fit the formulated
hypothesis”
2.1 Research Design
RESEARCH DESIGN
A Research design is a preliminary or tentative explanation or postulate by the researcher of
what the researcher considers the outcome of an investigation will be. The formidable
problem that follows the tasks of defining the research problem is the preparation of the
design of the research project, popularly known as the “research design”. Decisions regarding
what, when, how much, by what means concerning an enquiry or a research study constitute a
research design. “A research design is the arrangement of conditions for collection and
analysis of data in the matter that aims to combine, relevance to the research purpose with
economy in procedure.”
The Research Design adopted in the study was descriptive in nature.
The Study is based on this research design.
 Prefence or choice of Indian audience
9 | P a g e
2.2 Sampling Design.
A sample design is a finite plan for obtaining a sample from a given population. Random
sampling technique is used for this study.
Universe.
The universe chooses for the research study is the population of Mumbai
Sample Size.
Number of the sampling units selected from the population is called the size of the sample.
Sample of 530 respondents were obtained from the population.
Sampling Procedure.
The procedure adopted in the present study is probability sampling, which is also known as
chance sampling. Under this sampling design, every item of the frame has an equal chance of
inclusion in the sample.
10 | P a g e
2.3 Methods of Data Collection.
The data’s were collected through Primary sources.
Primary Sources.
Primary data are in the form of “raw material” to which statistical methods are applied for the
purpose of analysis and interpretations.
The primary sources are data collected through questionnaire.
Nature of Research.
Descriptive research, also known as statistical research, describes data and characteristics
about the population or phenomenon being studied. Descriptive research answers the
questions who, what, where, when and how.
Although the data description is factual, accurate and systematic, the research cannot describe
what caused a situation. Thus, descriptive research cannot be used to create a causal
relationship, where one variable affects another. In other words, descriptive research can be
said to have a low requirement for internal validity.
Questionnaire.
A well defined questionnaire that is used effectively can gather information on both overall
performance of the test system as well as information on specific components of the system.
11 | P a g e
A defeated questionnaire was carefully prepared. The questions were arranged in proper
order, in accordance with the relevance.
Nature of Questions Asked.
The questionnaire consists of open ended,
Sample
A finite subset of population, selected from it with the objective of investigating its properties
called a sample. A sample is a representative part of the population. A sample of 530
respondents in total has been randomly selected. The response to various elements under each
questions were totaled for the purpose of various statistical testing.
Variables of the Study.
The direct variable of the study is the age, gender, occupation and qualification of the
respondents with awareness as an indirect variable
Presentation of Data.
The data are presented through charts, graphs and tables.
.
12 | P a g e
3.1 DATA INTERPRETATION:
The following charts gives us findings as per the data collected through the survey
Q1.This the findings of genre’s of movies with respect to genders
$Genre*Gender Crosstabulation
Gender
TotalMale female
$Genrea
Action Count 153 82 235
Comedy Count 175 190 365
Sci_fic Count 57 43 100
Documentary Count 36 22 58
Drama Count 22 41 63
Classic Count 28 27 55
Horror Count 84 84 168
Independent Count 20 26 46
Total Count 267 253 520
Explanation:
From this table it is found that among the targeted audience, 70% audience preferred
comedy movies and in that 52% are female audience
13 | P a g e
Q2.This the findings of genre’s of movies with respect to education
$Genre*Education Crosstabulation
Education
TotalSSC HSC graduation post graduation
$Genrea
Action Count 14 81 72 61 228
Comedy Count 17 126 126 88 357
Sci_fic Count 5 30 35 27 97
Documentary Count 4 16 13 25 58
Drama Count 7 13 26 17 63
Classic Count 2 16 13 22 53
Horror Count 9 69 55 30 163
Independent Count 3 17 13 10 43
Total Count 26 181 176 120 503
Explanation: From this table it is found that among the targeted audience, 70.97%
audience preferred comedy movies and in that 35% are Graduates and 35% are HSC pass
audience
.Q3. This the findings of genre’s of movies with respect to age.
$Genre*Age_group Crosstabulation
Age_group
Total5-15 15-25 25-40 40+
$Genrea
Action Count 5 183 29 16 233
Comedy Count 3 286 51 25 365
Sci_fic Count 2 76 11 9 98
Documentary Count 0 37 13 8 58
Drama Count 0 45 10 7 62
Classic Count 0 31 12 12 55
Horror Count 3 149 14 3 169
Independent Count 0 35 7 4 46
Total Count 6 406 70 34 516
Explanation: From this table it is found that among the targeted audience, 70.73 %
audience preferred comedy movies and in that 78.35 % are from age group 15-25
14 | P a g e
Q4. This the findings of genre’s of movies with respect to qualification .
$Genre*Qualification Crosstabulation
Qualification
Totalemployed student housewife ohers
$Genrea
Action Count 27 180 5 14 226
Comedy Count 53 273 6 19 351
Sci_fic Count 8 81 2 8 99
Documentary Count 13 36 1 7 57
Drama Count 12 42 4 3 61
Classic Count 14 28 1 11 54
Horror Count 12 145 0 6 163
Independent Count 6 34 1 3 44
Total Count 70 390 9 29 498
Explanation: From this table it is found that among the targeted audience, 70.48% audience
preferred comedy movies and in that 77.77 % are from students category
Q5.This is finding of aspects of good movies in accordance with gender
$Aspect_for_good_movies*Gender Crosstabulation
Gender
Totalmale female
$Aspect_for_good_moviesa
Cast Count 51 48 99
writing Count 107 84 191
direction Count 141 105 246
special_effects Count 56 45 101
Music Count 106 140 246
Remakes Count 58 35 93
Total Count 267 251 518
Explanation: From this table it is found that among the targeted audience, 47.49% audience
preferce direction and music each.
15 | P a g e
Q6. .This is finding of aspects of good movies in accordance with education.
$Aspect_for_good_movies*Education Crosstabulation
Education
TotalSSC HSC graduation post graduation
$Aspect_for_good_mo
viesa
Cast Count 6 32 28 31 97
writing Count 8 61 61 59 189
direction Count 9 77 87 66 239
special_effects Count 8 41 34 14 97
Music Count 13 90 82 52 237
Remakes Count 12 27 37 14 90
Total Count 26 182 176 118 502
Explanation: From this table it is found that among the targeted audience, 47.60 % audience
preferce direction and 36.40% audience are graduates
Q7. This is finding of aspects of good movies in accordance with qualification.
$Aspect_for_good_movies*Qualification Crosstabulation
Qualification
Total
employe
d student
housewif
e ohers
$Aspect_for_good_moviesa
Cast Count 10 78 1 4 93
writing Count 31 136 4 15 186
direction Count 38 176 4 18 236
special_effects Count 12 76 2 4 94
Music Count 34 188 6 9 237
Remakes Count 12 70 2 3 87
Total Count 70 388 9 29 496
Explanation: From this table it is found that among the targeted audience, 47.78 % audience
preferce music and 79.32% audience are students
16 | P a g e
Q8. This is finding of aspects of good movies in accordance with age .
$Aspect_for_good_movies*Age_group Crosstabulation
Age_group
Total5-15 15-25 25-40 40+
$Aspect_for_good_moviesa
Cast Co
unt
2 86 7 6 101
writing Co
unt
2 140 30 18 190
direction Co
unt
1 182 37 23 243
special_effects Co
unt
3 80 12 5 100
Music Co
unt
0 198 33 16 247
Remakes Co
unt
3 73 11 5 92
Total Co
unt
6 405 70 33 514
Explanation: From this table it is found that among the targeted audience, 48.05 % audience
preferce music and 80.16 % audience are from age group 15-25
17 | P a g e
Q9. This is finding of preference of directors by Indian audience gender wise.
$Favourite_director*Gender Crosstabulation
Gender
Totalmale female
$Favourite
_directora
Subhash_ghai Count 59 50 109
james_cameron Count 83 56 139
Steven_speilberg Count 62 32 94
Christopher_nolan Count 27 15 42
Vidhu_Vinod_chopra Count 69 78 147
Daniel_boyle Count 31 26 57
David_dhawan Count 57 44 101
Mahesh_bhatt Count 49 56 105
Raj_kumar_santoshi Count 46 42 88
Ramesh_sippy Count 35 20 55
Ram_gopal_verma Count 32 28 60
Hrishikesh_mukherji Count 28 28 56
Farhan_ahktar Count 98 107 205
Others Count 18 12 30
Total Count 262 247 509
Explanation: From this table it is found that among the targeted audience, 40.27 % audience
preferce Farhan akhtar as the best director and out of that 52.19% audience are females.
18 | P a g e
Q10. This is finding of preference of directors by Indian audience education wise .
$Favourite_director*Education Crosstabulation
Education
TotalSSC HSC graduation
post
graduation
$Favourite_directora
Subhash_ghai Count 9 39 33 26 107
james_cameron Count 10 40 52 33 135
Steven_speilberg Count 1 35 26 31 93
Christopher_nolan Count 1 13 10 17 41
Vidhu_Vinod_chopra Count 9 43 52 39 143
Daniel_boyle Count 1 23 20 11 55
David_dhawan Count 11 39 33 16 99
Mahesh_bhatt Count 7 43 38 14 102
Raj_kumar_santoshi Count 4 24 32 24 84
Ramesh_sippy Count 3 16 24 10 53
Ram_gopal_verma Count 4 19 25 8 56
Hrishikesh_mukherji Count 5 10 17 21 53
Farhan_ahktar Count 13 61 74 52 200
Others Count 0 11 14 5 30
Total Count 26 174 174 118 492
Explanation: From this table it is found that among the targeted audience40.65 % audience
preferce Farhan akhtar as the best director and out of that 37 % audience are graduates
19 | P a g e
Q11. This is finding of preference of directors by Indian audience qualification wise.
$Favourite_director*Qualification Crosstabulation
Qualification
Total
employe
d student
housewi
fe ohers
$Favourite_directora
Subhash_ghai Count 21 72 2 9 104
james_cameron Count 13 114 2 5 134
Steven_speilberg Count 14 66 0 12 92
Christopher_nolan Count 5 34 0 3 42
Vidhu_Vinod_chopra Count 23 109 4 7 143
Daniel_boyle Count 8 45 0 0 53
David_dhawan Count 16 73 5 3 97
Mahesh_bhatt Count 15 81 0 3 99
Raj_kumar_santoshi Count 16 60 3 4 83
Ramesh_sippy Count 8 35 2 6 51
Ram_gopal_verma Count 14 40 1 3 58
Hrishikesh_mukherji Count 20 19 4 11 54
Farhan_ahktar Count 15 170 6 5 196
Others Count 0 29 0 1 30
Total Count 70 380 9 28 487
Explanation: From this table it is found that among the targeted audience, 40.24 % audience
preferce Farhan akhtar as the best director and out of that 86.73% audience are students .
20 | P a g e
Q12. This is finding of preference of directors by Indian audience age wise.
$Favourite_director*Age_group Crosstabulation
Age_group
Total5-15 15-25 25-40 40+
$Favourite_directora
Subhash_ghai Count 3 75 22 10 110
james_cameron Count 1 115 17 5 138
Steven_speilberg Count 1 65 20 7 93
Christopher_nolan Count 0 33 5 3 41
Vidhu_Vinod_chopra Count 3 113 22 9 147
Daniel_boyle Count 0 47 8 0 55
David_dhawan Count 1 77 16 8 102
Mahesh_bhatt Count 1 87 14 2 104
Raj_kumar_santoshi Count 2 58 24 2 86
Ramesh_sippy Count 2 36 8 8 54
Ram_gopal_verma Count 0 41 16 3 60
Hrishikesh_mukherji Count 0 25 18 13 56
Farhan_ahktar Count 3 175 19 6 203
Others Count 0 27 2 1 30
Total Count 6 398 70 31 505
Explanation: From this table it is found that among the targeted audience, 40.19% audience
preferce Farhan akhtar as the best director and out of that 86.20% audience are from age
group 15-25.
.
21 | P a g e
Q 13 This is finding of preference of soundtrack of movies in accordance with gender.
$Sound_track*Gender Crosstabulation
Gender
Totalmale female
$Sound_tracka
Instrumental Count 107 89 196
popular_artist Count 138 127 265
Independent_artist Count 39 41 80
No_soundtrack Count 5 5 10
Total Count 262 237 499
Explanation:From this table it is found that among the targeted audience, 53.10 % audience
preferce popular artist as the best sound track and out of that 53.90% audience are males.
Q 14 This is finding of preference of soundtrack of movies in accordance with education .
$Sound_track*Education Crosstabulation
Education
TotalSSC HSC
graduatio
n
post
graduation
$Sound_tracka
Instrumental Count 6 54 65 67 192
popular_artist Count 20 92 103 42 257
Independent_artist Count 1 33 21 19 74
No_soundtrack Count 0 8 1 1 10
Total Count 26 170 170 116 482
Explanation:From this table it is found that among the targeted audience, 53.31 % audience
preferce popular artist as the best sound track and out of that 40.07 % audience are graduates .
22 | P a g e
Q 15 This is finding of preference of soundtrack of movies in accordance with
qualification .
$Sound_track*Qualification Crosstabulation
Qualification
Total
employ
ed student housewife ohers
$Sound_tracka
Instrumental Count 30 135 3 20 188
popular_artist Count 32 213 5 6 256
Independent_artist Count 11 60 1 3 75
No_soundtrack Count 1 8 0 1 10
Total Count 67 372 9 29 477
Explanation:From this table it is found that among the targeted audience, 53.66 % audience preferce
popular artist as the best sound track and out of that 83.20 % audience are students
Q 16 This is finding of preference of soundtrack of movies in accordance with age.
$Sound_track*Age_group Crosstabulation
Age_group
Total5-15 15-25 25-40 40+
$Sound_tracka
Instrumental Count 1 145 33 16 195
popular_artist Count 5 217 28 15 265
Independent_artist Count 0 66 11 2 79
No_soundtrack Count 0 8 2 0 10
Total Count 6 390 68 32 496
23 | P a g e
Explanation: From this table it is found that among the targeted audience, 53.42 % audience
preferce popular artist as the best sound track and out of that 81.88 % audience are from age 15-
25.
24 | P a g e
Q 17 This is bar graph of frequencies of movies watched by Indian audience in theatre
Explanation: From this graph it is found that among the targeted audience 20.76% males
preferce to see movies in theaters once or twice
25 | P a g e
Q 18 This is the bar graph of frequencies of Indian audience buying DVD’s after
watching movies in theatres
Explanation: From this graph it is found that among the targeted audience 41.35% males
preferce to buy DVD’s after watching movis in theaters .
Q 19 This is the bar graph of frequencies of Indian audience regarding remakes of
movies being a good idea .
Explanation: From this graph it is found that among the targeted audience 28.16 .% females
preferce that remakes of movies is a good idea.
26 | P a g e
Q 20 This is the bar graph of frequencies of Indian audience buying tickets in advace .
Explanation: From this graph it is found that among the targeted audience 22.46 % males
preferce to buy movie tickets in advance.
Q 21This is the bar graph of frequencies of Indian audience buying tickets online
gender wise
Explanation: From this graph it is found that among the targeted audience 41.35 % males
preferce to buy movie tickets online.
27 | P a g e
Q 22 This is the bar graph of frequencies of the preferences of Indian audience
regarding the usage of high definition format gender wise .
Explanation: From this graph it is found that among the targeted audience 29 .00 %
females preferces the usage of high definition formate dvd’s
Q 23 This is the bar graph of frequencies of the Indian audience regarding the movies
sequels
Explanation: From this graph it is found that among the targeted audience 28.66 % females
depend upon the subject of movie in the sequel.
28 | P a g e
Q 24 This is the bar graph of frequencies of the Indian audience regarding need to
colorized black and white movies gender wise
Explanation: From this graph it is found that among the targeted audience 30.51% males
wants to colourized black and white movies .
Q 25 This is the bar graph of frequencies of the Indian audience watching forenge
langue film in original dialect gender wise.
Explanation: From this graph it is found that among the targeted audience 26.10 % males
preferce watching forenge langue film in original dialect.
29 | P a g e
Q 26 This is the bar graph of frequencies of preferce of the Indian audience regarding
of soundtrack .
Explanation: From this graph it is found that among the targeted audience 28.21 % females
founds that setting of sound track is very important aspect in movies.
Q 27 This is the bar graph of frequencies of the Indian audience regarding the rise of
home theater set up distorting movie industries.
Explanation: From this graph it is found that among the targeted audience 32.34 % males
do not prefers home theaters set ups .
30 | P a g e
Q 28 This is the bar graph of frequencies of Indian audience regarding the quality of
movies compared that of old.
Explanation1 : From this graph it is found that among the targeted audience 20.68 %
females founds that quality can’t compares that to old .
Explanation 2 : From this graph it is found that among the targeted audience 20.68 %
males founds that they have got much better quality compares that to old .
31 | P a g e
Q 29 This is the bar graph of frequencies of Indian audience regarding watching of a
pirated movies .
Explanation : From this graph it is found that among the targeted audience 26.28 % males
prefers watching pirated movies.
32 | P a g e
Q 30 Association of sorts of movies watched in relation to age
H0: There is no significant association between Age-group and genre
H1: There is significant association between Age-group and genre
Level of significane (α) =0.05
Test Statistics
Chi-square 2893.661a
df 27
Asymp.Sig. .000
Explanation:- There is a significant association between Age-group and the genre of the movie preferred. We
found that the people in age-group 15-25 prefer watching comedy, action and horror movies.
33 | P a g e
Q 31 Association of sorts of movies watched in relation to qualification
H0: There is no significant association between Qualification and genre
H1: There is significant association between Qualification and genre
Level of significane (α) =0.05
Test Statistics
Chi-square 3197.877a
df 30
Asymp.Sig. .000
34 | P a g e
Explanation: There is a significant association between Qualification and the genre of the movie preferred. We
found that the student prefer watching comedy, action, sci-fic and horror movies.
Q 32 Association of foreign film watched in original dialect with reference to
qualification
H0: There is no significant association between Qualification and Dialect
H1: There is significant association between Qualification and Dialect
Chi-Square Tests
Value df
Asymp. Sig. (2-
sided)
Pearson Chi-Square 62.184a
9 .000
Likelihood Ratio 12.472 9 .188
Linear-by-Linear Association .542 1 .462
N of Valid Cases 477
35 | P a g e
Explanation:- There is a significant association between Qualification and the Dialect of the movie preferred.
Q 33 Association of downloaded or pirated movies watched in relation to qualification
H0: There is no significant association between Qualification and Piracy
H1: There is significant association between Qualification and Piracy
Pirated
Chi-Square Tests
Value df
Asymp. Sig. (2-
sided)
Pearson Chi-Square 3.408a
6 .756
Likelihood Ratio 3.796 6 .704
Linear-by-Linear Association .162 1 .688
N of Valid Cases 484
36 | P a g e
Explanation:- There is no significant association between Qualification and the Piracy.
1) On an average 70% of audience prefer to watch comedy movies.
2) On an average 47% audience prefer direction and music each as per
important aspects of a good movie.
3) On an average 40% audience like farhan akthar as bestdirector.
4) On an average 53 % audience thinks that they prefer music from popular
artist or 53 %audience prefer sound tracks of popular artist.
5) On an average 20% of male and 18% female audience watch movie once
or twice a month.
6) 41% of male and 36 % female audience like to buy dvd’s after watching
in theatre.
7) 22% of male 21 % of female like to buy tickets online only for selected
movies.
8) It is found that there is significant association between age –group and the
genre of the movie preferred.
We found that the people in the age-group 15 – 25 prefer watching comedy
,action, &horror movies.
9) There is significant association between qualification and genre of movie
preferred .we found that student prefer watching comedy action, sci-fic
and horror movies.
10) There is significant association between qualification and dialect of
the foreign movie.
11) There is no significant association between qualification and
audience watching pirated movie.
37 | P a g e
The limitations of the study are the following
 The data was collected through questionnaire; accumulated data may not be precisely
matched to the needed research work.
 The sample taken for the study was only 530 and the results drawn may not be
accurate.
 Since the target audience is wide, it acts as another barrier for getting data and
reaching to the masses.
 Another difficulty was very limited time-span of the project (only fifteen days) .
 Lack of experience of Researcher (using different research tools to conduct the
research).
38 | P a g e
BIBLIOGRAPHY
1)Pnneerselvam,r , “Research Methodology”, Prentice –hall of India pvt ltd , New
Delhi 2007
2)Mcburney ,donald “Research Methodology”,Thomson wadsworth india ,New
delhi,2006
3)Kothari,c.r.”Research Methodology”Wishwa prakashan ,New delhi,2008
WEBLIOGRAPHY
www.quibblo.com/quizzes
39 | P a g e
QUESTIONNAIRE
What sorts of movies do you enjoy?
Please select all that apply.
 Action
 Drama
 Comedy
 Horror
 Sci-Fi
 Classics
 Documentary
 Independent
How often do you see movies in the theatre?
 Once or twice a week.
 Once or twice a month.
 Once or twice every few months.
 Once or twice a year.
 Rarely, if ever.
If you enjoyed the movie in the theatre, how likely are you to buy it on DVD
later?
 Very likely.
 Somewhat likely.
 Not very likely.
 Not likely at all.
Which of the following aspects do you feel is most important to a good movie?
40 | P a g e
Please select all that apply.
 Cast
 Writing
 Direction
 Special Effects
Do you feel re-makes of old films are a good idea?
 Yes
 No
 Depends on the subject matter
Do you buy tickets in advance?
 Yes, almost always.
 Yes, but only for select movies.
 No
Do you think high definition DVD (either Blu-Ray or HD-DVD) is a good idea?
 Yes
 No
Which high definition format do you prefer?
 Blu-Ray
 HD-DVD
Who is your favorite director?
 Subhash ghai
 James Cameron
 Steven Stpeilberg
 Christopher Nolan
 Vidhu Vinod Chopra
 Daniel Boyle
 David Dhawan
 Mahesh Bhatt
 Raj Kumar Santoshi
41 | P a g e
 Ramesh sippy
 Ram Gopal Verma
 Hrishikesh Mukherjii
 Farhan Akthar

 Other (specify in comments)
How do you feel about movie sequels?
 I think they're a great way to extend the story.
 They can be hit or miss.
 The sequels are pretty much always worse than the original.
 They're always a bad idea.
Do you think it's a good idea to colorize black and white films?
 Yes
 No
Do you watch foreign language films in the original dialect?
 Yes, as much as possible.
 Yes, though I may select dubbed if it's available.
 No, I prefer dubbed dialogue.
How important is the soundtrack to the movie?
 Very important, it sets the whole scene.
 Somewhat important, but mostly as background.
 Not very important, though a good one is nice.
 Not important at all.
Which sort of soundtrack do you prefer?
 Instrumental.
 Music from popular artists.
 Music from independent or lesser-known artists.
 No soundtrack.
42 | P a g e
With the rise of home theatre setups, do you feel the movie theatre industry is
dying?
 Yes
 No
How do you feel about the quality of movies compared to movies of old?
 They've gotten much, much better.
 They're about on par with each other.
 They've gotten much, much worse.
 You can't compare them.
o Haveyou ever downloaded or watched a pirated movie?
o Yes
o No
THANKYOUFORYOURVALUABLETIME&RESPONSE

Spss project final

  • 1.
    1 | Pa g e PROJECT REPORT ON SURVEY OF “Preference of Indian audience towards movies” UNDER THE GUIDANCE OF Mr Ramkrishna Poojari SUBMITTED BY Dhiraj bafna Fenil Gosar Laxminarayan Vishwakarma Dinesh Annappa Sanadi IN PARTIAL FULFILMENT OF THE CERTIFICATE COURSE IN STATISTICAL ANALYSIS WITH HANDS ON TRAINING IN SPSS (STATISTICAL PACKAGE FOR SOCIAL SCINECE ) TO DEPARTMENT OF MATHEMATICS AND STATISITCS IN COLLABORATION WITH DEPARTMENT OF BIOINFORMATICS ,GNIRD OF GURU NANAK KHALSA COLLEGE OF ARTS ,SCIENCE & COMMERCE MATUNGA , MUMBAI -400019
  • 2.
    2 | Pa g e ACKNOWLEDGEMENTS We take this opportunity to extend our heartfelt and sincere gratitude to Mr Ramkrishna Poojari for allowing us to do our survey project . It is indeed a matter of great pleasure and proud privilege to be able to present this project on “Preference of Indian audience towards movies”
  • 3.
    3 | Pa g e TABLE OF CONTENTS S.No. Chapters Page No. 1 Introduction 5 1.2 Objective(s) of the Study 6 1.3 The Scope of the Study 7 2. ResearchMethodology 8 2.1 Research design 8 2.2 Sampling design 9 2.3 Data collection tools/methods used 10 3. Findings 12 3.1 Data Intepretation 12-35 4. Conclusion 36 5. Limitation of study 37 6. References 38 6.1 Bibliography 38 6.2 Webliography 38 7. Appendices 39
  • 4.
    4 | Pa g e
  • 5.
    5 | Pa g e 1 Introduction Film also called as movie or motion picture, is a series of still or moving images. It is produced by recording photographic images with cameras, or by creating images using animation techniques or visual effects. The process of filmmaking has developed into an art form and industry. In India film industry is one of the major revenue generation industries Movies shown in India try to show the replica of Indian society as whole. It is one of oldest and largest industry in India after independence .Indian film industry has annual growth rate of 9.3% over the next five years reaching to 13650 crores in 2015 from 8750 crores in year 2010 (as per report from price water copper ltd company). It generates lots of employment. Basically Indian movie industry is nothing but an entertainment industry which tries to entertain Indian audience in the art form which is liked and watched by most of Indians .There are many aspects to Indian movie industry. Movie industry also tries to show the current happening in the country. Besides Indians being a multi linguistic, multicultural country, the people of India are very much secular about movies. Even in various types of diversity like that of states, languages, religions, casts, cultures, they shows uniformity towards movies. Movie industries is one of trend setters among youths. In this survey we intend to find the preferences of Indian audience towards movies. .
  • 6.
    6 | Pa g e 1.2 Objectives of the Study Some of the objectives of the project were:-  To identify the preference of Indian audience towards movies.  To identify changing trends of Indian audience  To understand the Scope of Indian film industry
  • 7.
    7 | Pa g e Scope of the study  The problem is that, volumes of audience very vast, spread across many dimension, but do we are able to reach only few of that.  Most important what is their recall/remembrance value.  If we could have use online or internet media then we could have reach vast Indian audience living out of India,  how many audience could be reply such type of questionnaires or websites that provide research survey or how many actually opt for it if we would be online.  Large number of inidan audieance through out of the world would have been able to reply such type of queationalr if we could be placed online .
  • 8.
    8 | Pa g e Research Methodology Research is a systematic method of finding solutions to problems. It is essentially an investigation, a recording and an analysis of evidence for the purpose of gaining knowledge. According to Clifford woody, “research comprises of defining and redefining problem, formulating hypothesis or suggested solutions, collecting, organizing and evaluating data, reaching conclusions, testing conclusions to determine whether they fit the formulated hypothesis” 2.1 Research Design RESEARCH DESIGN A Research design is a preliminary or tentative explanation or postulate by the researcher of what the researcher considers the outcome of an investigation will be. The formidable problem that follows the tasks of defining the research problem is the preparation of the design of the research project, popularly known as the “research design”. Decisions regarding what, when, how much, by what means concerning an enquiry or a research study constitute a research design. “A research design is the arrangement of conditions for collection and analysis of data in the matter that aims to combine, relevance to the research purpose with economy in procedure.” The Research Design adopted in the study was descriptive in nature. The Study is based on this research design.  Prefence or choice of Indian audience
  • 9.
    9 | Pa g e 2.2 Sampling Design. A sample design is a finite plan for obtaining a sample from a given population. Random sampling technique is used for this study. Universe. The universe chooses for the research study is the population of Mumbai Sample Size. Number of the sampling units selected from the population is called the size of the sample. Sample of 530 respondents were obtained from the population. Sampling Procedure. The procedure adopted in the present study is probability sampling, which is also known as chance sampling. Under this sampling design, every item of the frame has an equal chance of inclusion in the sample.
  • 10.
    10 | Pa g e 2.3 Methods of Data Collection. The data’s were collected through Primary sources. Primary Sources. Primary data are in the form of “raw material” to which statistical methods are applied for the purpose of analysis and interpretations. The primary sources are data collected through questionnaire. Nature of Research. Descriptive research, also known as statistical research, describes data and characteristics about the population or phenomenon being studied. Descriptive research answers the questions who, what, where, when and how. Although the data description is factual, accurate and systematic, the research cannot describe what caused a situation. Thus, descriptive research cannot be used to create a causal relationship, where one variable affects another. In other words, descriptive research can be said to have a low requirement for internal validity. Questionnaire. A well defined questionnaire that is used effectively can gather information on both overall performance of the test system as well as information on specific components of the system.
  • 11.
    11 | Pa g e A defeated questionnaire was carefully prepared. The questions were arranged in proper order, in accordance with the relevance. Nature of Questions Asked. The questionnaire consists of open ended, Sample A finite subset of population, selected from it with the objective of investigating its properties called a sample. A sample is a representative part of the population. A sample of 530 respondents in total has been randomly selected. The response to various elements under each questions were totaled for the purpose of various statistical testing. Variables of the Study. The direct variable of the study is the age, gender, occupation and qualification of the respondents with awareness as an indirect variable Presentation of Data. The data are presented through charts, graphs and tables. .
  • 12.
    12 | Pa g e 3.1 DATA INTERPRETATION: The following charts gives us findings as per the data collected through the survey Q1.This the findings of genre’s of movies with respect to genders $Genre*Gender Crosstabulation Gender TotalMale female $Genrea Action Count 153 82 235 Comedy Count 175 190 365 Sci_fic Count 57 43 100 Documentary Count 36 22 58 Drama Count 22 41 63 Classic Count 28 27 55 Horror Count 84 84 168 Independent Count 20 26 46 Total Count 267 253 520 Explanation: From this table it is found that among the targeted audience, 70% audience preferred comedy movies and in that 52% are female audience
  • 13.
    13 | Pa g e Q2.This the findings of genre’s of movies with respect to education $Genre*Education Crosstabulation Education TotalSSC HSC graduation post graduation $Genrea Action Count 14 81 72 61 228 Comedy Count 17 126 126 88 357 Sci_fic Count 5 30 35 27 97 Documentary Count 4 16 13 25 58 Drama Count 7 13 26 17 63 Classic Count 2 16 13 22 53 Horror Count 9 69 55 30 163 Independent Count 3 17 13 10 43 Total Count 26 181 176 120 503 Explanation: From this table it is found that among the targeted audience, 70.97% audience preferred comedy movies and in that 35% are Graduates and 35% are HSC pass audience .Q3. This the findings of genre’s of movies with respect to age. $Genre*Age_group Crosstabulation Age_group Total5-15 15-25 25-40 40+ $Genrea Action Count 5 183 29 16 233 Comedy Count 3 286 51 25 365 Sci_fic Count 2 76 11 9 98 Documentary Count 0 37 13 8 58 Drama Count 0 45 10 7 62 Classic Count 0 31 12 12 55 Horror Count 3 149 14 3 169 Independent Count 0 35 7 4 46 Total Count 6 406 70 34 516 Explanation: From this table it is found that among the targeted audience, 70.73 % audience preferred comedy movies and in that 78.35 % are from age group 15-25
  • 14.
    14 | Pa g e Q4. This the findings of genre’s of movies with respect to qualification . $Genre*Qualification Crosstabulation Qualification Totalemployed student housewife ohers $Genrea Action Count 27 180 5 14 226 Comedy Count 53 273 6 19 351 Sci_fic Count 8 81 2 8 99 Documentary Count 13 36 1 7 57 Drama Count 12 42 4 3 61 Classic Count 14 28 1 11 54 Horror Count 12 145 0 6 163 Independent Count 6 34 1 3 44 Total Count 70 390 9 29 498 Explanation: From this table it is found that among the targeted audience, 70.48% audience preferred comedy movies and in that 77.77 % are from students category Q5.This is finding of aspects of good movies in accordance with gender $Aspect_for_good_movies*Gender Crosstabulation Gender Totalmale female $Aspect_for_good_moviesa Cast Count 51 48 99 writing Count 107 84 191 direction Count 141 105 246 special_effects Count 56 45 101 Music Count 106 140 246 Remakes Count 58 35 93 Total Count 267 251 518 Explanation: From this table it is found that among the targeted audience, 47.49% audience preferce direction and music each.
  • 15.
    15 | Pa g e Q6. .This is finding of aspects of good movies in accordance with education. $Aspect_for_good_movies*Education Crosstabulation Education TotalSSC HSC graduation post graduation $Aspect_for_good_mo viesa Cast Count 6 32 28 31 97 writing Count 8 61 61 59 189 direction Count 9 77 87 66 239 special_effects Count 8 41 34 14 97 Music Count 13 90 82 52 237 Remakes Count 12 27 37 14 90 Total Count 26 182 176 118 502 Explanation: From this table it is found that among the targeted audience, 47.60 % audience preferce direction and 36.40% audience are graduates Q7. This is finding of aspects of good movies in accordance with qualification. $Aspect_for_good_movies*Qualification Crosstabulation Qualification Total employe d student housewif e ohers $Aspect_for_good_moviesa Cast Count 10 78 1 4 93 writing Count 31 136 4 15 186 direction Count 38 176 4 18 236 special_effects Count 12 76 2 4 94 Music Count 34 188 6 9 237 Remakes Count 12 70 2 3 87 Total Count 70 388 9 29 496 Explanation: From this table it is found that among the targeted audience, 47.78 % audience preferce music and 79.32% audience are students
  • 16.
    16 | Pa g e Q8. This is finding of aspects of good movies in accordance with age . $Aspect_for_good_movies*Age_group Crosstabulation Age_group Total5-15 15-25 25-40 40+ $Aspect_for_good_moviesa Cast Co unt 2 86 7 6 101 writing Co unt 2 140 30 18 190 direction Co unt 1 182 37 23 243 special_effects Co unt 3 80 12 5 100 Music Co unt 0 198 33 16 247 Remakes Co unt 3 73 11 5 92 Total Co unt 6 405 70 33 514 Explanation: From this table it is found that among the targeted audience, 48.05 % audience preferce music and 80.16 % audience are from age group 15-25
  • 17.
    17 | Pa g e Q9. This is finding of preference of directors by Indian audience gender wise. $Favourite_director*Gender Crosstabulation Gender Totalmale female $Favourite _directora Subhash_ghai Count 59 50 109 james_cameron Count 83 56 139 Steven_speilberg Count 62 32 94 Christopher_nolan Count 27 15 42 Vidhu_Vinod_chopra Count 69 78 147 Daniel_boyle Count 31 26 57 David_dhawan Count 57 44 101 Mahesh_bhatt Count 49 56 105 Raj_kumar_santoshi Count 46 42 88 Ramesh_sippy Count 35 20 55 Ram_gopal_verma Count 32 28 60 Hrishikesh_mukherji Count 28 28 56 Farhan_ahktar Count 98 107 205 Others Count 18 12 30 Total Count 262 247 509 Explanation: From this table it is found that among the targeted audience, 40.27 % audience preferce Farhan akhtar as the best director and out of that 52.19% audience are females.
  • 18.
    18 | Pa g e Q10. This is finding of preference of directors by Indian audience education wise . $Favourite_director*Education Crosstabulation Education TotalSSC HSC graduation post graduation $Favourite_directora Subhash_ghai Count 9 39 33 26 107 james_cameron Count 10 40 52 33 135 Steven_speilberg Count 1 35 26 31 93 Christopher_nolan Count 1 13 10 17 41 Vidhu_Vinod_chopra Count 9 43 52 39 143 Daniel_boyle Count 1 23 20 11 55 David_dhawan Count 11 39 33 16 99 Mahesh_bhatt Count 7 43 38 14 102 Raj_kumar_santoshi Count 4 24 32 24 84 Ramesh_sippy Count 3 16 24 10 53 Ram_gopal_verma Count 4 19 25 8 56 Hrishikesh_mukherji Count 5 10 17 21 53 Farhan_ahktar Count 13 61 74 52 200 Others Count 0 11 14 5 30 Total Count 26 174 174 118 492 Explanation: From this table it is found that among the targeted audience40.65 % audience preferce Farhan akhtar as the best director and out of that 37 % audience are graduates
  • 19.
    19 | Pa g e Q11. This is finding of preference of directors by Indian audience qualification wise. $Favourite_director*Qualification Crosstabulation Qualification Total employe d student housewi fe ohers $Favourite_directora Subhash_ghai Count 21 72 2 9 104 james_cameron Count 13 114 2 5 134 Steven_speilberg Count 14 66 0 12 92 Christopher_nolan Count 5 34 0 3 42 Vidhu_Vinod_chopra Count 23 109 4 7 143 Daniel_boyle Count 8 45 0 0 53 David_dhawan Count 16 73 5 3 97 Mahesh_bhatt Count 15 81 0 3 99 Raj_kumar_santoshi Count 16 60 3 4 83 Ramesh_sippy Count 8 35 2 6 51 Ram_gopal_verma Count 14 40 1 3 58 Hrishikesh_mukherji Count 20 19 4 11 54 Farhan_ahktar Count 15 170 6 5 196 Others Count 0 29 0 1 30 Total Count 70 380 9 28 487 Explanation: From this table it is found that among the targeted audience, 40.24 % audience preferce Farhan akhtar as the best director and out of that 86.73% audience are students .
  • 20.
    20 | Pa g e Q12. This is finding of preference of directors by Indian audience age wise. $Favourite_director*Age_group Crosstabulation Age_group Total5-15 15-25 25-40 40+ $Favourite_directora Subhash_ghai Count 3 75 22 10 110 james_cameron Count 1 115 17 5 138 Steven_speilberg Count 1 65 20 7 93 Christopher_nolan Count 0 33 5 3 41 Vidhu_Vinod_chopra Count 3 113 22 9 147 Daniel_boyle Count 0 47 8 0 55 David_dhawan Count 1 77 16 8 102 Mahesh_bhatt Count 1 87 14 2 104 Raj_kumar_santoshi Count 2 58 24 2 86 Ramesh_sippy Count 2 36 8 8 54 Ram_gopal_verma Count 0 41 16 3 60 Hrishikesh_mukherji Count 0 25 18 13 56 Farhan_ahktar Count 3 175 19 6 203 Others Count 0 27 2 1 30 Total Count 6 398 70 31 505 Explanation: From this table it is found that among the targeted audience, 40.19% audience preferce Farhan akhtar as the best director and out of that 86.20% audience are from age group 15-25. .
  • 21.
    21 | Pa g e Q 13 This is finding of preference of soundtrack of movies in accordance with gender. $Sound_track*Gender Crosstabulation Gender Totalmale female $Sound_tracka Instrumental Count 107 89 196 popular_artist Count 138 127 265 Independent_artist Count 39 41 80 No_soundtrack Count 5 5 10 Total Count 262 237 499 Explanation:From this table it is found that among the targeted audience, 53.10 % audience preferce popular artist as the best sound track and out of that 53.90% audience are males. Q 14 This is finding of preference of soundtrack of movies in accordance with education . $Sound_track*Education Crosstabulation Education TotalSSC HSC graduatio n post graduation $Sound_tracka Instrumental Count 6 54 65 67 192 popular_artist Count 20 92 103 42 257 Independent_artist Count 1 33 21 19 74 No_soundtrack Count 0 8 1 1 10 Total Count 26 170 170 116 482 Explanation:From this table it is found that among the targeted audience, 53.31 % audience preferce popular artist as the best sound track and out of that 40.07 % audience are graduates .
  • 22.
    22 | Pa g e Q 15 This is finding of preference of soundtrack of movies in accordance with qualification . $Sound_track*Qualification Crosstabulation Qualification Total employ ed student housewife ohers $Sound_tracka Instrumental Count 30 135 3 20 188 popular_artist Count 32 213 5 6 256 Independent_artist Count 11 60 1 3 75 No_soundtrack Count 1 8 0 1 10 Total Count 67 372 9 29 477 Explanation:From this table it is found that among the targeted audience, 53.66 % audience preferce popular artist as the best sound track and out of that 83.20 % audience are students Q 16 This is finding of preference of soundtrack of movies in accordance with age. $Sound_track*Age_group Crosstabulation Age_group Total5-15 15-25 25-40 40+ $Sound_tracka Instrumental Count 1 145 33 16 195 popular_artist Count 5 217 28 15 265 Independent_artist Count 0 66 11 2 79 No_soundtrack Count 0 8 2 0 10 Total Count 6 390 68 32 496
  • 23.
    23 | Pa g e Explanation: From this table it is found that among the targeted audience, 53.42 % audience preferce popular artist as the best sound track and out of that 81.88 % audience are from age 15- 25.
  • 24.
    24 | Pa g e Q 17 This is bar graph of frequencies of movies watched by Indian audience in theatre Explanation: From this graph it is found that among the targeted audience 20.76% males preferce to see movies in theaters once or twice
  • 25.
    25 | Pa g e Q 18 This is the bar graph of frequencies of Indian audience buying DVD’s after watching movies in theatres Explanation: From this graph it is found that among the targeted audience 41.35% males preferce to buy DVD’s after watching movis in theaters . Q 19 This is the bar graph of frequencies of Indian audience regarding remakes of movies being a good idea . Explanation: From this graph it is found that among the targeted audience 28.16 .% females preferce that remakes of movies is a good idea.
  • 26.
    26 | Pa g e Q 20 This is the bar graph of frequencies of Indian audience buying tickets in advace . Explanation: From this graph it is found that among the targeted audience 22.46 % males preferce to buy movie tickets in advance. Q 21This is the bar graph of frequencies of Indian audience buying tickets online gender wise Explanation: From this graph it is found that among the targeted audience 41.35 % males preferce to buy movie tickets online.
  • 27.
    27 | Pa g e Q 22 This is the bar graph of frequencies of the preferences of Indian audience regarding the usage of high definition format gender wise . Explanation: From this graph it is found that among the targeted audience 29 .00 % females preferces the usage of high definition formate dvd’s Q 23 This is the bar graph of frequencies of the Indian audience regarding the movies sequels Explanation: From this graph it is found that among the targeted audience 28.66 % females depend upon the subject of movie in the sequel.
  • 28.
    28 | Pa g e Q 24 This is the bar graph of frequencies of the Indian audience regarding need to colorized black and white movies gender wise Explanation: From this graph it is found that among the targeted audience 30.51% males wants to colourized black and white movies . Q 25 This is the bar graph of frequencies of the Indian audience watching forenge langue film in original dialect gender wise. Explanation: From this graph it is found that among the targeted audience 26.10 % males preferce watching forenge langue film in original dialect.
  • 29.
    29 | Pa g e Q 26 This is the bar graph of frequencies of preferce of the Indian audience regarding of soundtrack . Explanation: From this graph it is found that among the targeted audience 28.21 % females founds that setting of sound track is very important aspect in movies. Q 27 This is the bar graph of frequencies of the Indian audience regarding the rise of home theater set up distorting movie industries. Explanation: From this graph it is found that among the targeted audience 32.34 % males do not prefers home theaters set ups .
  • 30.
    30 | Pa g e Q 28 This is the bar graph of frequencies of Indian audience regarding the quality of movies compared that of old. Explanation1 : From this graph it is found that among the targeted audience 20.68 % females founds that quality can’t compares that to old . Explanation 2 : From this graph it is found that among the targeted audience 20.68 % males founds that they have got much better quality compares that to old .
  • 31.
    31 | Pa g e Q 29 This is the bar graph of frequencies of Indian audience regarding watching of a pirated movies . Explanation : From this graph it is found that among the targeted audience 26.28 % males prefers watching pirated movies.
  • 32.
    32 | Pa g e Q 30 Association of sorts of movies watched in relation to age H0: There is no significant association between Age-group and genre H1: There is significant association between Age-group and genre Level of significane (α) =0.05 Test Statistics Chi-square 2893.661a df 27 Asymp.Sig. .000 Explanation:- There is a significant association between Age-group and the genre of the movie preferred. We found that the people in age-group 15-25 prefer watching comedy, action and horror movies.
  • 33.
    33 | Pa g e Q 31 Association of sorts of movies watched in relation to qualification H0: There is no significant association between Qualification and genre H1: There is significant association between Qualification and genre Level of significane (α) =0.05 Test Statistics Chi-square 3197.877a df 30 Asymp.Sig. .000
  • 34.
    34 | Pa g e Explanation: There is a significant association between Qualification and the genre of the movie preferred. We found that the student prefer watching comedy, action, sci-fic and horror movies. Q 32 Association of foreign film watched in original dialect with reference to qualification H0: There is no significant association between Qualification and Dialect H1: There is significant association between Qualification and Dialect Chi-Square Tests Value df Asymp. Sig. (2- sided) Pearson Chi-Square 62.184a 9 .000 Likelihood Ratio 12.472 9 .188 Linear-by-Linear Association .542 1 .462 N of Valid Cases 477
  • 35.
    35 | Pa g e Explanation:- There is a significant association between Qualification and the Dialect of the movie preferred. Q 33 Association of downloaded or pirated movies watched in relation to qualification H0: There is no significant association between Qualification and Piracy H1: There is significant association between Qualification and Piracy Pirated Chi-Square Tests Value df Asymp. Sig. (2- sided) Pearson Chi-Square 3.408a 6 .756 Likelihood Ratio 3.796 6 .704 Linear-by-Linear Association .162 1 .688 N of Valid Cases 484
  • 36.
    36 | Pa g e Explanation:- There is no significant association between Qualification and the Piracy. 1) On an average 70% of audience prefer to watch comedy movies. 2) On an average 47% audience prefer direction and music each as per important aspects of a good movie. 3) On an average 40% audience like farhan akthar as bestdirector. 4) On an average 53 % audience thinks that they prefer music from popular artist or 53 %audience prefer sound tracks of popular artist. 5) On an average 20% of male and 18% female audience watch movie once or twice a month. 6) 41% of male and 36 % female audience like to buy dvd’s after watching in theatre. 7) 22% of male 21 % of female like to buy tickets online only for selected movies. 8) It is found that there is significant association between age –group and the genre of the movie preferred. We found that the people in the age-group 15 – 25 prefer watching comedy ,action, &horror movies. 9) There is significant association between qualification and genre of movie preferred .we found that student prefer watching comedy action, sci-fic and horror movies. 10) There is significant association between qualification and dialect of the foreign movie. 11) There is no significant association between qualification and audience watching pirated movie.
  • 37.
    37 | Pa g e The limitations of the study are the following  The data was collected through questionnaire; accumulated data may not be precisely matched to the needed research work.  The sample taken for the study was only 530 and the results drawn may not be accurate.  Since the target audience is wide, it acts as another barrier for getting data and reaching to the masses.  Another difficulty was very limited time-span of the project (only fifteen days) .  Lack of experience of Researcher (using different research tools to conduct the research).
  • 38.
    38 | Pa g e BIBLIOGRAPHY 1)Pnneerselvam,r , “Research Methodology”, Prentice –hall of India pvt ltd , New Delhi 2007 2)Mcburney ,donald “Research Methodology”,Thomson wadsworth india ,New delhi,2006 3)Kothari,c.r.”Research Methodology”Wishwa prakashan ,New delhi,2008 WEBLIOGRAPHY www.quibblo.com/quizzes
  • 39.
    39 | Pa g e QUESTIONNAIRE What sorts of movies do you enjoy? Please select all that apply.  Action  Drama  Comedy  Horror  Sci-Fi  Classics  Documentary  Independent How often do you see movies in the theatre?  Once or twice a week.  Once or twice a month.  Once or twice every few months.  Once or twice a year.  Rarely, if ever. If you enjoyed the movie in the theatre, how likely are you to buy it on DVD later?  Very likely.  Somewhat likely.  Not very likely.  Not likely at all. Which of the following aspects do you feel is most important to a good movie?
  • 40.
    40 | Pa g e Please select all that apply.  Cast  Writing  Direction  Special Effects Do you feel re-makes of old films are a good idea?  Yes  No  Depends on the subject matter Do you buy tickets in advance?  Yes, almost always.  Yes, but only for select movies.  No Do you think high definition DVD (either Blu-Ray or HD-DVD) is a good idea?  Yes  No Which high definition format do you prefer?  Blu-Ray  HD-DVD Who is your favorite director?  Subhash ghai  James Cameron  Steven Stpeilberg  Christopher Nolan  Vidhu Vinod Chopra  Daniel Boyle  David Dhawan  Mahesh Bhatt  Raj Kumar Santoshi
  • 41.
    41 | Pa g e  Ramesh sippy  Ram Gopal Verma  Hrishikesh Mukherjii  Farhan Akthar   Other (specify in comments) How do you feel about movie sequels?  I think they're a great way to extend the story.  They can be hit or miss.  The sequels are pretty much always worse than the original.  They're always a bad idea. Do you think it's a good idea to colorize black and white films?  Yes  No Do you watch foreign language films in the original dialect?  Yes, as much as possible.  Yes, though I may select dubbed if it's available.  No, I prefer dubbed dialogue. How important is the soundtrack to the movie?  Very important, it sets the whole scene.  Somewhat important, but mostly as background.  Not very important, though a good one is nice.  Not important at all. Which sort of soundtrack do you prefer?  Instrumental.  Music from popular artists.  Music from independent or lesser-known artists.  No soundtrack.
  • 42.
    42 | Pa g e With the rise of home theatre setups, do you feel the movie theatre industry is dying?  Yes  No How do you feel about the quality of movies compared to movies of old?  They've gotten much, much better.  They're about on par with each other.  They've gotten much, much worse.  You can't compare them. o Haveyou ever downloaded or watched a pirated movie? o Yes o No THANKYOUFORYOURVALUABLETIME&RESPONSE