Downloaded 20 times


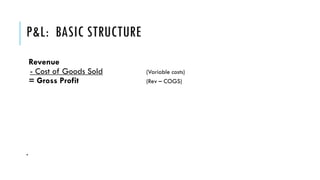
![P&L: BASIC STRUCTURE
Revenue
- Cost of Goods Sold (Variable costs)
= Gross Profit (Rev – COGS)
Gross Profit
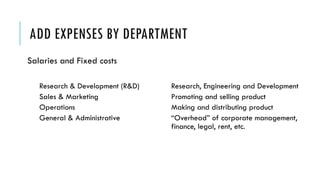
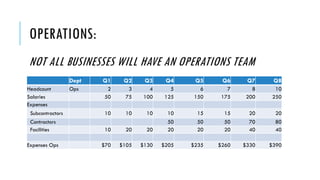
- Expenses (Fixed Costs)
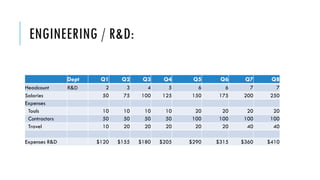
R&D
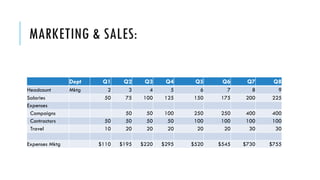
Sales and Mktg
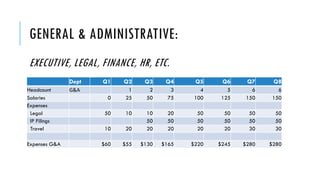
General and Administrative (G&A)
= Net Profit [Gross Profit - Expenses]
.](https://image.slidesharecdn.com/apia2018-rickrasmussen-buildingafinancialmodel-180924103814/85/APIA2018-Rick-Rasmussen-Building-a-Financial-Model-13-320.jpg)
![P&L: BASIC STRUCTURE
Revenue
- Cost of Goods Sold (Variable costs)
= Gross Profit (Rev – COGS)
Gross Profit
- Expenses (Fixed Costs)
R&D
Sales and Mktg
General and Administrative (G&A)
= Net Profit [Gross Profit - Expenses]
+/- Other Income (expense)
= Net Income](https://image.slidesharecdn.com/apia2018-rickrasmussen-buildingafinancialmodel-180924103814/85/APIA2018-Rick-Rasmussen-Building-a-Financial-Model-14-320.jpg)
![THREE THINGS TO FIGURE OUT…
Revenue
- Cost of Goods Sold (Variable costs)
= Gross Profit (Rev – COGS)
Gross Profit
- Expenses (Fixed Costs)
R&D
Sales and Mktg
General and Administrative (G&A)
= Net Profit [Gross Profit - Expenses]
+/- Other Income (expense)
= Net Income](https://image.slidesharecdn.com/apia2018-rickrasmussen-buildingafinancialmodel-180924103814/85/APIA2018-Rick-Rasmussen-Building-a-Financial-Model-15-320.jpg)
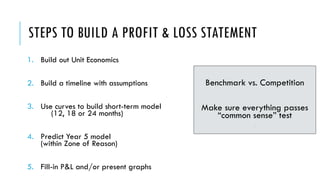


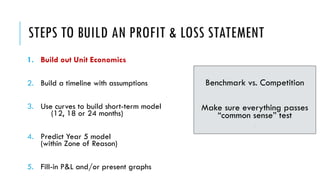
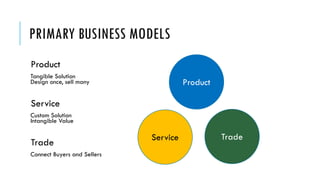
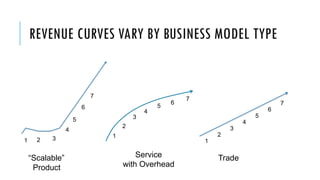

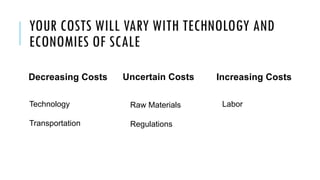


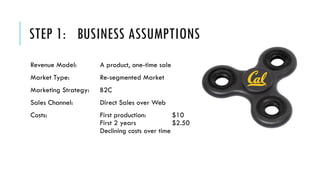


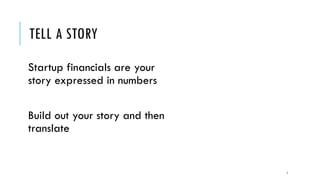
This document provides guidance on building a simple financial model for startups seeking investment. It discusses that investors want to see financial projections that show there is money to be made. It then covers the key components of building a financial model, including determining unit economics, revenue and cost assumptions over time, and constructing profit and loss statements. The document emphasizes translating the startup story into numbers and keeping projections within reasonable ranges compared to benchmarks.