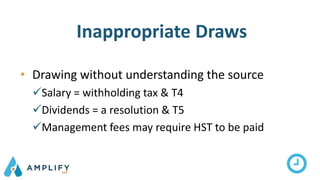
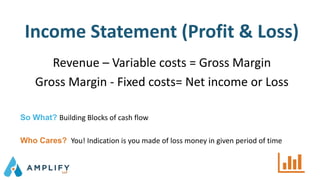
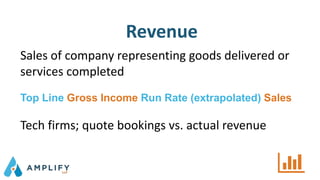
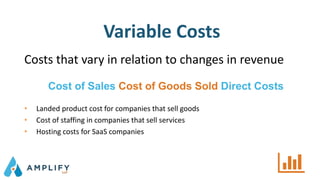
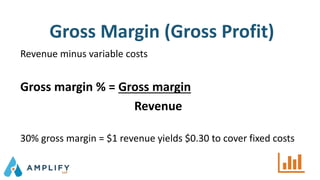
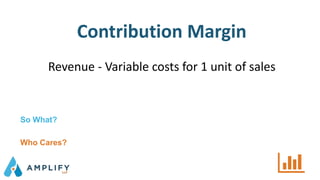
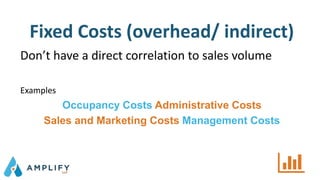
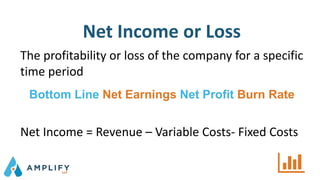
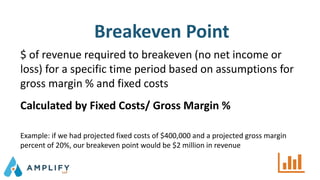
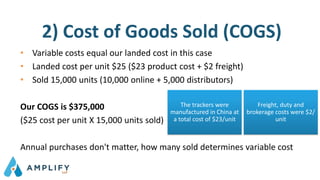
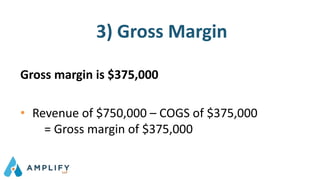
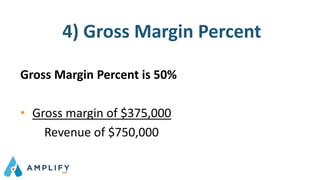
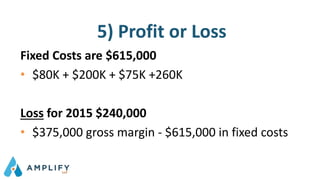
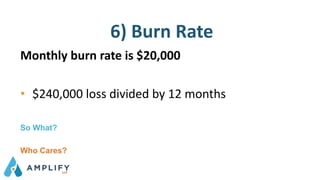
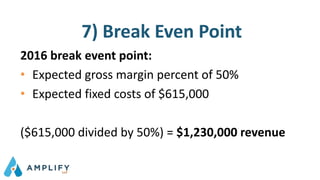
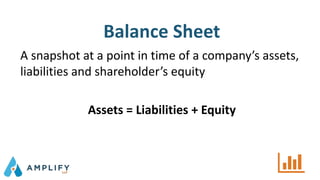
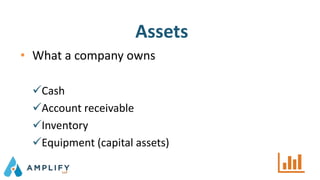
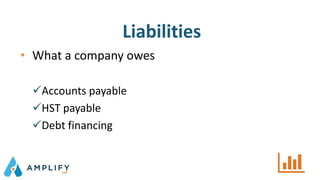
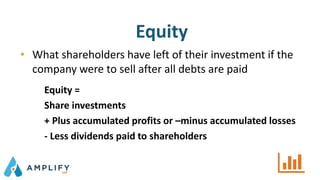
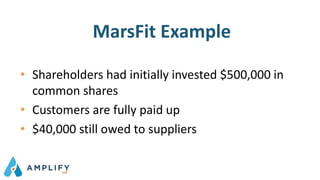
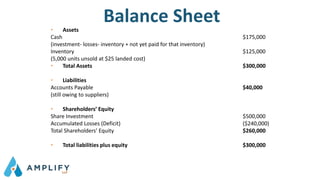
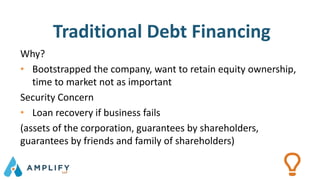
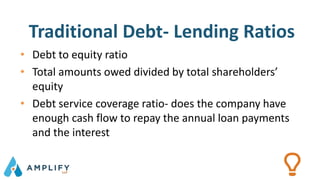
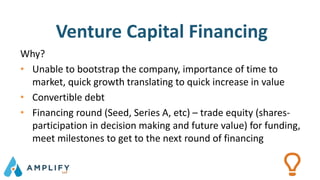
Financial Fundamentals
Workshop Objectives
Simplify your life. Amplify your business.
Meet the Team
Dave Leanne Kyle Katie
Agenda
Common Mistakes Entrepreneurs Make
Financial Terms & Advanced Metrics
Access to Financing
Common Mistakes
Entrepreneurs Make
Errors Managing Money
• Separate business and personal bank accounts
 Accurate records
 Support receipt organization
 Avoid surprises
Lack of Proper Documentation
• Document ALL loans
Non shareholder = Bare interest
Informal loans = Unfavorable tax results
Lack of Proper Documentation
• Shareholder agreements
• Paid subscription for shares
• Employment contracts
Inappropriate Draws
• Drawing without understanding the source
Salary = withholding tax & T4
Dividends = a resolution & T5
Management fees may require HST to be paid
Wrong Structure
• How do I choose?
Sole proprietorship
Corporation
Holding company
Family trust
Questions to Ask
• Are there profits to be retained in the company?
• Are there others to participate in profits?
• Is there a liability risk in the company?
• Is there potential to sell the business?
• Is the benefit worth the cost?
Not Filing or Missed Deadlines
• Failure to remit payroll taxes
• Failure to file T4 or T5
• Failure to file T2
• Installment payments
• GST/ HST
Access to Funds and Tax Credits
• Don’t Miss out
SRED = Tax credit on eligible expenses for R&D
Co-op/ Apprentice = Tax credits on eligible programs
Grants = Training & equipment
HST = Income tax credits & rebates
Practice Recordkeeping
• Pick Supporting Tools
• Standardize categories
• Utilize technology
• Work inside your comfort zone
Why we like QBO
• Easy data entry and document management tools (Receipt
Bank, Hubdoc)
• Business planning tools (Liveplan, Spotlight Forecasting)
• Enhanced reporting tools (Spotlight Reporting)
• Industry specific tools (time tracking for service businesses,
inventory)
• Non financial SaaS (project management)
So What? Who Cares?
Financial Terms
Income Statement (Profit & Loss)
Revenue – Variable costs = Gross Margin
Gross Margin - Fixed costs= Net income or Loss
So What? Building Blocks of cash flow
Who Cares? You! Indication is you made of loss money in given period of time
Revenue
Sales of company representing goods delivered or
services completed
Top Line Gross Income Run Rate (extrapolated) Sales
Tech firms; quote bookings vs. actual revenue
Variable Costs
Costs that vary in relation to changes in revenue
Cost of Sales Cost of Goods Sold Direct Costs
• Landed product cost for companies that sell goods
• Cost of staffing in companies that sell services
• Hosting costs for SaaS companies
Gross Margin (Gross Profit)
Revenue minus variable costs
Gross margin % = Gross margin
Revenue
30% gross margin = $1 revenue yields $0.30 to cover fixed costs
Contribution Margin
Revenue - Variable costs for 1 unit of sales
So What?
Who Cares?
Fixed Costs (overhead/ indirect)
Don’t have a direct correlation to sales volume
Examples
Occupancy Costs Administrative Costs
Sales and Marketing Costs Management Costs
Net Income or Loss
The profitability or loss of the company for a specific
time period
Bottom Line Net Earnings Net Profit Burn Rate
Net Income = Revenue – Variable Costs- Fixed Costs
Breakeven Point
$ of revenue required to breakeven (no net income or
loss) for a specific time period based on assumptions for
gross margin % and fixed costs
Calculated by Fixed Costs/ Gross Margin %
Example: if we had projected fixed costs of $400,000 and a projected gross margin
percent of 20%, our breakeven point would be $2 million in revenue
Company MarsFit
Our company started
selling a fitness tracker in
2015
2015: shipped 10,000
units at $55/each
through online channel &
5,000 units at $40 each
to distributors
2015: further confirmed
orders from distributors
of an additional 2,000
units at $40 each that
shipped Jan 2016
The trackers were
manufactured in China at
a total cost of $23/unit
Freight, duty and
brokerage costs were $2/
unit
We bought 20,000 units
during the year
Rent & occupancy costs: $80,000
Sales & marketing: $200,000
Admin costs: $75,000
Personnel costs: $260,000
1. What was our topline in 2015?
2. What was our cost of goods sold?
3. What is our gross margin?
4. What is our gross margin %?
5. What is our net profit or loss?
6. What is our burn rate per month?
7. What would our breakeven point be in 2016 if our gross margin % and
fixed costs didn't change?
Questions
• $550,000 ($55 x 10,000 units) online channel
$200,000 ($40 x 5,000 units) distribution channel
• The 2,000 units not shipped until 2016 won’t be revenue until
2016
Total revenue is $750,000 ($550,000 + $200,000)
1) Topline (Revenue)
2015: shipped 10,000
units at $55/each
through online channel &
5,000 units at $40 each
to distributors
2015: further confirmed
orders from distributors
of an additional 2,000
units at $40 each that
shipped Jan 2016
2) Cost of Goods Sold (COGS)
• Variable costs equal our landed cost in this case
• Landed cost per unit $25 ($23 product cost + $2 freight)
• Sold 15,000 units (10,000 online + 5,000 distributors)
Our COGS is $375,000
($25 cost per unit X 15,000 units sold)
Annual purchases don't matter, how many sold determines variable cost
The trackers were
manufactured in China at
a total cost of $23/unit
Freight, duty and
brokerage costs were $2/
unit
3) Gross Margin
Gross margin is $375,000
• Revenue of $750,000 – COGS of $375,000
= Gross margin of $375,000
4) Gross Margin Percent
Gross Margin Percent is 50%
• Gross margin of $375,000
Revenue of $750,000
5) Profit or Loss
Fixed Costs are $615,000
• $80K + $200K + $75K +260K
Loss for 2015 $240,000
• $375,000 gross margin - $615,000 in fixed costs
6) Burn Rate
Monthly burn rate is $20,000
• $240,000 loss divided by 12 months
So What?
Who Cares?
7) Break Even Point
2016 break event point:
• Expected gross margin percent of 50%
• Expected fixed costs of $615,000
($615,000 divided by 50%) = $1,230,000 revenue
A snapshot at a point in time of a company’s assets,
liabilities and shareholder’s equity
Assets = Liabilities + Equity
Balance Sheet
Assets
• What a company owns
Cash
Account receivable
Inventory
Equipment (capital assets)
Liabilities
• What a company owes
Accounts payable
HST payable
Debt financing
Equity
• What shareholders have left of their investment if the
company were to sell after all debts are paid
Equity =
Share investments
+ Plus accumulated profits or –minus accumulated losses
- Less dividends paid to shareholders
MarsFit Example
• Shareholders had initially invested $500,000 in
common shares
• Customers are fully paid up
• $40,000 still owed to suppliers
• Assets
Cash $175,000
(investment- losses- inventory + not yet paid for that inventory)
Inventory $125,000
(5,000 units unsold at $25 landed cost)
• Total Assets $300,000
• Liabilities
Accounts Payable $40,000
(still owing to suppliers)
• Shareholders’ Equity
Share Investment $500,000
Accumulated Losses (Deficit) ($240,000)
Total Shareholders’ Equity $260,000
• Total liabilities plus equity $300,000
Balance Sheet
• All businesses are different
• Key to understanding what levers to push to
improve your results and meet your milestones
• Dashboard
So What?
Who Cares?
Understanding Your Key Metrics
Customer Acquisition Costs
The cost of acquiring each customer
Total marketing costs + marketing personnel costs + onboarding
#new customers generated for a period of time
• Compared with Customer Lifetime Value (CLV) to assess viability of
business (CLV divided by CAC)
• CAC payback period
– The time period when our gross margin we get from customers will their
customer acquisition cost
Customer Lifetime Value
Simple calculation
• (g) Gross margin % per customer
• (r) Average monthly or annual revenue per customer
• (l) Average customer lifespan in months or years
Calculation CLV = g X r X l
MarsFit Subscription
• We spend $100,000 on marketing and $100,000 on marketing
personnel
• We get 2,000 new customers
• We have a
– 30% gross margin %
– Average monthly revenue per customer of $40
– And an average customer lifespan of 16 months
Questions
1.What is our CAC?
2.What is our CAC payback period?
3.What is our simple CLV?
4.What is our ratio of CLV to CAC?
Calculations
1. Our CAC is $100 ($200,000 in marketing and sales costs
divided by 2,000 new customers)
2. Our CAC payback period is 8 1/3 months ($100 CAC divided by
$12 (30% of $40) margin per customer per month)
3. Our simple CLV is $192 (30% X $40 X 16 months)
4. Our CLV to CAC ratio is 1.92 to 1 ($192 divided by $100)
Best practices for SaaS businesses seems to be 3 to 1
Access to Financing
Projecting Cash Flow
• Basis for cash flow projection =Income statement
projection
• Timing funds received and paying government
remittances and suppliers
• Inventory timing if you sell goods
• Capital asset needs (equipment, leaseholds)
Consistent Soft Factors
• Team
• Product
• Market
• Fit
Evaluated by traditional debt and VC investors
Evaluating Your Business
Why?
• Bootstrapped the company, want to retain equity ownership,
time to market not as important
Security Concern
• Loan recovery if business fails
(assets of the corporation, guarantees by shareholders,
guarantees by friends and family of shareholders)
Traditional Debt Financing
• Debt to equity ratio
• Total amounts owed divided by total shareholders’
equity
• Debt service coverage ratio- does the company have
enough cash flow to repay the annual loan payments
and the interest
Traditional Debt- Lending Ratios
Venture Capital Financing
Why?
• Unable to bootstrap the company, importance of time to
market, quick growth translating to quick increase in value
• Convertible debt
• Financing round (Seed, Series A, etc) – trade equity (shares-
participation in decision making and future value) for funding,
meet milestones to get to the next round of financing
Questions …

Amplify & MaRS DD - Financial Fundementals

  • 1.
  • 2.
  • 3.
    Simplify your life.Amplify your business.
  • 4.
    Meet the Team DaveLeanne Kyle Katie
  • 5.
    Agenda Common Mistakes EntrepreneursMake Financial Terms & Advanced Metrics Access to Financing
  • 6.
  • 7.
    Errors Managing Money •Separate business and personal bank accounts  Accurate records  Support receipt organization  Avoid surprises
  • 8.
    Lack of ProperDocumentation • Document ALL loans Non shareholder = Bare interest Informal loans = Unfavorable tax results
  • 9.
    Lack of ProperDocumentation • Shareholder agreements • Paid subscription for shares • Employment contracts
  • 10.
    Inappropriate Draws • Drawingwithout understanding the source Salary = withholding tax & T4 Dividends = a resolution & T5 Management fees may require HST to be paid
  • 11.
    Wrong Structure • Howdo I choose? Sole proprietorship Corporation Holding company Family trust
  • 12.
    Questions to Ask •Are there profits to be retained in the company? • Are there others to participate in profits? • Is there a liability risk in the company? • Is there potential to sell the business? • Is the benefit worth the cost?
  • 13.
    Not Filing orMissed Deadlines • Failure to remit payroll taxes • Failure to file T4 or T5 • Failure to file T2 • Installment payments • GST/ HST
  • 14.
    Access to Fundsand Tax Credits • Don’t Miss out SRED = Tax credit on eligible expenses for R&D Co-op/ Apprentice = Tax credits on eligible programs Grants = Training & equipment HST = Income tax credits & rebates
  • 15.
    Practice Recordkeeping • PickSupporting Tools • Standardize categories • Utilize technology • Work inside your comfort zone
  • 16.
    Why we likeQBO • Easy data entry and document management tools (Receipt Bank, Hubdoc) • Business planning tools (Liveplan, Spotlight Forecasting) • Enhanced reporting tools (Spotlight Reporting) • Industry specific tools (time tracking for service businesses, inventory) • Non financial SaaS (project management)
  • 17.
    So What? WhoCares? Financial Terms
  • 18.
    Income Statement (Profit& Loss) Revenue – Variable costs = Gross Margin Gross Margin - Fixed costs= Net income or Loss So What? Building Blocks of cash flow Who Cares? You! Indication is you made of loss money in given period of time
  • 19.
    Revenue Sales of companyrepresenting goods delivered or services completed Top Line Gross Income Run Rate (extrapolated) Sales Tech firms; quote bookings vs. actual revenue
  • 20.
    Variable Costs Costs thatvary in relation to changes in revenue Cost of Sales Cost of Goods Sold Direct Costs • Landed product cost for companies that sell goods • Cost of staffing in companies that sell services • Hosting costs for SaaS companies
  • 21.
    Gross Margin (GrossProfit) Revenue minus variable costs Gross margin % = Gross margin Revenue 30% gross margin = $1 revenue yields $0.30 to cover fixed costs
  • 22.
    Contribution Margin Revenue -Variable costs for 1 unit of sales So What? Who Cares?
  • 23.
    Fixed Costs (overhead/indirect) Don’t have a direct correlation to sales volume Examples Occupancy Costs Administrative Costs Sales and Marketing Costs Management Costs
  • 24.
    Net Income orLoss The profitability or loss of the company for a specific time period Bottom Line Net Earnings Net Profit Burn Rate Net Income = Revenue – Variable Costs- Fixed Costs
  • 25.
    Breakeven Point $ ofrevenue required to breakeven (no net income or loss) for a specific time period based on assumptions for gross margin % and fixed costs Calculated by Fixed Costs/ Gross Margin % Example: if we had projected fixed costs of $400,000 and a projected gross margin percent of 20%, our breakeven point would be $2 million in revenue
  • 26.
    Company MarsFit Our companystarted selling a fitness tracker in 2015 2015: shipped 10,000 units at $55/each through online channel & 5,000 units at $40 each to distributors 2015: further confirmed orders from distributors of an additional 2,000 units at $40 each that shipped Jan 2016 The trackers were manufactured in China at a total cost of $23/unit Freight, duty and brokerage costs were $2/ unit We bought 20,000 units during the year Rent & occupancy costs: $80,000 Sales & marketing: $200,000 Admin costs: $75,000 Personnel costs: $260,000
  • 27.
    1. What wasour topline in 2015? 2. What was our cost of goods sold? 3. What is our gross margin? 4. What is our gross margin %? 5. What is our net profit or loss? 6. What is our burn rate per month? 7. What would our breakeven point be in 2016 if our gross margin % and fixed costs didn't change? Questions
  • 28.
    • $550,000 ($55x 10,000 units) online channel $200,000 ($40 x 5,000 units) distribution channel • The 2,000 units not shipped until 2016 won’t be revenue until 2016 Total revenue is $750,000 ($550,000 + $200,000) 1) Topline (Revenue) 2015: shipped 10,000 units at $55/each through online channel & 5,000 units at $40 each to distributors 2015: further confirmed orders from distributors of an additional 2,000 units at $40 each that shipped Jan 2016
  • 29.
    2) Cost ofGoods Sold (COGS) • Variable costs equal our landed cost in this case • Landed cost per unit $25 ($23 product cost + $2 freight) • Sold 15,000 units (10,000 online + 5,000 distributors) Our COGS is $375,000 ($25 cost per unit X 15,000 units sold) Annual purchases don't matter, how many sold determines variable cost The trackers were manufactured in China at a total cost of $23/unit Freight, duty and brokerage costs were $2/ unit
  • 30.
    3) Gross Margin Grossmargin is $375,000 • Revenue of $750,000 – COGS of $375,000 = Gross margin of $375,000
  • 31.
    4) Gross MarginPercent Gross Margin Percent is 50% • Gross margin of $375,000 Revenue of $750,000
  • 32.
    5) Profit orLoss Fixed Costs are $615,000 • $80K + $200K + $75K +260K Loss for 2015 $240,000 • $375,000 gross margin - $615,000 in fixed costs
  • 33.
    6) Burn Rate Monthlyburn rate is $20,000 • $240,000 loss divided by 12 months So What? Who Cares?
  • 34.
    7) Break EvenPoint 2016 break event point: • Expected gross margin percent of 50% • Expected fixed costs of $615,000 ($615,000 divided by 50%) = $1,230,000 revenue
  • 35.
    A snapshot ata point in time of a company’s assets, liabilities and shareholder’s equity Assets = Liabilities + Equity Balance Sheet
  • 36.
    Assets • What acompany owns Cash Account receivable Inventory Equipment (capital assets)
  • 37.
    Liabilities • What acompany owes Accounts payable HST payable Debt financing
  • 38.
    Equity • What shareholdershave left of their investment if the company were to sell after all debts are paid Equity = Share investments + Plus accumulated profits or –minus accumulated losses - Less dividends paid to shareholders
  • 39.
    MarsFit Example • Shareholdershad initially invested $500,000 in common shares • Customers are fully paid up • $40,000 still owed to suppliers
  • 40.
    • Assets Cash $175,000 (investment-losses- inventory + not yet paid for that inventory) Inventory $125,000 (5,000 units unsold at $25 landed cost) • Total Assets $300,000 • Liabilities Accounts Payable $40,000 (still owing to suppliers) • Shareholders’ Equity Share Investment $500,000 Accumulated Losses (Deficit) ($240,000) Total Shareholders’ Equity $260,000 • Total liabilities plus equity $300,000 Balance Sheet
  • 41.
    • All businessesare different • Key to understanding what levers to push to improve your results and meet your milestones • Dashboard So What? Who Cares? Understanding Your Key Metrics
  • 42.
    Customer Acquisition Costs Thecost of acquiring each customer Total marketing costs + marketing personnel costs + onboarding #new customers generated for a period of time • Compared with Customer Lifetime Value (CLV) to assess viability of business (CLV divided by CAC) • CAC payback period – The time period when our gross margin we get from customers will their customer acquisition cost
  • 43.
    Customer Lifetime Value Simplecalculation • (g) Gross margin % per customer • (r) Average monthly or annual revenue per customer • (l) Average customer lifespan in months or years Calculation CLV = g X r X l
  • 44.
    MarsFit Subscription • Wespend $100,000 on marketing and $100,000 on marketing personnel • We get 2,000 new customers • We have a – 30% gross margin % – Average monthly revenue per customer of $40 – And an average customer lifespan of 16 months
  • 45.
    Questions 1.What is ourCAC? 2.What is our CAC payback period? 3.What is our simple CLV? 4.What is our ratio of CLV to CAC?
  • 46.
    Calculations 1. Our CACis $100 ($200,000 in marketing and sales costs divided by 2,000 new customers) 2. Our CAC payback period is 8 1/3 months ($100 CAC divided by $12 (30% of $40) margin per customer per month) 3. Our simple CLV is $192 (30% X $40 X 16 months) 4. Our CLV to CAC ratio is 1.92 to 1 ($192 divided by $100) Best practices for SaaS businesses seems to be 3 to 1
  • 47.
  • 48.
    Projecting Cash Flow •Basis for cash flow projection =Income statement projection • Timing funds received and paying government remittances and suppliers • Inventory timing if you sell goods • Capital asset needs (equipment, leaseholds)
  • 49.
    Consistent Soft Factors •Team • Product • Market • Fit Evaluated by traditional debt and VC investors Evaluating Your Business
  • 50.
    Why? • Bootstrapped thecompany, want to retain equity ownership, time to market not as important Security Concern • Loan recovery if business fails (assets of the corporation, guarantees by shareholders, guarantees by friends and family of shareholders) Traditional Debt Financing
  • 51.
    • Debt toequity ratio • Total amounts owed divided by total shareholders’ equity • Debt service coverage ratio- does the company have enough cash flow to repay the annual loan payments and the interest Traditional Debt- Lending Ratios
  • 52.
    Venture Capital Financing Why? •Unable to bootstrap the company, importance of time to market, quick growth translating to quick increase in value • Convertible debt • Financing round (Seed, Series A, etc) – trade equity (shares- participation in decision making and future value) for funding, meet milestones to get to the next round of financing
  • 53.

Editor's Notes

  • #3 Learn key financial terms and what they mean to you and your business Understand your corporate obligations and the importance of keeping organized records
  • #4 Full service online accounting, tax and planning for your small business Online accounting firm and sister firm of RLB LLP Disrupt the industry Technology is eating the world Manage your books and government remittances Provide financial reporting Year-end financial statements Tax returns Business planning
  • #5 Dave Managing partner of RLB for the last 10 years Co-founder of a Tech hardware integrator Founder and Client Experience Officer of Amplify LLP Client focus on planning (tax, financial, strategic, management) Kyle Client Onboarding Officer at Amplify LLP Leanne Katie Director of Business Development at RLB and Amplify LLP Entrepreneurial background with multiple businesses Finance and lending 10 years of experience in evaluating financing for businesses
  • #8 Separte business and personal accounts Helps maintain good records by using the bank accounts to build/ confirm records from your receipts Avoid surprises by seeing the flow of business funds
  • #9 Document ALL Loans If the loans are from someone other than the shareholder the loan needs to bear interest Unfavourable tax result if money is loaned informally from a non- participating spouse or family member Shareholder agreements should be in place Employment contracts should be in place if there is an employee/ self employment scenario Subscription for shares must be paid
  • #10 Document ALL Loans If the loans are from someone other than the shareholder the loan needs to bear interest Unfavourable tax result if money is loaned informally from a non- participating spouse or family member Shareholder agreements should be in place Employment contracts should be in place if there is an employee/ self employment scenario Subscription for shares must be paid
  • #11 Drawing from the company without declaring/ understanding the source Salary requires withholding tax and T4 Dividends require a resolution and T5 Management fees may require HST to be paid
  • #13 Please elaborate on these
  • #16 Programs like Quickbooks Online make it easy to produce these reports Have standard categories for all types of financial statement items Accessible from any internet connected device, making it easier to monitor and manage Easy to use
  • #17 Program integrates with all of the above
  • #18 Understanding Terms realtive to your business improves you ability to grow and succeed Knowing the terms is only important if you can apply them to you business
  • #19 The scorecard for your company’s results for a period of time Often monthly, quarterly or annually Includes revenues, variable costs, gross margin, fixed costs, and net income or loss The primary building block for cash flow projections
  • #20 The sales of the company for goods delivered or services completed Aka: top line, gross income, run rate (extrapolated), sales Many tech firms are quoting bookings rather than actual revenue
  • #21 Costs that vary in relation to changes in revenue Aka: cost of sales, cost of goods sold, direct costs Landed product cost for companies that sell goods Cost of staffing in companies that sell services Hosting costs for SaaS companies
  • #22 Revenue minus variable costs Gross margin $ = gross margin divided by revenue A 30% gross margin means that for every $1 of revenue you will have $0.30 to cover for your fixed costs and add to profitability
  • #23 Contribution margin is the revenue minus variable costs for 1 unit of sales
  • #24 Don’t have a direct correlation to sales volume Examples include occupancy costs, administrative costs, management costs, sales and marketing costs Fixed costs will vary with large swings in sales volume Generally “stepped” in relation to sales
  • #25 Aka: the bottom line, net earning, net profit, burn rate Revenue less variable costs less fixed costs The profitability or loss of the company for a specific time period
  • #26 The $ of revenue required to breakeven (no net income or loss) for a specific time period based on assumptions for gross margin % and fixed costs Calculated by Fixed Costs/ Gross Margin % Example: if we had projected fixed costs of $400,000 and a projected gross margin percent of 20%, our breakeven point would be $2 Million in revenue
  • #37 Cash Account receivable (outstanding customers balance for goods or services that they have received) Inventory (goods purchased but not resold yet) Equipment (capital assets)
  • #38 Accounts payable (balance outstanding you haven’t paid your suppliers for goods or services you have received) HST payable (HST you have collected on sales but haven’t paid to the government yet) Debt financing (loans that you are required to repay)
  • #44 More complex calculations include varying customer churn/ retention rates, varying margins and annual customer revenue and often include an inflation impact for business with higher retention rates
  • #53 Unable to bootstrap the company, importance of time to market, quick growth translating to quick increase in value Convertible debt- loans that can be converted to equity (shares) at a later date- usually at a future financing round Financing round (Seed, Series A, etc) – trade equity (shares- participation in decision making and future value) for funding, meet milestones to get to the next round of financing