OBJECTIVES
• Antibiogram
• KirbyBauer Disk Diffusion testing.
• Significance of the MIC and the MBC in Susceptibility testing.
• Automation
3.
Introduction
• Testing theeffectiveness of antimicrobial drugs against specific
organisms is important in:
Identifying their spectrum of activity
Determining the therapeutic dosage
4.
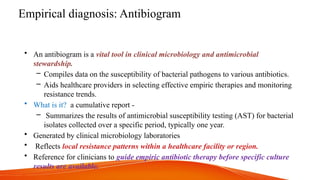
Empirical diagnosis: Antibiogram
•An antibiogram is a vital tool in clinical microbiology and antimicrobial
stewardship.
– Compiles data on the susceptibility of bacterial pathogens to various antibiotics.
– Aids healthcare providers in selecting effective empiric therapies and monitoring
resistance trends.
• What is it? a cumulative report -
– Summarizes the results of antimicrobial susceptibility testing (AST) for bacterial
isolates collected over a specific period, typically one year.
• Generated by clinical microbiology laboratories
• Reflects local resistance patterns within a healthcare facility or region.
• Reference for clinicians to guide empiric antibiotic therapy before specific culture
results are available.
5.
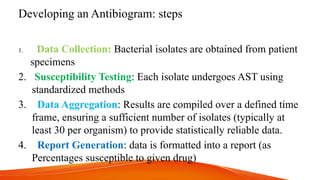
Developing an Antibiogram:steps
1. Data Collection: Bacterial isolates are obtained from patient
specimens
2. Susceptibility Testing: Each isolate undergoes AST using
standardized methods
3. Data Aggregation: Results are compiled over a defined time
frame, ensuring a sufficient number of isolates (typically at
least 30 per organism) to provide statistically reliable data.
4. Report Generation: data is formatted into a report (as
Percentages susceptible to given drug)
6.
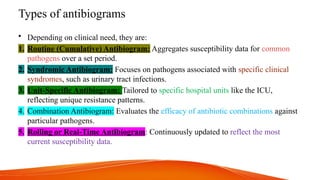
Types of antibiograms
•Depending on clinical need, they are:
1. Routine (Cumulative) Antibiogram: Aggregates susceptibility data for common
pathogens over a set period.
2. Syndromic Antibiogram: Focuses on pathogens associated with specific clinical
syndromes, such as urinary tract infections.
3. Unit-Specific Antibiogram: Tailored to specific hospital units like the ICU,
reflecting unique resistance patterns.
4. Combination Antibiogram: Evaluates the efficacy of antibiotic combinations against
particular pathogens.
5. Rolling or Real-Time Antibiogram: Continuously updated to reflect the most
current susceptibility data.
7.
Clinical Applications
1. GuidingEmpiric Therapy
2. Monitoring Resistance Trends: identify emerging resistance patterns.
3. Informing Stewardship Programs: promoting the judicious use of
antibiotics.
To maximize the impact of antibiograms:
4. Education and Training
5. Integration with Clinical Decision Support Systems
(CDSS):incorporation into health records/HIMS
6. Regular Updates
8.
Limitations
• In resource-limitedenvironments
Developing antibiograms can be challenging due to
constraints like limited laboratory capacity and lack of
standardized protocols.
• However, there is demonstrated feasibility and benefits where
implementation has occured like Gambia and Ghana.
9.
Kirby Bauer DiskDiffusion
• Most commonly used/starting point/been long in use.
• Uses:
– Muller Hinton Agar
• A confluent lawn (uniform, continuous layer) of a pure bacterial
isolate.
– Filter paper disks impregnated with target antibacterial drugs.
• Disks have known amounts of drug.
10.
Kirby Bauer DiskDiffusion...
• Principle:
– Antibiotic diffuses into agar as bacteria grows.
– Antimicrobial activity- observed as a clear circular zone around the
disk (zone of inhibition)
– The diameter of the zone of inhibition, measured in millimeters, and
– Compared to a standardized chart.
– Determines the susceptibility/ resistance.
11.
Factors that determinesize of zone of inhibition
• Drug solubility
• Rate of drug diffusion through agar
• The thickness of the agar medium
• The drug concentration impregnated into the disk
• Limitations
Lack of standardization of these factors-limited information/wrong
interpretation
Inability to distinguish between bacteriostatic and bactericidal
activities
Inability to compare drug potencies or efficacies
12.
Dilution Tests
• Tocounter the inability of disc
diffusion method to determine
doses/assess drug potencies.
• Determines a drug’s MIC and MBC.
The tests include:
Macrobroth Dilution assay
96-well microdilution trays
E-test
Definitions
Minimal inhibitory concentration
(MIC)- the lowest concentration of
drug that inhibits visible bacterial
growth.
Minimal bactericidal concentration
(MBC)- the lowest drug concentration
that kills ≥99.9% of the starting
inoculum.
13.
Dilution Tests...
• Macrobrothdilution assay
• A dilution series of the drug in broth is made in test tubes and equal
amounts of bacterial cells added.
The MIC is determined by examining for turbidity (cloudiness).
• Tubes with no visible growth are then inoculated onto agar media
without antibiotic to determine the MBC.
Generally, serum levels of an antibacterial should be at least three to
five times above the MIC for effective treatment.
14.
Dilution Tests...
• 96-wellmicrodilution trays
• Uses small volumes automated dispensing devices, as well as
the testing of multiple antimicrobials and/or microorganisms in
one tray.
• MICs are interpreted as the lowest concentration that
inhibits visible growth. Growth may also be interpreted
visually or by using a spectrophotometer or similar device to
detect turbidity or a color change .
15.
Etest
• A combinationof the Kirby-Bauer disk diffusion test and
dilution methods.
• Procedure:
• A confluent lawn of a bacterial isolate is inoculated onto the
surface of Muller Hinton agar .
• In place of circular discs, plastic strips that contain a
gradient of an antibacterial are used.
• An elliptical zone of inhibition is observed.
16.
Etest
• To interpretthe results, the intersection of the elliptical zone
with the gradient on the drug-containing strip indicates the
MIC.
• Multiple strips containing different antimicrobials can be
placed on the same plate, the MIC of multiple antimicrobials
can be determined concurrently and directly compared.
Limitation
• MBC cannot be determined with the Etest
17.
Automation in AST
•Advantages
• Standardization-less
errors/minimal
variability.
• Rapid: Reduced TAT
• Data Integration with
LIMS/HIMS
Consideration for implementation
Cost: High Initial investment and
maintenance costs: cost-benefit analyses
are essential.
Training: to operate and maintain
automated systems effectively.
Infrastructure: Adequate laboratory
infrastructure,; space and information
technology support
18.
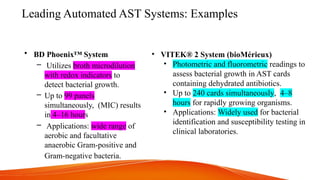
Leading Automated ASTSystems: Examples
• BD Phoenix™ System
– Utilizes broth microdilution
with redox indicators to
detect bacterial growth.
– Up to 99 panels
simultaneously, (MIC) results
in 4–16 hours
– Applications: wide range of
aerobic and facultative
anaerobic Gram-positive and
Gram-negative bacteria.
• VITEK® 2 System (bioMérieux)
• Photometric and fluorometric readings to
assess bacterial growth in AST cards
containing dehydrated antibiotics.
• Up to 240 cards simultaneously, 4–8
hours for rapidly growing organisms.
• Applications: Widely used for bacterial
identification and susceptibility testing in
clinical laboratories.
19.
Leading Automated ASTSystems: Examples...
• MicroScan WalkAway® System
(Beckman Coulter)
– Based on broth microdilution
with colorimetric detection using
fluorogenic substrates.
– 40 to 96-panel modules, MIC
results in 4.5–18 hours,
depending on organism growth
rates.
– Applications: medium to high-
volume laboratories requiring
comprehensive AST capabilities.
• ASTar® System (Q-linea)
• Performs fully automated
microdilution AST directly from
positive blood cultures using time-lapse
imaging and proprietary algorithms.
• MIC results in approximately 6 hours,
enhancing rapid decision-making in
bloodstream infections.
• For rapid phenotypic AST of Gram-
negative rods directly from blood
cultures.
20.
Leading Automated ASTSystems: Examples...
• Accelerate Pheno® System
• Combines rapid
identification with
phenotypic AST using
morphokinetic cellular
analysis.
• MIC results- 7 hours
directly from positive blood
cultures.
• Supports timely
antimicrobial therapy
decisions in critical care
settings.
• Sysmex Astrego System
• Employs proprietary microfluidic
technology for rapid AST.
• Susceptibility results in
approximately 30 minutes, suitable
for point-of-care settings.
• Applications: Aids in the appropriate
use of antimicrobials during initial
patient visits in primary care.
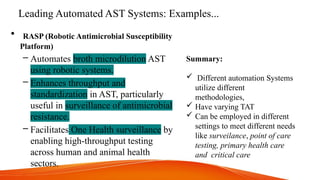
21.
Leading Automated ASTSystems: Examples...
• RASP (Robotic Antimicrobial Susceptibility
Platform)
– Automates broth microdilution AST
using robotic systems.
– Enhances throughput and
standardization in AST, particularly
useful in surveillance of antimicrobial
resistance.
– Facilitates One Health surveillance by
enabling high-throughput testing
across human and animal health
sectors.
Summary:
Different automation Systems
utilize different
methodologies,
Have varying TAT
Can be employed in different
settings to meet different needs
like surveilance, point of care
testing, primary health care
and critical care
22.
References
• Adu-Sarkodie, Y.,Amponsah, J. A., Owusu-Ofori, A., Labi, A. K., &
Opare-Addo, M. (2023). Developing hospital antibiograms to support
antimicrobial stewardship in Ghana. PLOS Global Public Health, 3(4),
e0001480. https://doi.org/10.1371/journal.pgph.0001480
• Saidu, Y., Jarju, S., Ceesay, F., Bah, A. A., & Tapgun, M. (2023). Using
antibiogram data to support antimicrobial stewardship in The Gambia.
IJID Regional, 12, 98–103. https://doi.org/10.1016/j.ijregi.2023.04.006
• Clinical and Laboratory Standards Institute. (2023). Analysis and
presentation of cumulative antimicrobial susceptibility test data (4th ed.)
(CLSI standard M39-A4).
https://clsi.org/standards/products/microbiology/documents/m39/
23.
References
Buehler, S. S.,Madison, B., Snyder, S. R., Derzon, J. H., Cornish, N. E., Saubolle, M.
A., ... & Weissfeld, A. S. (2016). Effectiveness of practices to increase timeliness of
providing targeted therapy for inpatients with bloodstream infections: A laboratory
medicine best practices systematic review and meta-analysis. Clinical Microbiology
Reviews, 29(1), 59–103. https://doi.org/10.1128/CMR.00053-14
Hombach, M., Zbinden, R., & Böttger, E. C. (2012). Standardisation of disk diffusion
results for antibiotic susceptibility testing using the BD Phoenix, VITEK 2 and disk
diffusion system. European Journal of Clinical Microbiology & Infectious Diseases,
31(4), 627–633. https://doi.org/10.1007/s10096-011-1353-4
ABBREVIATIONS
• AST-antimicrobial SusceptibilityTesting
• TAT-Turn Around Time
• LIMS- Laboratory Information Management System
• HIMS- Hospital Information Management System
• ICU- Intensive Care Unit


![Antibiotic assay, sensitivity and chemotherapy [autosaved]](https://cdn.slidesharecdn.com/ss_thumbnails/antibioticassaysensitivityandchemotherapyautosaved-210119212020-thumbnail.jpg?width=640&height=640&fit=bounds)


