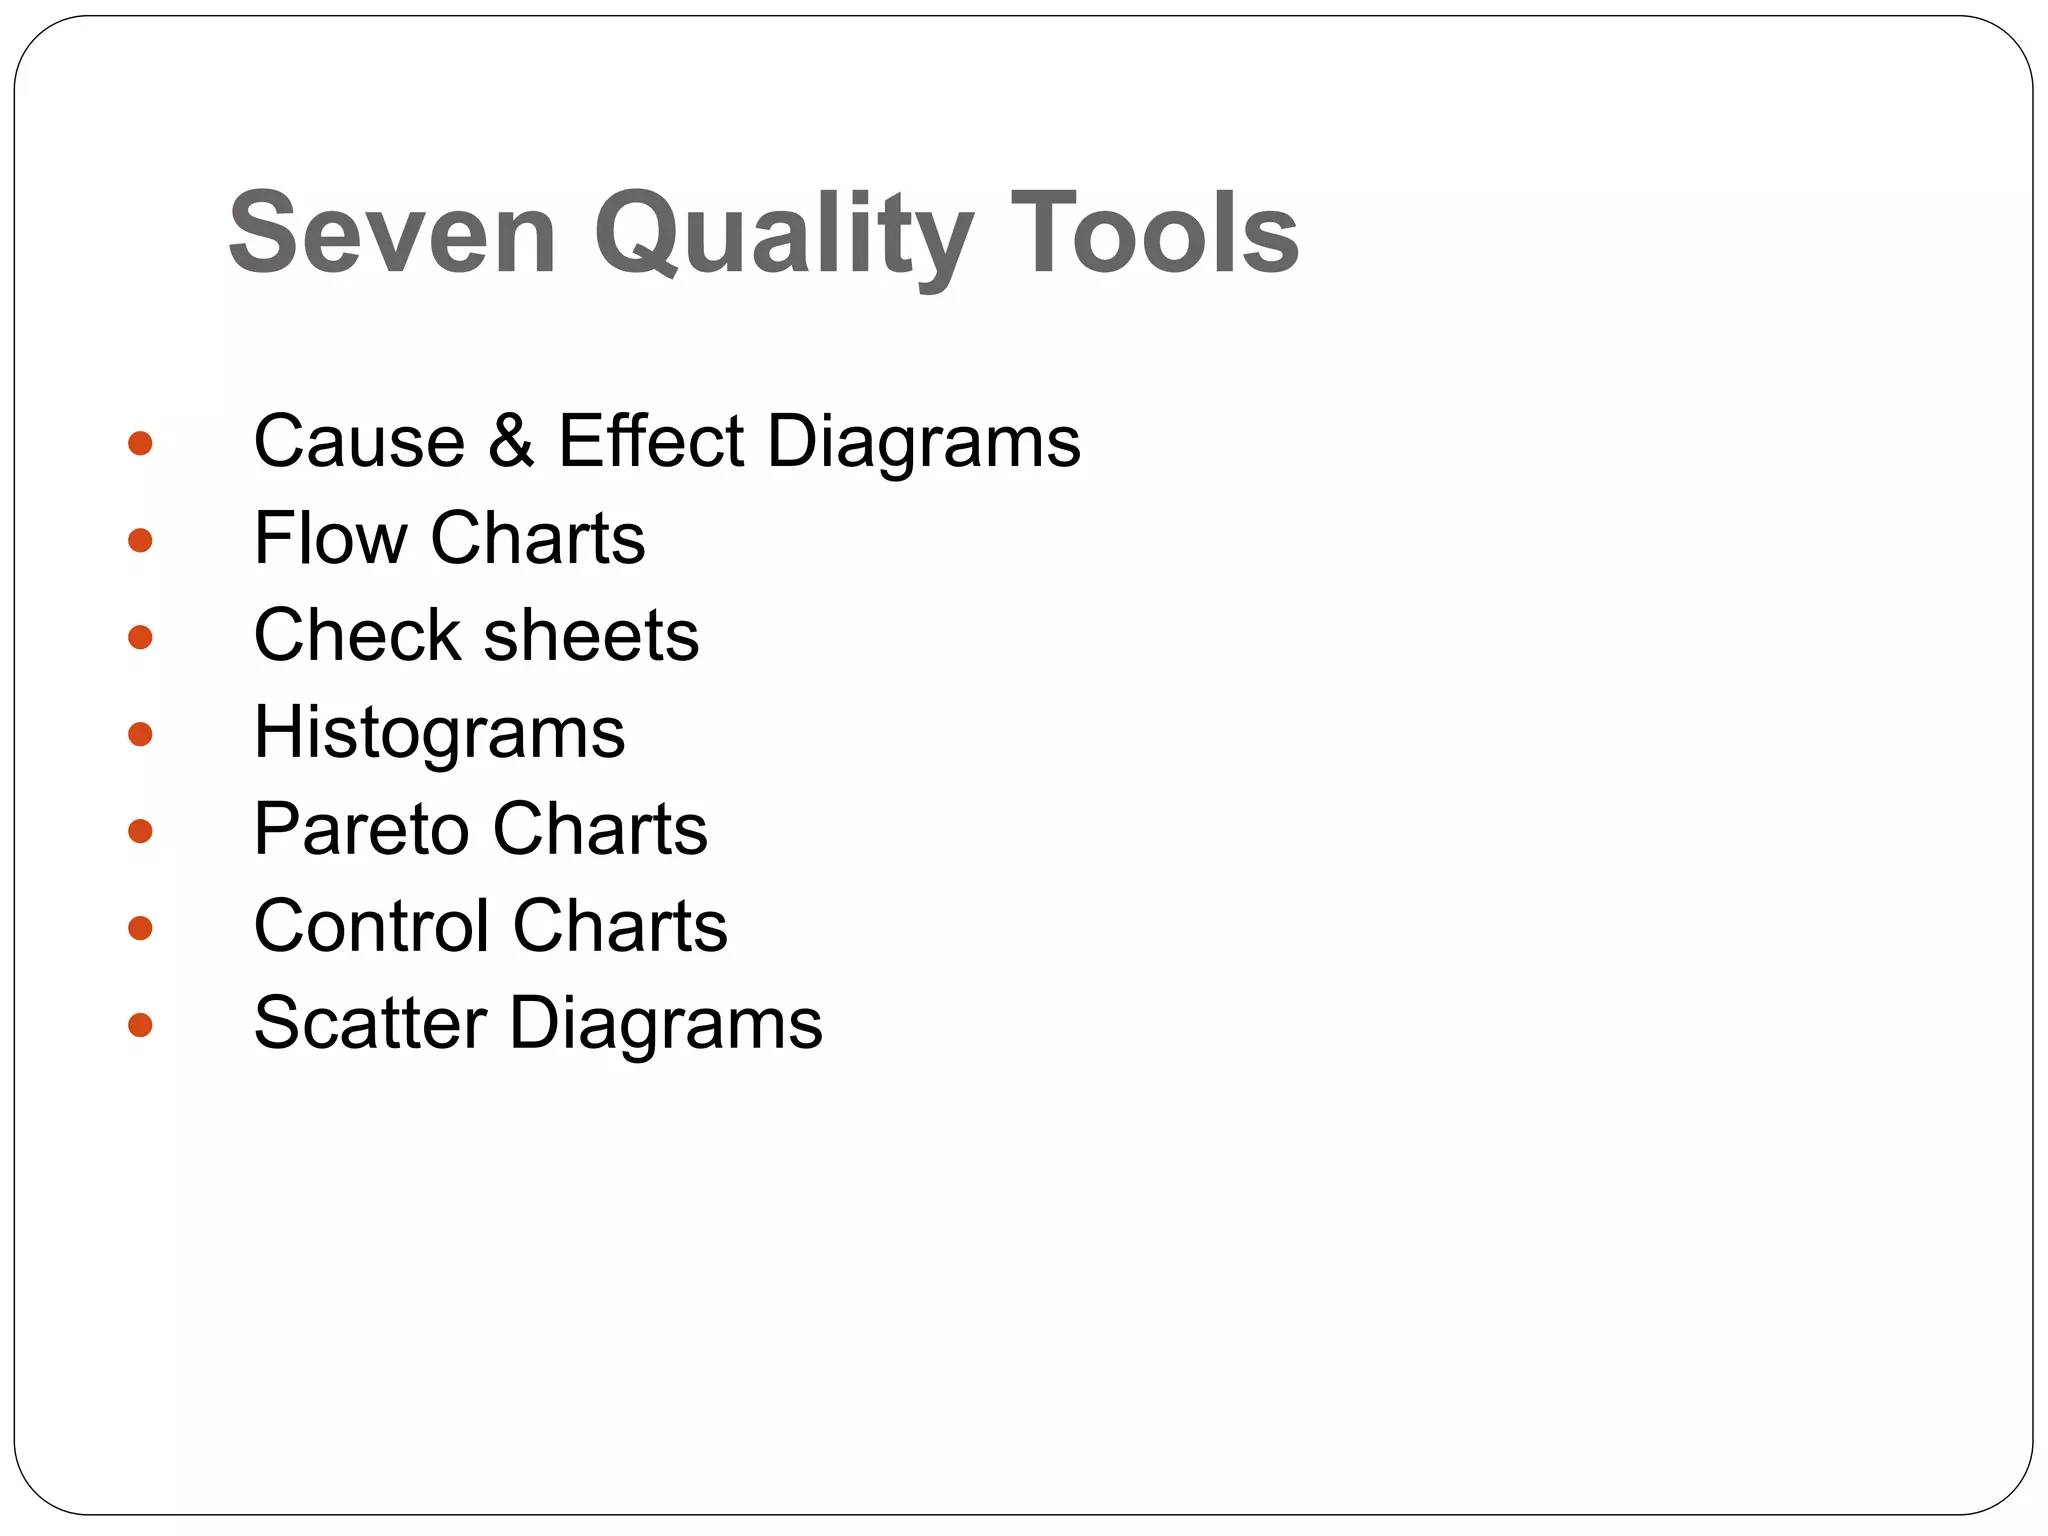
The document discusses quality tools that can be used in small companies to improve quality, decrease costs, and increase productivity. It describes seven tools: cause and effect diagrams, flow charts, check sheets, histograms, Pareto charts, control charts, and scatter diagrams. Each tool is defined, its purpose and benefits are explained, and an example is provided. The tools can help identify problems, collect and analyze data, prioritize issues, understand processes and variations, and determine relationships between factors. Using these tools is part of a six-step problem solving process to recognize, define, investigate, analyze, solve, and confirm issues.


![7 qc tools training material[1]](https://cdn.slidesharecdn.com/ss_thumbnails/7qctoolstrainingmaterial1-120925054558-phpapp02-thumbnail.jpg?width=640&height=640&fit=bounds)


