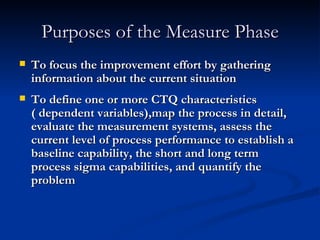
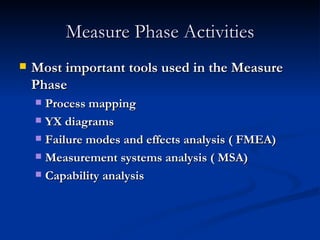
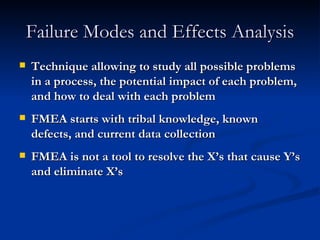
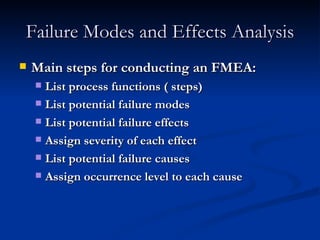
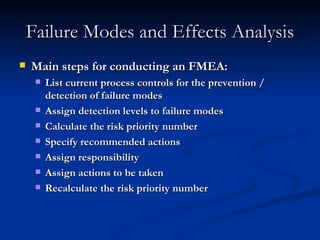
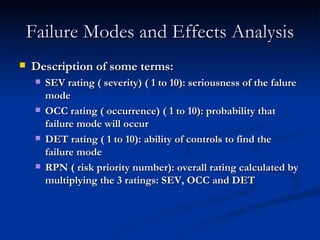
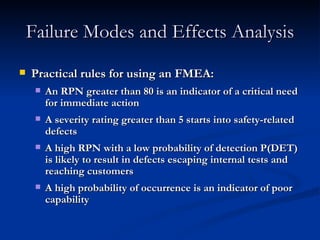
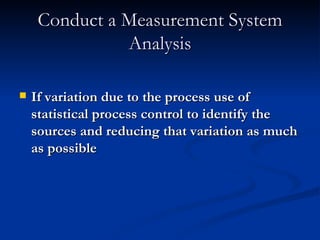
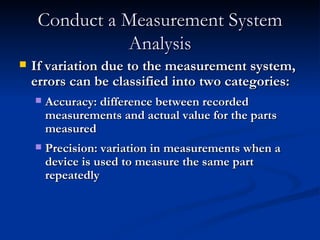
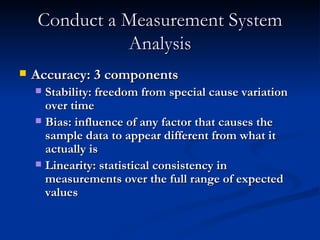
MEASURE PHASE
Purposes of the Measure Phase To focus the improvement effort by gathering information about the current situation To define one or more CTQ characteristics ( dependent variables),map the process in detail, evaluate the measurement systems, assess the current level of process performance to establish a baseline capability, the short and long term process sigma capabilities, and quantify the problem
Measure Phase Activities Most important tools used in the Measure Phase Process mapping YX diagrams Failure modes and effects analysis ( FMEA) Measurement systems analysis ( MSA) Capability analysis
Measure Phase Activities Map the process in detail Process mapping helps a project team do the following: Describe how activities are being done Understand the big picture Identify how, when, or where a process should be measured Investigate where problems might occur Identify where modifications might best be made
Measure Phase Activities Map the process in detail A process map consists of flowcharts of the steps in a process– operations, decision points, delays, movements, handoffs, rework loops, and control or inspections Mapping a process in detail should be an iterative process, as the team learns more about the process
Measure Phase Activities Map the process in detail Process maps must identify forms of waste All wastes are influenced by and related to process bottlenecks and the inability of the process to flow smoothly
Measure Phase Activities A process map is a graphical representation of a process that is used to identify the following: All steps as value-added and non-value added Key process inputs ( X’s) Key process outputs ( Y’s) Data collection points First X’s to put into a FMEA Cycle time per step
Create a YX Matrix Takes information first identified in the process-mapping exercise and then documented through brainstorming methods like the cause and effect diagram  Method for quantifying and prioritizing the strength of the relationships between the input variables( X’s) and the output variables ( Y’s)
Create a YX Matrix Helps start thinking analytically about the process and facilitates buy-in for the solutions later Key success factor in the use of the tool: team make-up
Create a YX Matrix Steps for creating a YX diagram: 1- Call a team meeting and introduce the concepts of the YX diagram and assemble the list of potential X’s from the 3 sources: process mapping, brainstorming and preliminary data analysis 2- Enter the process name and revision date in the matrix information section
Create a YX Matrix Steps for creating a YX diagram: 3- Enter the Y’s deemed important by the team and/or customer 4- Score each Y from 1 to 10 5- Enter all potential X’s felt to impact Y 6- Score the impact of each X on each Y 7- Analyze the results
Create a YX Matrix YX Diagram: Priority compass to indicate where to start looking for the practical factors causing the defect
Failure Modes and Effects Analysis Technique allowing to study all possible problems in a process, the potential impact of each problem, and how to deal with each problem FMEA starts with tribal knowledge, known defects, and current data collection FMEA is not a tool to resolve the X’s that cause Y’s and eliminate X’s
Failure Modes and Effects Analysis Main steps for conducting an FMEA: List process functions ( steps) List potential failure modes List potential failure effects Assign severity of each effect List potential failure causes Assign occurrence level to each cause
Failure Modes and Effects Analysis Main steps for conducting an FMEA: List current process controls for the prevention / detection of failure modes Assign detection levels to failure modes Calculate the risk priority number Specify recommended actions Assign responsibility Assign actions to be taken Recalculate the risk priority number
Failure Modes and Effects Analysis Description of some terms: SEV rating ( severity) ( 1 to 10): seriousness of the falure mode OCC rating ( occurrence) ( 1 to 10): probability that failure mode will occur DET rating ( 1 to 10): ability of controls to find the failure mode RPN ( risk priority number): overall rating calculated by multiplying the 3 ratings: SEV, OCC and DET
Failure Modes and Effects Analysis Practical rules for using an FMEA: An RPN greater than 80 is an indicator of a critical need for immediate action A severity rating greater than 5 starts into safety-related defects A high RPN with a low probability of detection P(DET) is likely to result in defects escaping internal tests and reaching customers A high probability of occurrence is an indicator of poor capability
Conduct a Measurement System Analysis If variation due to the process use of statistical process control to identify the sources and reducing that variation as much as possible
Conduct a Measurement System Analysis If variation due to the measurement system, errors can be classified into two categories: Accuracy: difference between recorded measurements and actual value for the parts measured Precision: variation in measurements when a device is used to measure the same part repeatedly
Conduct a Measurement System Analysis Accuracy: 3 components Stability: freedom from special cause variation over time Bias: influence of any factor that causes the sample data to appear different from what it actually is Linearity: statistical consistency in measurements over the full range of expected values
Conduct a Measurement System Analysis Precision: 2 components Reproducibility: variation due to the measurement system Repeatability: variation due to the measuring device
Conduct a Measurement System Analysis Reproducibility and repeatability are the object of a specific study called a gauge repeatability and reproducibility study Can be performed on both attribute-based and variable-based measurement systems Attributes data: fit into categories that can be described in terms of words ( such as good or bad, pass or fail,..) and counted Variables data: quantitative data consisting of discrete data that are counted and continuous data that are on a continuum, usually in decimal form
Determine the process capability Determine whether a process, given its natural short term variation, has the potential long term capability to meet established customer requirements or specifications A short term capability study covers a relatively short period of time and consists of 30 to 50 data points It measures the potential ( short term) capability of the process This method of estimating sigma considers the variation within a subgroup Does not consider the shift and drift between or among subgroups
Determine the process capability A long term capability study covers a relatively long period of time and consists of 100-200 data points Measures the actual ( long term) capability of the process Total standard deviation says to estimate sigma considering the variation both within and between or among subgroups
Determine the process capability A subgroup is a logical grouping of objects or events that displays only random event-to-event variations The objects or events are grouped to create homogenous groups free of assignable or special causes By virtue of the minimum within-group variability, any change in the central tendency or variance of the universe will be reflected inthe subgroup-to-subgroup variability
Conduct the Measure Phase- Gate Review The black belt reports to the executive team on the status of the project To prepare for the review, the black belt and the champion should meet to discuss questions such as the following: What is the main problem? How have you selected critical measures? In what ways have you validated the measurement system? What is the current process capability?

Measure Phase

  • 1.
  • 2.
    Purposes of theMeasure Phase To focus the improvement effort by gathering information about the current situation To define one or more CTQ characteristics ( dependent variables),map the process in detail, evaluate the measurement systems, assess the current level of process performance to establish a baseline capability, the short and long term process sigma capabilities, and quantify the problem
  • 3.
    Measure Phase ActivitiesMost important tools used in the Measure Phase Process mapping YX diagrams Failure modes and effects analysis ( FMEA) Measurement systems analysis ( MSA) Capability analysis
  • 4.
    Measure Phase ActivitiesMap the process in detail Process mapping helps a project team do the following: Describe how activities are being done Understand the big picture Identify how, when, or where a process should be measured Investigate where problems might occur Identify where modifications might best be made
  • 5.
    Measure Phase ActivitiesMap the process in detail A process map consists of flowcharts of the steps in a process– operations, decision points, delays, movements, handoffs, rework loops, and control or inspections Mapping a process in detail should be an iterative process, as the team learns more about the process
  • 6.
    Measure Phase ActivitiesMap the process in detail Process maps must identify forms of waste All wastes are influenced by and related to process bottlenecks and the inability of the process to flow smoothly
  • 7.
    Measure Phase ActivitiesA process map is a graphical representation of a process that is used to identify the following: All steps as value-added and non-value added Key process inputs ( X’s) Key process outputs ( Y’s) Data collection points First X’s to put into a FMEA Cycle time per step
  • 8.
    Create a YXMatrix Takes information first identified in the process-mapping exercise and then documented through brainstorming methods like the cause and effect diagram Method for quantifying and prioritizing the strength of the relationships between the input variables( X’s) and the output variables ( Y’s)
  • 9.
    Create a YXMatrix Helps start thinking analytically about the process and facilitates buy-in for the solutions later Key success factor in the use of the tool: team make-up
  • 10.
    Create a YXMatrix Steps for creating a YX diagram: 1- Call a team meeting and introduce the concepts of the YX diagram and assemble the list of potential X’s from the 3 sources: process mapping, brainstorming and preliminary data analysis 2- Enter the process name and revision date in the matrix information section
  • 11.
    Create a YXMatrix Steps for creating a YX diagram: 3- Enter the Y’s deemed important by the team and/or customer 4- Score each Y from 1 to 10 5- Enter all potential X’s felt to impact Y 6- Score the impact of each X on each Y 7- Analyze the results
  • 12.
    Create a YXMatrix YX Diagram: Priority compass to indicate where to start looking for the practical factors causing the defect
  • 13.
    Failure Modes andEffects Analysis Technique allowing to study all possible problems in a process, the potential impact of each problem, and how to deal with each problem FMEA starts with tribal knowledge, known defects, and current data collection FMEA is not a tool to resolve the X’s that cause Y’s and eliminate X’s
  • 14.
    Failure Modes andEffects Analysis Main steps for conducting an FMEA: List process functions ( steps) List potential failure modes List potential failure effects Assign severity of each effect List potential failure causes Assign occurrence level to each cause
  • 15.
    Failure Modes andEffects Analysis Main steps for conducting an FMEA: List current process controls for the prevention / detection of failure modes Assign detection levels to failure modes Calculate the risk priority number Specify recommended actions Assign responsibility Assign actions to be taken Recalculate the risk priority number
  • 16.
    Failure Modes andEffects Analysis Description of some terms: SEV rating ( severity) ( 1 to 10): seriousness of the falure mode OCC rating ( occurrence) ( 1 to 10): probability that failure mode will occur DET rating ( 1 to 10): ability of controls to find the failure mode RPN ( risk priority number): overall rating calculated by multiplying the 3 ratings: SEV, OCC and DET
  • 17.
    Failure Modes andEffects Analysis Practical rules for using an FMEA: An RPN greater than 80 is an indicator of a critical need for immediate action A severity rating greater than 5 starts into safety-related defects A high RPN with a low probability of detection P(DET) is likely to result in defects escaping internal tests and reaching customers A high probability of occurrence is an indicator of poor capability
  • 18.
    Conduct a MeasurementSystem Analysis If variation due to the process use of statistical process control to identify the sources and reducing that variation as much as possible
  • 19.
    Conduct a MeasurementSystem Analysis If variation due to the measurement system, errors can be classified into two categories: Accuracy: difference between recorded measurements and actual value for the parts measured Precision: variation in measurements when a device is used to measure the same part repeatedly
  • 20.
    Conduct a MeasurementSystem Analysis Accuracy: 3 components Stability: freedom from special cause variation over time Bias: influence of any factor that causes the sample data to appear different from what it actually is Linearity: statistical consistency in measurements over the full range of expected values
  • 21.
    Conduct a MeasurementSystem Analysis Precision: 2 components Reproducibility: variation due to the measurement system Repeatability: variation due to the measuring device
  • 22.
    Conduct a MeasurementSystem Analysis Reproducibility and repeatability are the object of a specific study called a gauge repeatability and reproducibility study Can be performed on both attribute-based and variable-based measurement systems Attributes data: fit into categories that can be described in terms of words ( such as good or bad, pass or fail,..) and counted Variables data: quantitative data consisting of discrete data that are counted and continuous data that are on a continuum, usually in decimal form
  • 23.
    Determine the processcapability Determine whether a process, given its natural short term variation, has the potential long term capability to meet established customer requirements or specifications A short term capability study covers a relatively short period of time and consists of 30 to 50 data points It measures the potential ( short term) capability of the process This method of estimating sigma considers the variation within a subgroup Does not consider the shift and drift between or among subgroups
  • 24.
    Determine the processcapability A long term capability study covers a relatively long period of time and consists of 100-200 data points Measures the actual ( long term) capability of the process Total standard deviation says to estimate sigma considering the variation both within and between or among subgroups
  • 25.
    Determine the processcapability A subgroup is a logical grouping of objects or events that displays only random event-to-event variations The objects or events are grouped to create homogenous groups free of assignable or special causes By virtue of the minimum within-group variability, any change in the central tendency or variance of the universe will be reflected inthe subgroup-to-subgroup variability
  • 26.
    Conduct the MeasurePhase- Gate Review The black belt reports to the executive team on the status of the project To prepare for the review, the black belt and the champion should meet to discuss questions such as the following: What is the main problem? How have you selected critical measures? In what ways have you validated the measurement system? What is the current process capability?