Downloaded 115 times
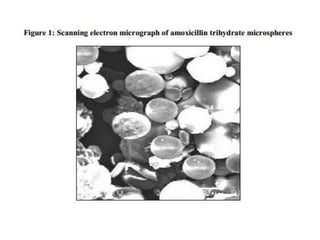
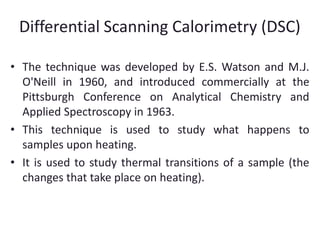
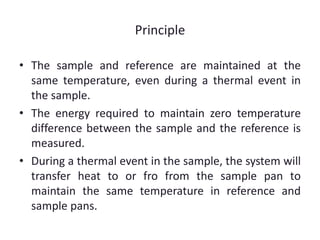
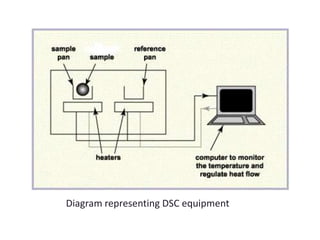
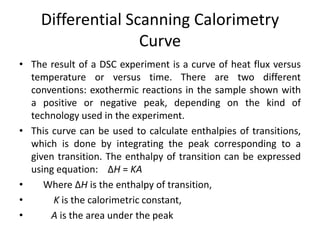
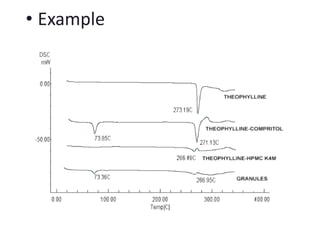

This document discusses various pre-formulation studies including analytical methods used to characterize drug substances and formulations. It describes techniques such as microscopy, differential scanning calorimetry (DSC), powder X-ray diffraction (PXRD), and thermogravimetric analysis (TGA) that are used to investigate the physical and chemical properties of drugs and excipients alone and in combination. Specific application and procedures for each technique are provided with examples.