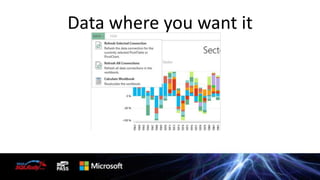
Analysing your Data with Power View
Data Visualisation and Power View
We have the tools. All we’ve got to
do is imagine what could be.
We can reinvent the present;
we can transform the world around us.

Jason Silva
Computers have
promised us a fountain
of wisdom but delivered
a flood of data
(Frawley, 1992)
• Almost 50% of your brain is
dedicated to visual
processing.
•

David van Essen

Researchers found that colour visuals
increase the willingness to read by

80%

About 70% of your
sensory receptors are in your
eyes.
Data Visualisation and Power View
• 3D
• Pie Charts
• Colours
Data Visualisation and Power View
• Power View does not contain 3D functionality – why?
• People can overestimate the vertical dimension (Wansink, 2003)
• 3D space makes it too difficult to compare
– Values
– Volumes
– Areas

• Distorts
Pie Charts and Power View
–
–
–
–

We find it difficult to read angles
We find it difficult to judge areas
We can’t easily read over 5 slices very well
Each part must be mutually exclusive
Pie Charts – the Verdict!
• You can compare combinations of adjacent wedges
• The parts should make a sensible whole
• You’re just expecting the image to answer one ‘business
question’ only
• You do not need trendlines
Pie Charts
Pie Charts
Pie Charts
Pie Charts
Pie Charts
Trellis Charts
Trellis Charts
Self-Service

Insights
Actions
Different Tools for Different Jobs
Power View
•

Highly Visual Design Experience

•

Power View is an interactive, ad hoc, query and
visualization experience.
It is for business question ‘mystery’ solving

•

Power Map

•

Power Map is a new 3D visualization add-in for
Excel helping you to analyse geographical and
temporal data

– Mapping
– Exploring
– Interacting
Data where you want it
Motion Charts
•
•
•
•
•

This makes even more of the limited space
We can pack more information in
Data / Ink Ratio
Motion is a pre-attentive attribute
Dependent on other items e.g. chartjunk
THANK YOU!
• For attending this session and
PASS SQLRally Nordic 2013, Stockholm

Analysing your data with power view

  • 2.
    Analysing your Datawith Power View
  • 3.
    Data Visualisation andPower View We have the tools. All we’ve got to do is imagine what could be. We can reinvent the present; we can transform the world around us. Jason Silva
  • 4.
    Computers have promised usa fountain of wisdom but delivered a flood of data (Frawley, 1992)
  • 5.
    • Almost 50%of your brain is dedicated to visual processing. • David van Essen Researchers found that colour visuals increase the willingness to read by 80% About 70% of your sensory receptors are in your eyes.
  • 6.
    Data Visualisation andPower View • 3D • Pie Charts • Colours
  • 7.
    Data Visualisation andPower View • Power View does not contain 3D functionality – why? • People can overestimate the vertical dimension (Wansink, 2003) • 3D space makes it too difficult to compare – Values – Volumes – Areas • Distorts
  • 8.
    Pie Charts andPower View – – – – We find it difficult to read angles We find it difficult to judge areas We can’t easily read over 5 slices very well Each part must be mutually exclusive
  • 9.
    Pie Charts –the Verdict! • You can compare combinations of adjacent wedges • The parts should make a sensible whole • You’re just expecting the image to answer one ‘business question’ only • You do not need trendlines
  • 10.
  • 11.
  • 12.
  • 13.
  • 14.
  • 15.
  • 16.
  • 18.
  • 19.
    Different Tools forDifferent Jobs Power View • Highly Visual Design Experience • Power View is an interactive, ad hoc, query and visualization experience. It is for business question ‘mystery’ solving • Power Map • Power Map is a new 3D visualization add-in for Excel helping you to analyse geographical and temporal data – Mapping – Exploring – Interacting
  • 20.
  • 21.
  • 22.
  • 23.
  • 24.
    Motion Charts • • • • • This makeseven more of the limited space We can pack more information in Data / Ink Ratio Motion is a pre-attentive attribute Dependent on other items e.g. chartjunk
  • 25.
    THANK YOU! • Forattending this session and PASS SQLRally Nordic 2013, Stockholm

Editor's Notes

  • #18 © David McCandless / InformationIsBeautiful.netGuardian on November 7, 2009Commentary by Stephen Few http://www.perceptualedge.com/blog/?p=1030Which represents a larger amount: Mortgage Lending 2007 or NHS?How much greater is Mortgage Lending 2007 than State Pensions?Does State Pensions compared with Tesco Revenue look like the difference between 62 and 59, or much greater?Which is bigger: Income Support or Police?
  • #19 © David McCandless / InformationIsBeautiful.netGuardian on November 7, 2009Commentary by Stephen Few http://www.perceptualedge.com/blog/?p=1030Which represents a larger amount: Mortgage Lending 2007 or NHS?How much greater is Mortgage Lending 2007 than State Pensions?Does State Pensions compared with Tesco Revenue look like the difference between 62 and 59, or much greater?Which is bigger: Income Support or Police?
  • #20 © David McCandless / InformationIsBeautiful.netGuardian on November 7, 2009Commentary by Stephen Few http://www.perceptualedge.com/blog/?p=1030Which represents a larger amount: Mortgage Lending 2007 or NHS?How much greater is Mortgage Lending 2007 than State Pensions?Does State Pensions compared with Tesco Revenue look like the difference between 62 and 59, or much greater?Which is bigger: Income Support or Police?
  • #21 © David McCandless / InformationIsBeautiful.netGuardian on November 7, 2009Commentary by Stephen Few http://www.perceptualedge.com/blog/?p=1030Which represents a larger amount: Mortgage Lending 2007 or NHS?How much greater is Mortgage Lending 2007 than State Pensions?Does State Pensions compared with Tesco Revenue look like the difference between 62 and 59, or much greater?Which is bigger: Income Support or Police?
  • #22 © David McCandless / InformationIsBeautiful.netGuardian on November 7, 2009Commentary by Stephen Few http://www.perceptualedge.com/blog/?p=1030Which represents a larger amount: Mortgage Lending 2007 or NHS?How much greater is Mortgage Lending 2007 than State Pensions?Does State Pensions compared with Tesco Revenue look like the difference between 62 and 59, or much greater?Which is bigger: Income Support or Police?
  • #23 © David McCandless / InformationIsBeautiful.netGuardian on November 7, 2009Commentary by Stephen Few http://www.perceptualedge.com/blog/?p=1030Which represents a larger amount: Mortgage Lending 2007 or NHS?How much greater is Mortgage Lending 2007 than State Pensions?Does State Pensions compared with Tesco Revenue look like the difference between 62 and 59, or much greater?Which is bigger: Income Support or Police?
  • #24 © David McCandless / InformationIsBeautiful.netGuardian on November 7, 2009Commentary by Stephen Few http://www.perceptualedge.com/blog/?p=1030Which represents a larger amount: Mortgage Lending 2007 or NHS?How much greater is Mortgage Lending 2007 than State Pensions?Does State Pensions compared with Tesco Revenue look like the difference between 62 and 59, or much greater?Which is bigger: Income Support or Police?
  • #25 don’t mix blinking with motion = chartjunk