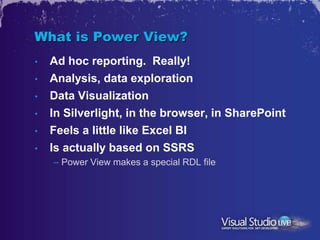
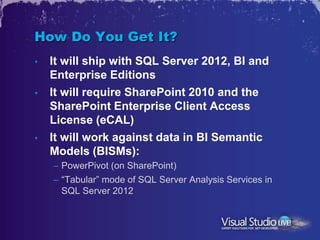
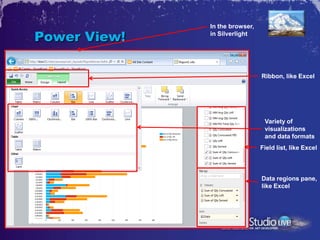
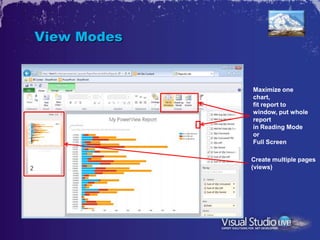
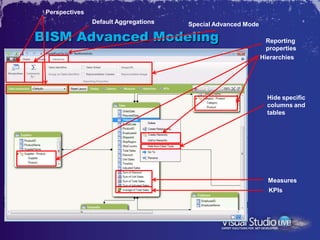
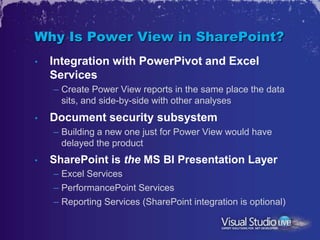
Power View: Analysis and Visualization
           for Your Application’s Data
                         Andrew J. Brust
                           Founder and CEO


                             Level: Intermediate
Meet Andrew
 •   CEO and Founder, Blue Badge Insights
 •   Big Data blogger for ZDNet
 •   Microsoft Regional Director, MVP
 •   Co-chair VSLive! and 17 years as a speaker
 •   Founder, Microsoft BI User Group of NYC
     – http://www.msbinyc.com
 •   Co-moderator, NYC .NET Developers Group
     – http://www.nycdotnetdev.com
 •   “Redmond Review” columnist for
     Visual Studio Magazine and Redmond Developer
     News
 •   brustblog.com, Twitter: @andrewbrust
My New Blog (bit.ly/bigondata)
Read All About It!
Agenda
•   Intro
•   Basic Use
•   Data Acquisition
•   Filtering
•   Advanced Visualizations
•   Advanced Features
What is Power View?
•   Ad hoc reporting. Really!
•   Analysis, data exploration
•   Data Visualization
•   In Silverlight, in the browser, in SharePoint
•   Feels a little like Excel BI
•   Is actually based on SSRS
    – Power View makes a special RDL file
How Do You Get It?
•   It will ship with SQL Server 2012, BI and
    Enterprise Editions
•   It will require SharePoint 2010 and the
    SharePoint Enterprise Client Access
    License (eCAL)
•   It will work against data in BI Semantic
    Models (BISMs):
    – PowerPivot (on SharePoint)
    – “Tabular” mode of SQL Server Analysis Services in
      SQL Server 2012
In the browser,

Power View!   in Silverlight


                                Ribbon, like Excel


                                 Variety of
                                 visualizations
                                 and data formats
                                Field list, like Excel


                                Data regions pane,
                                like Excel
View Modes


             Maximize one
             chart,
             fit report to
             window, put whole
             report
             in Reading Mode
             or
             Full Screen

             Create multiple pages
             (views)
Power View Basics
BISM: A Column-Oriented Store
•   Imagine, instead of:
     Employee ID        Age        Income
     1                  43         90000
     2                  38         100000
     3                  35         100000
•   You have:
     Employee ID    1         2             3
     Age            43        38            35
     Income         90000     100000        100000

•   Perf: values you wish to aggregate are adjacent
•   Efficiency: great compression from identical or nearly-
    identical values in proximity
•   Fast aggregation and high compression means huge volumes
    of data can be stored and processed, in RAM
Data Import
•   Relational databases
    – SQL Server (including SQL Azure!), Access
    – Oracle, DB2, Sybase, Informix
    – Teradata
    – “Others” (OLE DB, including OLE DB provider for ODBC)
•   OData feeds, incl. R2/Denali Reporting Services,
    SharePoint 2010 lists, Azure DataMarket,
    ADO.NET Data Services (Astoria)
•   Excel via clipboard, linked tables
•   Filter, preview, friendly names for
    tables/columns
DirectQuery Mode
•   In DQ mode,
    model defines
    schema, but is not
    used for data
•   Queries issued
    directly against
    source
•   Similar to ROLAP
    storage for
    conventional
    SSAS cubes
Creating a SharePoint Power View
Data Source
•   To repeat: Power View works only against
    PowerPivot/SSAS tabular models
    – DirectQuery mode supported, however
•   For PowerPivot, click “Create Power View
    Report” button or option on workbook in
    SharePoint report gallery
•   For SSAS tabular model, create BISM data
    source, then click its “Create Power View
    Report” button or option
    – BISM data sources can point to PowerPivot
      workbooks too, if you want.
Power View Data
Acquisition
Constraining Your Data In
Power View
•   Tiles
    – A filtering mechanism within a visualization
•   Highlighting
    – Selection in one visualization affects the others
•   Slicers
    – Similar to Excel against PowerPivot
•   True Filters
    – Checked drop-down list; very Excel-like
    – Right-hand filter pane, similar to SSRS and Excel
      Services
Power View Filtering
Multipliers
•   Multiple charts within a chart, in columns,
    rows, or a matrix
    – Horizontal and vertical multipliers
•   Allows for visualizing 1 or 2 additional
    dimensions
Scatter/Bubble Charts
•   Allow for several measures
•   Features a “play” axis which can be
    manipulated through a slider or animated
•   Excellent way to visualize trends over time
Power View Advanced
Visualizations
Perspectives
                Default Aggregations   Special Advanced Mode

BISM Advanced Modeling                                           Reporting
                                                                 properties
                                                               Hierarchies


                                                                 Hide specific
                                                                 columns and
                                                                 tables


                                                                 Measures
                                                                 KPIs
Reporting Properties
•   Setting the representative column and
    image tells Power View how to summarize
    your data, and show stored images
•   Other properties tell it about: key
    attributes, default aggregations and more
•   These properties were, essentially, created
    for Power View
    – Though other clients are free to use them too
Advanced Modeling
and Properties
Why Is Power View in SharePoint?
•   Integration with PowerPivot and Excel
    Services
    – Create Power View reports in the same place the data
      sits, and side-by-side with other analyses
•   Document security subsystem
    – Building a new one just for Power View would have
      delayed the product
•   SharePoint is the MS BI Presentation Layer
    – Excel Services
    – PerformancePoint Services
    – Reporting Services (SharePoint integration is optional)
Non-SharePoint-Dependent
Alternatives
•   Dundas Dashboard
•   Tableau
•   .NET data viz components from Telerik,
    DevExpress, ComponentOne, Infragistics
    and…
•   Reporting Services…
Data Visualization in SSRS
Futures
•   Shown at PASS: HTML 5
•   Rumored: Windows 8 Metro
•   One day?: Non-BISM data
•   Originally planned: Export to PowerPoint
•   My hope: permission to deploy in non-
    SharePoint scenarios:
    – Silverlight or Metro apps
    – Standalone, hosted on Azure or Office 365
    – A free Excel add-in, for desktop use
Summing Up
•   Power View is Microsoft’s first true ad hoc
    reporting technology
•   It’s also the first data BI stack component
    to make heavy use of XAML
•   An underlying motivation for the team was
    to make data exploration fun, and it shows
•   Power View is part of Microsoft’s BI
    Renaissance
Thank you


•   andrew.brust@bluebadgeinsights.com
•   @andrewbrust on Twitter
•   Want to get the free “Redmond Roundup
    Plus?”
    – Text “bluebadge” to 22828

Power View: Analysis and Visualization for Your Application’s Data

  • 1.
    Power View: Analysisand Visualization for Your Application’s Data Andrew J. Brust Founder and CEO Level: Intermediate
  • 2.
    Meet Andrew • CEO and Founder, Blue Badge Insights • Big Data blogger for ZDNet • Microsoft Regional Director, MVP • Co-chair VSLive! and 17 years as a speaker • Founder, Microsoft BI User Group of NYC – http://www.msbinyc.com • Co-moderator, NYC .NET Developers Group – http://www.nycdotnetdev.com • “Redmond Review” columnist for Visual Studio Magazine and Redmond Developer News • brustblog.com, Twitter: @andrewbrust
  • 3.
    My New Blog(bit.ly/bigondata)
  • 4.
  • 5.
    Agenda • Intro • Basic Use • Data Acquisition • Filtering • Advanced Visualizations • Advanced Features
  • 6.
    What is PowerView? • Ad hoc reporting. Really! • Analysis, data exploration • Data Visualization • In Silverlight, in the browser, in SharePoint • Feels a little like Excel BI • Is actually based on SSRS – Power View makes a special RDL file
  • 7.
    How Do YouGet It? • It will ship with SQL Server 2012, BI and Enterprise Editions • It will require SharePoint 2010 and the SharePoint Enterprise Client Access License (eCAL) • It will work against data in BI Semantic Models (BISMs): – PowerPivot (on SharePoint) – “Tabular” mode of SQL Server Analysis Services in SQL Server 2012
  • 8.
    In the browser, PowerView! in Silverlight Ribbon, like Excel Variety of visualizations and data formats Field list, like Excel Data regions pane, like Excel
  • 9.
    View Modes Maximize one chart, fit report to window, put whole report in Reading Mode or Full Screen Create multiple pages (views)
  • 10.
  • 11.
    BISM: A Column-OrientedStore • Imagine, instead of: Employee ID Age Income 1 43 90000 2 38 100000 3 35 100000 • You have: Employee ID 1 2 3 Age 43 38 35 Income 90000 100000 100000 • Perf: values you wish to aggregate are adjacent • Efficiency: great compression from identical or nearly- identical values in proximity • Fast aggregation and high compression means huge volumes of data can be stored and processed, in RAM
  • 12.
    Data Import • Relational databases – SQL Server (including SQL Azure!), Access – Oracle, DB2, Sybase, Informix – Teradata – “Others” (OLE DB, including OLE DB provider for ODBC) • OData feeds, incl. R2/Denali Reporting Services, SharePoint 2010 lists, Azure DataMarket, ADO.NET Data Services (Astoria) • Excel via clipboard, linked tables • Filter, preview, friendly names for tables/columns
  • 13.
    DirectQuery Mode • In DQ mode, model defines schema, but is not used for data • Queries issued directly against source • Similar to ROLAP storage for conventional SSAS cubes
  • 14.
    Creating a SharePointPower View Data Source • To repeat: Power View works only against PowerPivot/SSAS tabular models – DirectQuery mode supported, however • For PowerPivot, click “Create Power View Report” button or option on workbook in SharePoint report gallery • For SSAS tabular model, create BISM data source, then click its “Create Power View Report” button or option – BISM data sources can point to PowerPivot workbooks too, if you want.
  • 15.
  • 16.
    Constraining Your DataIn Power View • Tiles – A filtering mechanism within a visualization • Highlighting – Selection in one visualization affects the others • Slicers – Similar to Excel against PowerPivot • True Filters – Checked drop-down list; very Excel-like – Right-hand filter pane, similar to SSRS and Excel Services
  • 17.
  • 18.
    Multipliers • Multiple charts within a chart, in columns, rows, or a matrix – Horizontal and vertical multipliers • Allows for visualizing 1 or 2 additional dimensions
  • 19.
    Scatter/Bubble Charts • Allow for several measures • Features a “play” axis which can be manipulated through a slider or animated • Excellent way to visualize trends over time
  • 20.
  • 21.
    Perspectives Default Aggregations Special Advanced Mode BISM Advanced Modeling Reporting properties Hierarchies Hide specific columns and tables Measures KPIs
  • 22.
    Reporting Properties • Setting the representative column and image tells Power View how to summarize your data, and show stored images • Other properties tell it about: key attributes, default aggregations and more • These properties were, essentially, created for Power View – Though other clients are free to use them too
  • 23.
  • 24.
    Why Is PowerView in SharePoint? • Integration with PowerPivot and Excel Services – Create Power View reports in the same place the data sits, and side-by-side with other analyses • Document security subsystem – Building a new one just for Power View would have delayed the product • SharePoint is the MS BI Presentation Layer – Excel Services – PerformancePoint Services – Reporting Services (SharePoint integration is optional)
  • 25.
    Non-SharePoint-Dependent Alternatives • Dundas Dashboard • Tableau • .NET data viz components from Telerik, DevExpress, ComponentOne, Infragistics and… • Reporting Services…
  • 26.
  • 27.
    Futures • Shown at PASS: HTML 5 • Rumored: Windows 8 Metro • One day?: Non-BISM data • Originally planned: Export to PowerPoint • My hope: permission to deploy in non- SharePoint scenarios: – Silverlight or Metro apps – Standalone, hosted on Azure or Office 365 – A free Excel add-in, for desktop use
  • 28.
    Summing Up • Power View is Microsoft’s first true ad hoc reporting technology • It’s also the first data BI stack component to make heavy use of XAML • An underlying motivation for the team was to make data exploration fun, and it shows • Power View is part of Microsoft’s BI Renaissance
  • 29.
    Thank you • andrew.brust@bluebadgeinsights.com • @andrewbrust on Twitter • Want to get the free “Redmond Roundup Plus?” – Text “bluebadge” to 22828