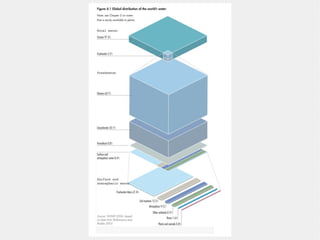
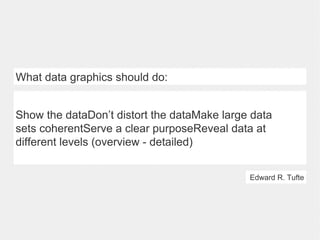
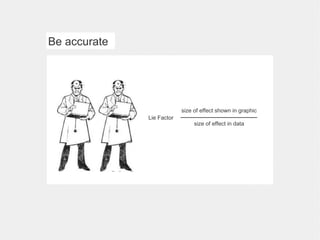
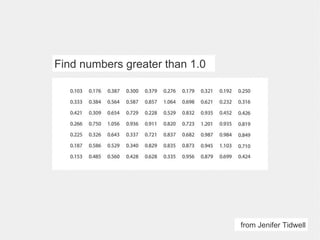
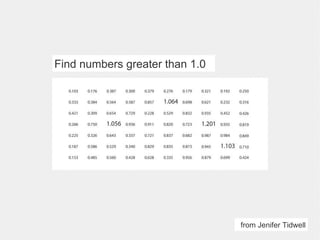
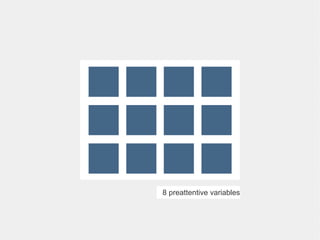
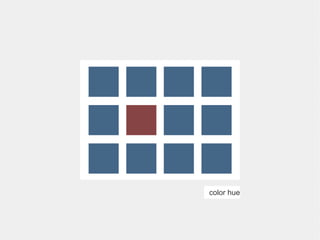
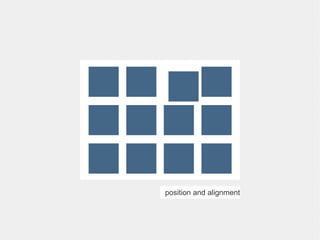
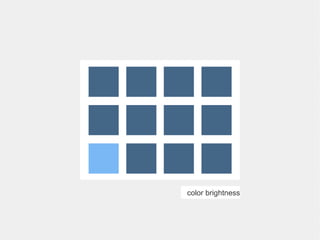
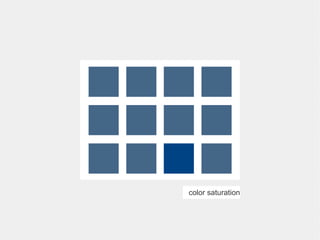
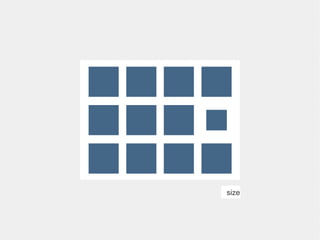
The document discusses best practices for visualizing data through graphics. It recommends that graphics show the data accurately without distortion, make large datasets coherent, serve a clear purpose, and reveal data at different levels of detail. It also identifies certain visual features like color, position, size, and shape that can effectively convey information preattentively without conscious effort from the viewer.


![Predictive Analytics vs Prescriptive Analytics [Infographic]](https://cdn.slidesharecdn.com/ss_thumbnails/predictive-analytics-vs-prescriptive-analytics-161017083045-thumbnail.jpg?width=640&height=640&fit=bounds)


