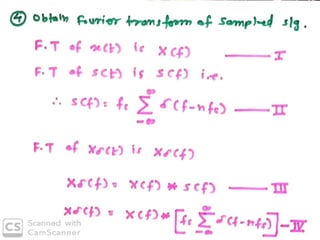
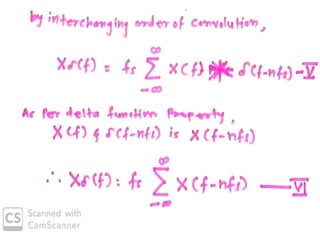
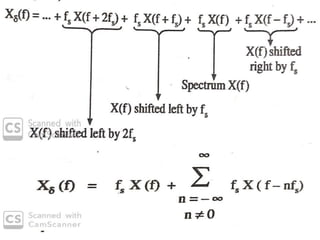
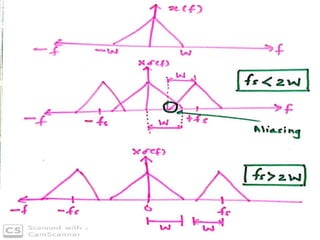
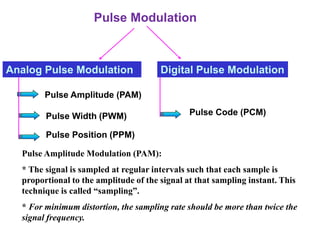
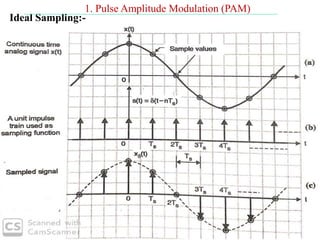
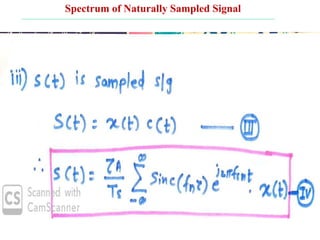
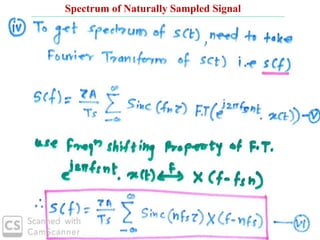
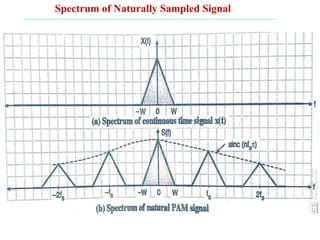
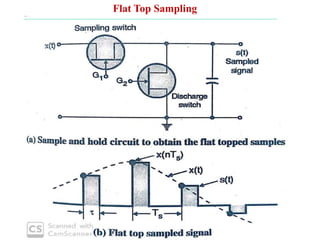
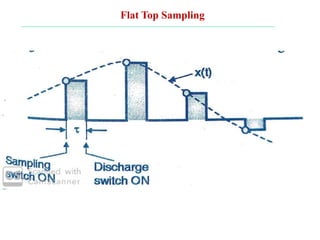
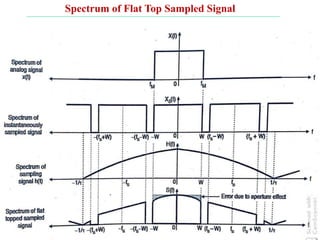
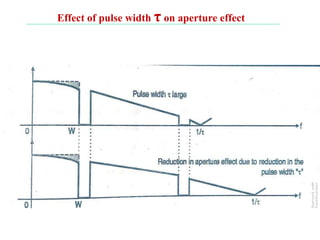
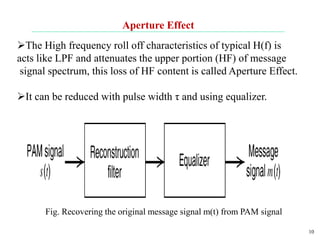
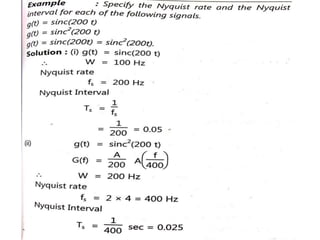
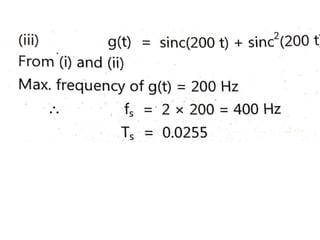
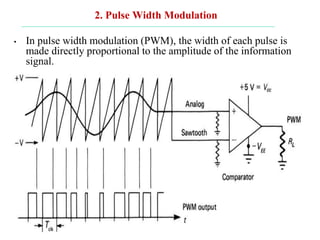
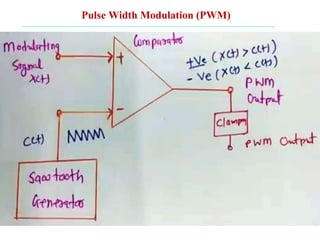
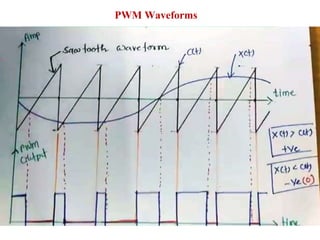
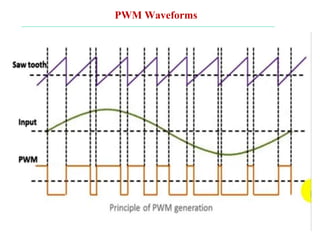
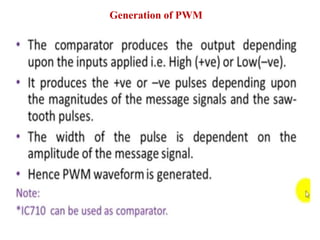
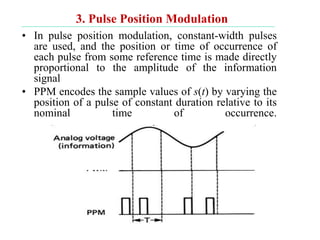
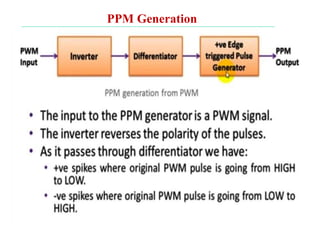
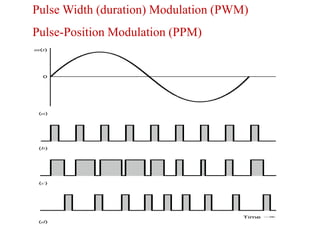
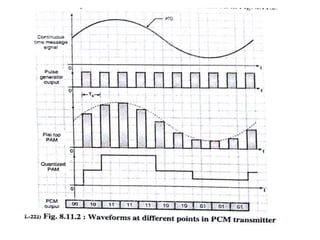
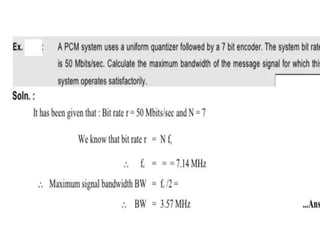
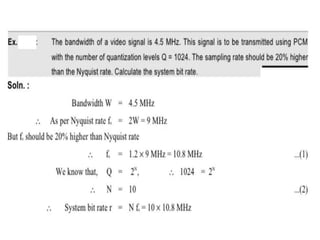
UNIT:-6
Pulse Analog Modulation
• Band limited & time-limited signals,
Narrowband signals, and systems, Sampling
theorem in the time domain, Nyquist
criteria, Types of sampling- ideal, natural,
flat top, Aliasing & Aperture effect. PAM
PWM & PPM. Introduction to Pulse Code
Modulation.
Analog-to-Digital converters translate analog signals, real
world signals like temperature, pressure, voltage, current,
distance, or light intensity, into a digital representation of that
signal.
This digital representation can then be processed,
computed, transmitted or stored.
Need of Analog to Digital conversion
Digital signal is easy to perform mathematical manipulation to
the data. So the computers and microprocessors can store, analyse,
understand, process, and display the results, since microprocessors
deal with digital information.
Once the data is in digital format, it can be statistically analysed
such as mathematically process it to extract, isolate, manipulate
information as desired.
It can be compressed for faster transmission and minimize
hardware storage capacity.
It can be encrypted for security.
With analog, it is pretty easy to tap into a private phone
conversation; digital encryption secured privacy.
Need of Analog to Digital conversion
It is easy to search and compare stored digital data.
Better Noise immunity.
Supports high signal fidelity.
Channel coding can be possible.
Flexible hardware implementation.
Use of regenerative repeaters is possible.
Digital signal is more reliable as compared to analog circuits.
Need of Analog to Digital conversion
Sampling Process
It is the process of converting continuous a analog signal to discrete
analog signal. Hence sampled signal is discrete time representation
of original analog signal.
Sampling theorem states that “continues form of a time-variant signal can
be represented in the discrete form of a signal with help of samples and
the sampled (discrete) signal can be recovered to original form when the
sampling signal frequency Fs having the greater frequency value than or
equal to the input signal frequency Fm.
Fs≥2Fm
If the sampling frequency (Fs) equals twice the input signal frequency
(Fm), then such a condition is called the Nyquist Criteria for sampling.
When sampling frequency equals twice the input signal frequency is
known as “Nyquist rate”.
Fs=2Fm
If the sampling frequency (Fs) is less than twice the input signal
frequency, such criteria called an Aliasing effect.
Fs<2Fm
So, there are three conditions that are possible from the sampling
frequency criteria. They are sampling, Nyquist and aliasing states.
Basic Sampling Theorem Statement
Sampling Theorem for low pass signals
The low pass signals having the low range frequency and
whenever this type of low-frequency signals need to convert
to discrete then the sampling frequency should be at least
twice or greater than twice of these low-frequency signals to
avoid the distortion in the output discrete signal. By following
this condition, the sampled signal does not overlap and this
sampled signal can be reconstructed to its original form.
OR
“A continuous time signal x(t) can be completely represented
in its sampled form and recovered back from the sampled
form if sampling frequency Fs≥2W where W is the maximum
frequency of the continuous time signal x(t)”
This theorem was introduced by Shanon in 1949.
Sampling Theorem Proof
Pulse Modulation
Pulse modulation consists essentially of sampling
analog information signals and then converting
those samples into discrete pulses and transporting
the pulses from a source to a destination over a
physical transmission medium.
The three predominant methods of pulse
modulation:
1) Pulse Amplitude Modulation (PAM)
2) Pulse Width Modulation (PWM)
3) Pulse Position Modulation (PPM)
Introduction
Analog Pulse Modulation Digital Pulse Modulation
Pulse Amplitude (PAM)
Pulse Width (PWM)
Pulse Position (PPM)
Pulse Code (PCM)
Pulse Modulation
Pulse Amplitude Modulation (PAM):
* The signal is sampled at regular intervals such that each sample is
proportional to the amplitude of the signal at that sampling instant. This
technique is called “sampling”.
* For minimum distortion, the sampling rate should be more than twice the
signal frequency.
Ideal Sampling:-
1. Pulse Amplitude Modulation (PAM)
Natural Sampling or Chopper Sampling:-
Natural Sampling Waveforms
“Natural Sampling” (Practically)
Working of “Natural Sampling”
• The circuit is used to illustrate pulse amplitude modulation
(PAM). The FET is the switch used as a sampling gate.
• When the FET is on, the analog voltage is shorted to ground;
when off, the FET is essentially open, so that the analog
signal sample appears at the output.
• Op-amp 1 is a non-inverting amplifier that isolates the
analog input channel from the switching function.
• Op-amp 2 is a high input-impedance voltage follower
capable of driving low-impedance loads (high “fanout”).
• The resistor R is used to limit the output current of op-amp 1
when the FET is “on” and provides a voltage division with rd
of the FET. (rd, the drain-to-source resistance, is low but not
zero)
Spectrum of Naturally Sampled Signal
Flat Top Sampling
Flat Top Sampling
Spectrum of Flat Top Sampled Signal
Effect of pulse width τ on aperture effect
Aperture Effect
10
The High frequency roll off characteristics of typical H(f) is
acts like LPF and attenuates the upper portion (HF) of message
signal spectrum, this loss of HF content is called Aperture Effect.
It can be reduced with pulse width τ and using equalizer.
Fig. Recovering the original message signal m(t) from PAM signal
2. Pulse Width Modulation
• In pulse width modulation (PWM), the width of each pulse is
made directly proportional to the amplitude of the information
signal.
Pulse Width Modulation (PWM)
•
PWM Waveforms
PWM Waveforms
Generation of PWM
3. Pulse Position Modulation
• In pulse position modulation, constant-width pulses
are used, and the position or time of occurrence of
each pulse from some reference time is made directly
proportional to the amplitude of the information
signal
• PPM encodes the sample values of s(t) by varying the
position of a pulse of constant duration relative to its
nominal time of occurrence.
PPM Generation
PPM Generation
PPM Waveforms
Pulse Width (duration) Modulation (PWM)
Pulse-Position Modulation (PPM)
Comparison between PWM and PPM
Demodulation of PWM
Demodulation of PWM
•
PWM Signal Waveform
The waveform after processed
by the integrator and voltage
threshold circuit
Demodulation of PWM
•
The output signal of with pulse signal
PAM Signal Waveform
Demodulation of PWM
•
The output signal of with pulse
signal
PWM Signal Waveform
The waveform after processed
by the integrator and voltage
threshold circuit
PAM Signal Waveform
Conversion of PPM to PWM
Applications
Pulse code Modulation
Solved Numericals
THANK YOU

analog communication Pulse analog Modulation_.ppt

  • 1.
    UNIT:-6 Pulse Analog Modulation •Band limited & time-limited signals, Narrowband signals, and systems, Sampling theorem in the time domain, Nyquist criteria, Types of sampling- ideal, natural, flat top, Aliasing & Aperture effect. PAM PWM & PPM. Introduction to Pulse Code Modulation.
  • 8.
    Analog-to-Digital converters translateanalog signals, real world signals like temperature, pressure, voltage, current, distance, or light intensity, into a digital representation of that signal. This digital representation can then be processed, computed, transmitted or stored. Need of Analog to Digital conversion
  • 9.
    Digital signal iseasy to perform mathematical manipulation to the data. So the computers and microprocessors can store, analyse, understand, process, and display the results, since microprocessors deal with digital information. Once the data is in digital format, it can be statistically analysed such as mathematically process it to extract, isolate, manipulate information as desired. It can be compressed for faster transmission and minimize hardware storage capacity. It can be encrypted for security. With analog, it is pretty easy to tap into a private phone conversation; digital encryption secured privacy. Need of Analog to Digital conversion
  • 10.
    It is easyto search and compare stored digital data. Better Noise immunity. Supports high signal fidelity. Channel coding can be possible. Flexible hardware implementation. Use of regenerative repeaters is possible. Digital signal is more reliable as compared to analog circuits. Need of Analog to Digital conversion
  • 11.
    Sampling Process It isthe process of converting continuous a analog signal to discrete analog signal. Hence sampled signal is discrete time representation of original analog signal.
  • 12.
    Sampling theorem statesthat “continues form of a time-variant signal can be represented in the discrete form of a signal with help of samples and the sampled (discrete) signal can be recovered to original form when the sampling signal frequency Fs having the greater frequency value than or equal to the input signal frequency Fm. Fs≥2Fm If the sampling frequency (Fs) equals twice the input signal frequency (Fm), then such a condition is called the Nyquist Criteria for sampling. When sampling frequency equals twice the input signal frequency is known as “Nyquist rate”. Fs=2Fm If the sampling frequency (Fs) is less than twice the input signal frequency, such criteria called an Aliasing effect. Fs<2Fm So, there are three conditions that are possible from the sampling frequency criteria. They are sampling, Nyquist and aliasing states. Basic Sampling Theorem Statement
  • 13.
    Sampling Theorem forlow pass signals The low pass signals having the low range frequency and whenever this type of low-frequency signals need to convert to discrete then the sampling frequency should be at least twice or greater than twice of these low-frequency signals to avoid the distortion in the output discrete signal. By following this condition, the sampled signal does not overlap and this sampled signal can be reconstructed to its original form. OR “A continuous time signal x(t) can be completely represented in its sampled form and recovered back from the sampled form if sampling frequency Fs≥2W where W is the maximum frequency of the continuous time signal x(t)” This theorem was introduced by Shanon in 1949.
  • 14.
  • 24.
    Pulse Modulation Pulse modulationconsists essentially of sampling analog information signals and then converting those samples into discrete pulses and transporting the pulses from a source to a destination over a physical transmission medium. The three predominant methods of pulse modulation: 1) Pulse Amplitude Modulation (PAM) 2) Pulse Width Modulation (PWM) 3) Pulse Position Modulation (PPM) Introduction
  • 25.
    Analog Pulse ModulationDigital Pulse Modulation Pulse Amplitude (PAM) Pulse Width (PWM) Pulse Position (PPM) Pulse Code (PCM) Pulse Modulation Pulse Amplitude Modulation (PAM): * The signal is sampled at regular intervals such that each sample is proportional to the amplitude of the signal at that sampling instant. This technique is called “sampling”. * For minimum distortion, the sampling rate should be more than twice the signal frequency.
  • 26.
    Ideal Sampling:- 1. PulseAmplitude Modulation (PAM)
  • 27.
    Natural Sampling orChopper Sampling:-
  • 28.
  • 29.
  • 30.
    Working of “NaturalSampling” • The circuit is used to illustrate pulse amplitude modulation (PAM). The FET is the switch used as a sampling gate. • When the FET is on, the analog voltage is shorted to ground; when off, the FET is essentially open, so that the analog signal sample appears at the output. • Op-amp 1 is a non-inverting amplifier that isolates the analog input channel from the switching function. • Op-amp 2 is a high input-impedance voltage follower capable of driving low-impedance loads (high “fanout”). • The resistor R is used to limit the output current of op-amp 1 when the FET is “on” and provides a voltage division with rd of the FET. (rd, the drain-to-source resistance, is low but not zero)
  • 31.
    Spectrum of NaturallySampled Signal
  • 32.
    Spectrum of NaturallySampled Signal
  • 33.
    Spectrum of NaturallySampled Signal
  • 34.
    Spectrum of NaturallySampled Signal
  • 35.
    Spectrum of NaturallySampled Signal
  • 36.
  • 37.
  • 38.
    Spectrum of FlatTop Sampled Signal
  • 39.
    Spectrum of FlatTop Sampled Signal
  • 40.
    Spectrum of FlatTop Sampled Signal
  • 41.
    Spectrum of FlatTop Sampled Signal
  • 42.
    Effect of pulsewidth τ on aperture effect
  • 43.
    Aperture Effect 10 The Highfrequency roll off characteristics of typical H(f) is acts like LPF and attenuates the upper portion (HF) of message signal spectrum, this loss of HF content is called Aperture Effect. It can be reduced with pulse width τ and using equalizer. Fig. Recovering the original message signal m(t) from PAM signal
  • 46.
    2. Pulse WidthModulation • In pulse width modulation (PWM), the width of each pulse is made directly proportional to the amplitude of the information signal.
  • 47.
  • 48.
  • 49.
  • 50.
  • 51.
    3. Pulse PositionModulation • In pulse position modulation, constant-width pulses are used, and the position or time of occurrence of each pulse from some reference time is made directly proportional to the amplitude of the information signal • PPM encodes the sample values of s(t) by varying the position of a pulse of constant duration relative to its nominal time of occurrence.
  • 52.
  • 53.
  • 54.
  • 56.
    Pulse Width (duration)Modulation (PWM) Pulse-Position Modulation (PPM)
  • 57.
  • 58.
  • 59.
    Demodulation of PWM • PWMSignal Waveform The waveform after processed by the integrator and voltage threshold circuit
  • 60.
    Demodulation of PWM • Theoutput signal of with pulse signal PAM Signal Waveform
  • 61.
    Demodulation of PWM • Theoutput signal of with pulse signal PWM Signal Waveform The waveform after processed by the integrator and voltage threshold circuit PAM Signal Waveform
  • 62.
  • 63.
  • 64.
  • 68.
  • 83.
  • 86.