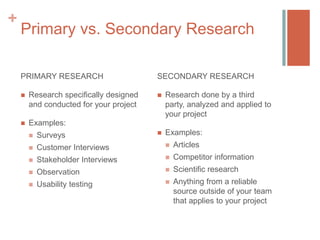
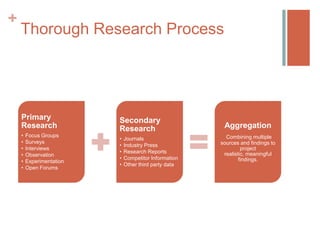
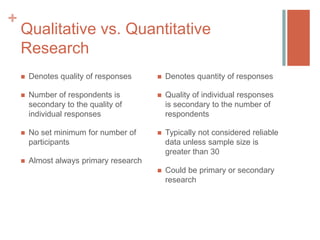
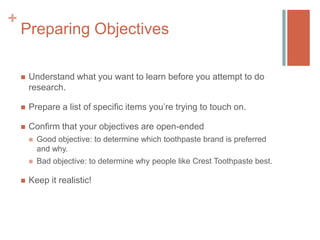
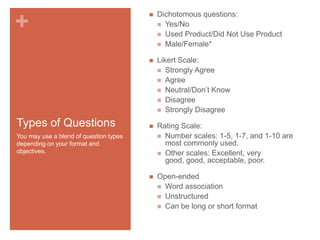
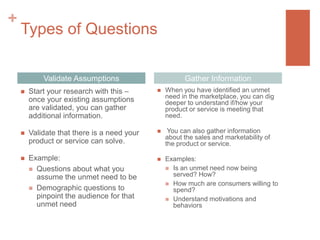
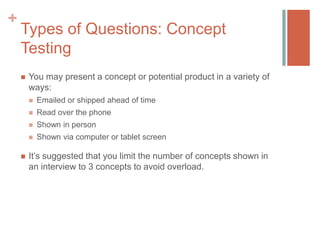
+

Primary Research
Emily Gremel
Strategist
Square One Design
+

Agenda


Research Basics



Research Planning



Conducting Research



Analyzing Results



Outcomes
+
Research Basics
+

Primary vs. Secondary Research
PRIMARY RESEARCH


Research specifically designed
and conducted for your project



SECONDARY RESEARCH


Research done by a third
party, analyzed and applied to
your project

Examples:


Examples:



Surveys



Customer Interviews



Articles



Stakeholder Interviews



Competitor information



Observation



Scientific research



Usability testing



Anything from a reliable
source outside of your team
that applies to your project
+

Thorough Research Process

Primary
Research
•
•
•
•
•
•

Focus Groups
Surveys
Interviews
Observation
Experimentation
Open Forums

Secondary
Research
•
•
•
•
•

Journals
Industry Press
Research Reports
Competitor Information
Other third party data

Aggregation
Combining multiple
sources and findings to
project
realistic, meaningful
findings.
+

Qualitative vs. Quantitative
Research


Denotes quality of responses



Denotes quantity of responses



Number of respondents is
secondary to the quality of
individual responses



Quality of individual responses
is secondary to the number of
respondents



No set minimum for number of
participants



Typically not considered reliable
data unless sample size is
greater than 30



Almost always primary research


Could be primary or secondary
research
+
Research Planning
+

Preparing Objectives


Understand what you want to learn before you attempt to do
research.



Prepare a list of specific items you’re trying to touch on.



Confirm that your objectives are open-ended






Good objective: to determine which toothpaste brand is preferred
and why.
Bad objective: to determine why people like Crest Toothpaste best.

Keep it realistic!
+

Potential Research Objectives


Validate assumption about unmet need in the marketplace



Develop or fine tune a viable product concept



Define your target audience



Create a more thorough map of the competitive landscape



Identify when to pivot away from a failed product or plan



Test existing products for potential improvements or pitfalls
+


One-on-one Interview



Focus Group



Survey (qualitative or quantitative)



Passive Observation

Selecting a Format



Experimentation

Make sure you choose the best format
for achieving your objectives.



A/B Testing



Open Forums



Usability Testing
+

Create an Outline


Once you have selected a format, create an outline to alleviate
stress and stay organized.



Craft an introduction to get respondents comfortable.



Create topic headings.



Group related questions under the same topic heading for ease
of organization, and to help the respondent track with your
questions.
+

Question Flow


Begin with simple questions to get your respondent
comfortable.



Move through your outlined topics by starting with more general
questions, and delving into specifics later in the survey.



If using scales or rating systems, stay consistent.



Demographic questions should be asked at the very beginning
or very end of the survey – personal preference.
Types of Questions

Dichotomous questions:
 Yes/No
 Used Product/Did Not Use Product
 Male/Female*



+



Likert Scale:
 Strongly Agree
 Agree
 Neutral/Don’t Know
 Disagree
 Strongly Disagree



Rating Scale:
 Number scales: 1-5, 1-7, and 1-10 are
most commonly used.
 Other scales: Excellent, very
good, good, acceptable, poor.



Open-ended
 Word association
 Unstructured
 Can be long or short format

You may use a blend of question types
depending on your format and
objectives.
+

Types of Questions
Validate Assumptions

Gather Information



Start your research with this –
once your existing assumptions
are validated, you can gather
additional information.



When you have identified an unmet
need in the marketplace, you can dig
deeper to understand if/how your
product or service is meeting that
need.



Validate that there is a need your
product or service can solve.



You can also gather information
about the sales and marketability of
the product or service.



Example:
 Questions about what you
assume the unmet need to be
 Demographic questions to
pinpoint the audience for that
unmet need



Examples:
 Is an unmet need now being
served? How?
 How much are consumers willing to
spend?
 Understand motivations and
behaviors
+

Types of Questions: Concept
Testing


You may present a concept or potential product in a variety of
ways:



Read over the phone



Shown in person





Emailed or shipped ahead of time

Shown via computer or tablet screen

It’s suggested that you limit the number of concepts shown in
an interview to 3 concepts to avoid overload.
+
Conducting Research
+

Recruiting Respondents: Who?
No target market defined



Use your research to test your
own hypothesis



Start with existing customers
and gather their demographic
information



Start by using a few of the
attributes of your target market





Look for a diverse but
representative demographic
group

Defined target market

If you have multiple target
markets, make sure to gather
data in a way that keeps these
separately
+

Recruiting Respondents: How?
Small Budget


Look within your own network
to recruit



Obtain referrals



Large Budget

Speak with existing customers



You can hire a firm to recruit or
help you develop a sample
profile. Some firms include:



Manta




Dun & Bradstreet
FPDS

You can offer incentives to help
aid participation numbers
+

How Many Respondents Do I
Need?
20-30 respondents
identify 90-95% of the
attributes

5 respondents identify
<50% of the attributes

MIT Study, Griffin & Hauser, 1993.
Use ACTiVATE®/University affiliation:
 Non-threatening approach
 Typically associated with ethical research
methods, trustworthiness



+



Identify a benefit to them:
 Latest technology from an academic
source
 You’ll share the findings with them upon
their request
 Won’t take up a lot of time (only use this
one if it’s true)



Incentivize them:
 If funds are low, offer each respondent
with the chance to win a prize (could be
a free product, cash, gift card, or
something from a partner business)
 If funds are high, or your sample set is
highly targeted, you may need to pay
each interviewee for their time

Enticing
Respondents
+

Effective Interviewing


Be friendly, but have no vested interest in
outcome



Record after getting informed consent



Probe and clarify



Listen more than you talk



Strive for a supportive, but non-biased
conversation
+

Probing and Clarifying
DON’T ASK

DO ASK


What else?



Anything else?



When you said ________, what
did you mean by that?



When you said, ________, did
you mean _________?



Can you elaborate on that?



You sound ________ about
that. Can you tell me more?



(When respondents expressly
state like/dislike) What do you
like/dislike about that?



(Without expressed like/dislike)
What do you like/dislike about
that?



How could it be better?



Even thought the product is
great, how could it be better?
+

Expecting the Unexpected


Recruitment/sample set



Scheduling



Weather



Tech difficulties



Respondent problems:


Doesn’t qualify



Confused by questions



Language barrier



Refusal to provide
demographic information



Refusal to provide other
information



Quits midway through
+
Analyzing Results
+

During and After the Interview


Record the interview if possible



Write notes during or within 24 hours of the interview



Organize responses in similar format to facilitate comparison



Send notes to respondent for clarification and confirmation
when necessary and appropriate



Send thank you notes for one-on-one interviews
+

Analyzing Your Results


With qualitative research, you should look for common themes
amongst multiple participants.



In the case of a consumer profile, divergent data could mean
different things:






In one case, if half your consumers are college students and the other
half are parents, it indicates you likely have two target audiences.
In another case, if you find half your consumers don’t use sunscreen in
the summer, it’s likely not a relevant attribute of your target market.

Be wary of picking sound bites just because they support your
hypothesis – is there evidence that the opinion is shared by many?
+

Analyzing Your Results


When doing quantitative research, you are going to end up with
a lot of data.



Look for instances where the data is “telling a story”.



Just because something is statistically significant doesn’t mean
it’s important.


For example, you might find that almost 100% of people use paper.
That doesn’t mean you need a chart to show it.
+

Analyzing Your Results


Understand that correlation does not always equal causation.
+

Analyzing Results (Example)
+
Outcomes
Your respondents didn’t see a need for
your product.
 You may have misidentified your target
market. Who does need it?
 No audience? No sales. Pivot away.



Outcomes

All of your hypotheses were confirmed –
full steam ahead!



+



Respondents favored a competitor’s
product heavily.
 What can you change to become more
attractive than your competitor?



Everyone liked the product – but they don’t
want to pay for it!
 Can you add additional features or
benefits to change this?
 Do you need to re-examine your
revenue model?



Your product was a hit – but the packaging
or messaging was a miss.
 Realign your brand.

You may face a variety of
circumstances after your research has
been conducted and analyzed.
+

QUESTIONS?

Primary Research Basics: Inforum

  • 1.
  • 2.
    + Agenda  Research Basics  Research Planning  ConductingResearch  Analyzing Results  Outcomes
  • 3.
  • 4.
    + Primary vs. SecondaryResearch PRIMARY RESEARCH  Research specifically designed and conducted for your project  SECONDARY RESEARCH  Research done by a third party, analyzed and applied to your project Examples:  Examples:  Surveys  Customer Interviews  Articles  Stakeholder Interviews  Competitor information  Observation  Scientific research  Usability testing  Anything from a reliable source outside of your team that applies to your project
  • 5.
    + Thorough Research Process Primary Research • • • • • • FocusGroups Surveys Interviews Observation Experimentation Open Forums Secondary Research • • • • • Journals Industry Press Research Reports Competitor Information Other third party data Aggregation Combining multiple sources and findings to project realistic, meaningful findings.
  • 6.
    + Qualitative vs. Quantitative Research  Denotesquality of responses  Denotes quantity of responses  Number of respondents is secondary to the quality of individual responses  Quality of individual responses is secondary to the number of respondents  No set minimum for number of participants  Typically not considered reliable data unless sample size is greater than 30  Almost always primary research  Could be primary or secondary research
  • 7.
  • 8.
    + Preparing Objectives  Understand whatyou want to learn before you attempt to do research.  Prepare a list of specific items you’re trying to touch on.  Confirm that your objectives are open-ended    Good objective: to determine which toothpaste brand is preferred and why. Bad objective: to determine why people like Crest Toothpaste best. Keep it realistic!
  • 9.
    + Potential Research Objectives  Validateassumption about unmet need in the marketplace  Develop or fine tune a viable product concept  Define your target audience  Create a more thorough map of the competitive landscape  Identify when to pivot away from a failed product or plan  Test existing products for potential improvements or pitfalls
  • 10.
    +  One-on-one Interview  Focus Group  Survey(qualitative or quantitative)  Passive Observation Selecting a Format  Experimentation Make sure you choose the best format for achieving your objectives.  A/B Testing  Open Forums  Usability Testing
  • 11.
    + Create an Outline  Onceyou have selected a format, create an outline to alleviate stress and stay organized.  Craft an introduction to get respondents comfortable.  Create topic headings.  Group related questions under the same topic heading for ease of organization, and to help the respondent track with your questions.
  • 12.
    + Question Flow  Begin withsimple questions to get your respondent comfortable.  Move through your outlined topics by starting with more general questions, and delving into specifics later in the survey.  If using scales or rating systems, stay consistent.  Demographic questions should be asked at the very beginning or very end of the survey – personal preference.
  • 13.
    Types of Questions Dichotomousquestions:  Yes/No  Used Product/Did Not Use Product  Male/Female*  +  Likert Scale:  Strongly Agree  Agree  Neutral/Don’t Know  Disagree  Strongly Disagree  Rating Scale:  Number scales: 1-5, 1-7, and 1-10 are most commonly used.  Other scales: Excellent, very good, good, acceptable, poor.  Open-ended  Word association  Unstructured  Can be long or short format You may use a blend of question types depending on your format and objectives.
  • 14.
    + Types of Questions ValidateAssumptions Gather Information  Start your research with this – once your existing assumptions are validated, you can gather additional information.  When you have identified an unmet need in the marketplace, you can dig deeper to understand if/how your product or service is meeting that need.  Validate that there is a need your product or service can solve.  You can also gather information about the sales and marketability of the product or service.  Example:  Questions about what you assume the unmet need to be  Demographic questions to pinpoint the audience for that unmet need  Examples:  Is an unmet need now being served? How?  How much are consumers willing to spend?  Understand motivations and behaviors
  • 15.
    + Types of Questions:Concept Testing  You may present a concept or potential product in a variety of ways:   Read over the phone  Shown in person   Emailed or shipped ahead of time Shown via computer or tablet screen It’s suggested that you limit the number of concepts shown in an interview to 3 concepts to avoid overload.
  • 16.
  • 17.
    + Recruiting Respondents: Who? Notarget market defined  Use your research to test your own hypothesis  Start with existing customers and gather their demographic information  Start by using a few of the attributes of your target market   Look for a diverse but representative demographic group Defined target market If you have multiple target markets, make sure to gather data in a way that keeps these separately
  • 18.
    + Recruiting Respondents: How? SmallBudget  Look within your own network to recruit  Obtain referrals  Large Budget Speak with existing customers  You can hire a firm to recruit or help you develop a sample profile. Some firms include:   Manta   Dun & Bradstreet FPDS You can offer incentives to help aid participation numbers
  • 19.
    + How Many RespondentsDo I Need? 20-30 respondents identify 90-95% of the attributes 5 respondents identify <50% of the attributes MIT Study, Griffin & Hauser, 1993.
  • 20.
    Use ACTiVATE®/University affiliation: Non-threatening approach  Typically associated with ethical research methods, trustworthiness  +  Identify a benefit to them:  Latest technology from an academic source  You’ll share the findings with them upon their request  Won’t take up a lot of time (only use this one if it’s true)  Incentivize them:  If funds are low, offer each respondent with the chance to win a prize (could be a free product, cash, gift card, or something from a partner business)  If funds are high, or your sample set is highly targeted, you may need to pay each interviewee for their time Enticing Respondents
  • 21.
    + Effective Interviewing  Be friendly,but have no vested interest in outcome  Record after getting informed consent  Probe and clarify  Listen more than you talk  Strive for a supportive, but non-biased conversation
  • 22.
    + Probing and Clarifying DON’TASK DO ASK  What else?  Anything else?  When you said ________, what did you mean by that?  When you said, ________, did you mean _________?  Can you elaborate on that?  You sound ________ about that. Can you tell me more?  (When respondents expressly state like/dislike) What do you like/dislike about that?  (Without expressed like/dislike) What do you like/dislike about that?  How could it be better?  Even thought the product is great, how could it be better?
  • 23.
    + Expecting the Unexpected  Recruitment/sampleset  Scheduling  Weather  Tech difficulties  Respondent problems:  Doesn’t qualify  Confused by questions  Language barrier  Refusal to provide demographic information  Refusal to provide other information  Quits midway through
  • 24.
  • 25.
    + During and Afterthe Interview  Record the interview if possible  Write notes during or within 24 hours of the interview  Organize responses in similar format to facilitate comparison  Send notes to respondent for clarification and confirmation when necessary and appropriate  Send thank you notes for one-on-one interviews
  • 26.
    + Analyzing Your Results  Withqualitative research, you should look for common themes amongst multiple participants.  In the case of a consumer profile, divergent data could mean different things:    In one case, if half your consumers are college students and the other half are parents, it indicates you likely have two target audiences. In another case, if you find half your consumers don’t use sunscreen in the summer, it’s likely not a relevant attribute of your target market. Be wary of picking sound bites just because they support your hypothesis – is there evidence that the opinion is shared by many?
  • 27.
    + Analyzing Your Results  Whendoing quantitative research, you are going to end up with a lot of data.  Look for instances where the data is “telling a story”.  Just because something is statistically significant doesn’t mean it’s important.  For example, you might find that almost 100% of people use paper. That doesn’t mean you need a chart to show it.
  • 28.
    + Analyzing Your Results  Understandthat correlation does not always equal causation.
  • 29.
  • 30.
  • 31.
    Your respondents didn’tsee a need for your product.  You may have misidentified your target market. Who does need it?  No audience? No sales. Pivot away.  Outcomes All of your hypotheses were confirmed – full steam ahead!  +  Respondents favored a competitor’s product heavily.  What can you change to become more attractive than your competitor?  Everyone liked the product – but they don’t want to pay for it!  Can you add additional features or benefits to change this?  Do you need to re-examine your revenue model?  Your product was a hit – but the packaging or messaging was a miss.  Realign your brand. You may face a variety of circumstances after your research has been conducted and analyzed.
  • 32.