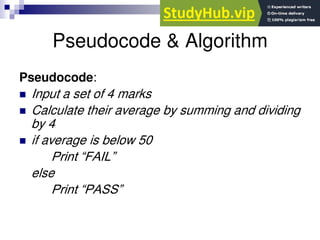
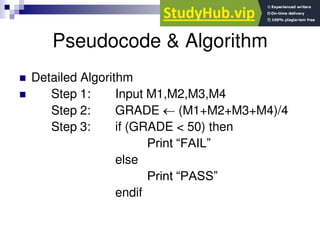
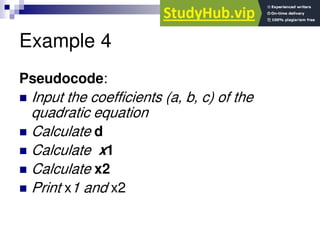
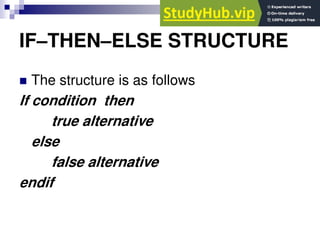
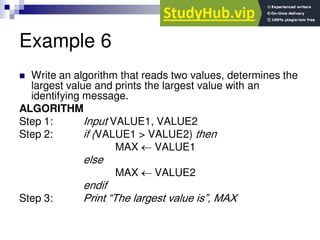
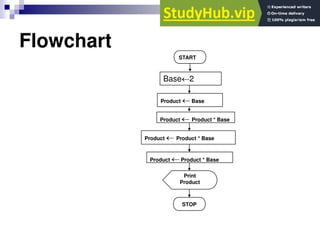
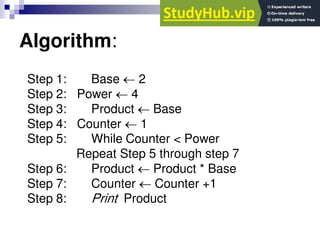
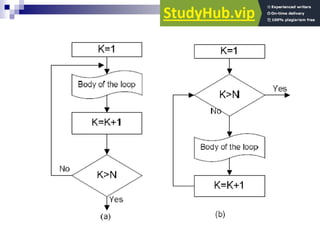
The document discusses algorithms, flowcharts, pseudocode and different programming concepts like decision structures, loops, and problem solving approaches. It provides examples of writing algorithms and drawing flowcharts to solve problems like calculating grades, converting between units, finding the largest number among inputs, calculating powers and more. It also discusses using loops, decision structures, and other programming concepts to refine algorithms and make them more efficient. Pseudocode is presented as an informal way to develop algorithms before implementation.
To understand algorithm and flowchart, it is better to refer this Slideshare that I have created. I have thoroughly presented the key points that make easy in remembering what algorithm and flowchart is. The slide is really simple and wonderful to use it for a quick reference.
This will introduce you to Sorting in Python and help you understand the importance of Sorting. This Python tutorial will take you through various Sorting Algorithms. The Algorithms are lined after one another, starting with Bubble Sort moving to Insertion Sort, Merge Sort, and finally Quick Sort. The demonstration examples will educate you on Sorting Algorithms.
One of the main reasons for the popularity of Dijkstra's Algorithm is that it is one of the most important and useful algorithms available for generating (exact) optimal solutions to a large class of shortest path problems. The point being that this class of problems is extremely important theoretically, practically, as well as educationally.
The solution to the single-source shortest-path tree problem in graph theory. This slide was prepared for Design and Analysis of Algorithm Lab for B.Tech CSE 2nd Year 4th Semester.
A typical programming task can be divided into two phases:
Problem-solving phase: produce an ordered sequence of steps that describe the solution of the problem this sequence of steps is called an algorithm.
Implementation phase: implement the program in some programming language.
Every algorithm must satisfy the following criteria:
Input. Zero or more quantities are externally supplied.
Output. At least one quantity is produced.
Definiteness. Each instruction must be clear and unambiguous(Unique meaning).
Finiteness. An algorithm terminates in a finite number of steps.
Effectiveness. Every instruction must be basic enough to be carried out than, means not so complex.
An algorithm is a finite set of steps defining the solution of a particular problem.
What is the difference between an algorithm and a program?
a program is an implementation of an algorithm to be run on a specific computer and operating system.
an algorithm is more abstract – it does not deal with machine-specific details – think of it as a method to solve a problem.
What is a good algorithm?
Efficient algorithms are good, we generally measure the efficiency of an algorithm based on:
Time: the algorithm should take minimum time to execute.
Space: the algorithm should use less memory.
DIFFERENCE BETWEEN ALGORITHM AND PSEUDOCODE?
An algorithm is a well-defined sequence of steps that provides a solution for a given problem, while pseudocode is one of the methods that can be used to represent an algorithm.
While algorithms can be written in natural language, pseudocode is written in a format that is closely related to high-level programming language structures.
But pseudocode does not use specific programming language syntax and therefore could be understood by programmers who are familiar with different programming languages. Additionally, transforming an algorithm presented in pseudocode to programming code could be much easier than converting an algorithm written in natural language.
But pseudocode does not use specific programming language syntax and therefore could be understood by programmers who are familiar with different programming languages.
Additionally, transforming an algorithm presented in pseudocode to programming code could be much easier than converting an algorithm written in natural language.
Best Techniques To Design Programs - Program Designing TechniquesTech
Now check the Powerpoint presentation about the best techniques to design programs and softwares. For more tutorials and guides visit : www.techora.net
These techniques are also known as the problem solving techniques.These are three types :
1- Pseudocode
2- Algorithm
3- Flowchart
Read| The latest issue of The Challenger is here! We are thrilled to announce that our school paper has qualified for the NATIONAL SCHOOLS PRESS CONFERENCE (NSPC) 2024. Thank you for your unwavering support and trust. Dive into the stories that made us stand out!
The Roman Empire A Historical Colossus.pdfkaushalkr1407
The Roman Empire, a vast and enduring power, stands as one of history's most remarkable civilizations, leaving an indelible imprint on the world. It emerged from the Roman Republic, transitioning into an imperial powerhouse under the leadership of Augustus Caesar in 27 BCE. This transformation marked the beginning of an era defined by unprecedented territorial expansion, architectural marvels, and profound cultural influence.
The empire's roots lie in the city of Rome, founded, according to legend, by Romulus in 753 BCE. Over centuries, Rome evolved from a small settlement to a formidable republic, characterized by a complex political system with elected officials and checks on power. However, internal strife, class conflicts, and military ambitions paved the way for the end of the Republic. Julius Caesar’s dictatorship and subsequent assassination in 44 BCE created a power vacuum, leading to a civil war. Octavian, later Augustus, emerged victorious, heralding the Roman Empire’s birth.
Under Augustus, the empire experienced the Pax Romana, a 200-year period of relative peace and stability. Augustus reformed the military, established efficient administrative systems, and initiated grand construction projects. The empire's borders expanded, encompassing territories from Britain to Egypt and from Spain to the Euphrates. Roman legions, renowned for their discipline and engineering prowess, secured and maintained these vast territories, building roads, fortifications, and cities that facilitated control and integration.
The Roman Empire’s society was hierarchical, with a rigid class system. At the top were the patricians, wealthy elites who held significant political power. Below them were the plebeians, free citizens with limited political influence, and the vast numbers of slaves who formed the backbone of the economy. The family unit was central, governed by the paterfamilias, the male head who held absolute authority.
Culturally, the Romans were eclectic, absorbing and adapting elements from the civilizations they encountered, particularly the Greeks. Roman art, literature, and philosophy reflected this synthesis, creating a rich cultural tapestry. Latin, the Roman language, became the lingua franca of the Western world, influencing numerous modern languages.
Roman architecture and engineering achievements were monumental. They perfected the arch, vault, and dome, constructing enduring structures like the Colosseum, Pantheon, and aqueducts. These engineering marvels not only showcased Roman ingenuity but also served practical purposes, from public entertainment to water supply.
Instructions for Submissions thorugh G- Classroom.pptxJheel Barad
This presentation provides a briefing on how to upload submissions and documents in Google Classroom. It was prepared as part of an orientation for new Sainik School in-service teacher trainees. As a training officer, my goal is to ensure that you are comfortable and proficient with this essential tool for managing assignments and fostering student engagement.
A Strategic Approach: GenAI in EducationPeter Windle
Artificial Intelligence (AI) technologies such as Generative AI, Image Generators and Large Language Models have had a dramatic impact on teaching, learning and assessment over the past 18 months. The most immediate threat AI posed was to Academic Integrity with Higher Education Institutes (HEIs) focusing their efforts on combating the use of GenAI in assessment. Guidelines were developed for staff and students, policies put in place too. Innovative educators have forged paths in the use of Generative AI for teaching, learning and assessments leading to pockets of transformation springing up across HEIs, often with little or no top-down guidance, support or direction.
This Gasta posits a strategic approach to integrating AI into HEIs to prepare staff, students and the curriculum for an evolving world and workplace. We will highlight the advantages of working with these technologies beyond the realm of teaching, learning and assessment by considering prompt engineering skills, industry impact, curriculum changes, and the need for staff upskilling. In contrast, not engaging strategically with Generative AI poses risks, including falling behind peers, missed opportunities and failing to ensure our graduates remain employable. The rapid evolution of AI technologies necessitates a proactive and strategic approach if we are to remain relevant.
Macroeconomics- Movie Location
This will be used as part of your Personal Professional Portfolio once graded.
Objective:
Prepare a presentation or a paper using research, basic comparative analysis, data organization and application of economic information. You will make an informed assessment of an economic climate outside of the United States to accomplish an entertainment industry objective.
How to Make a Field invisible in Odoo 17Celine George
It is possible to hide or invisible some fields in odoo. Commonly using “invisible” attribute in the field definition to invisible the fields. This slide will show how to make a field invisible in odoo 17.
Acetabularia Information For Class 9 .docxvaibhavrinwa19
Acetabularia acetabulum is a single-celled green alga that in its vegetative state is morphologically differentiated into a basal rhizoid and an axially elongated stalk, which bears whorls of branching hairs. The single diploid nucleus resides in the rhizoid.
2. ALGORITHMS AND FLOWCHARTS
A typical programming task can be divided into
two phases:
Problem solving phase
produce an ordered sequence of steps that describe
solution of problem
this sequence of steps is called an algorithm
Implementation phase
implement the program in some programming
language
3. Steps in Problem Solving
First produce a general algorithm (one can use
pseudocode)
Refine the algorithm successively to get step by
step detailed algorithm that is very close to a
computer language.
Pseudocode is an artificial and informal
language that helps programmers develop
algorithms. Pseudocode is very similar to
everyday English.
4. Pseudocode & Algorithm
Example 1: Write an algorithm to
determine a student’s final grade and
indicate whether it is passing or failing.
The final grade is calculated as the
average of four marks.
5. Pseudocode & Algorithm
Pseudocode:
Input a set of 4 marks
Calculate their average by summing and dividing
by 4
if average is below 50
Print “FAIL”
else
Print “PASS”
7. The Flowchart
(Dictionary) A schematic representation of a sequence of
operations, as in a manufacturing process or computer
program.
(Technical) A graphical representation of the sequence
of operations in an information system or program.
Information system flowcharts show how data flows from
source documents through the computer to final
distribution to users. Program flowcharts show the
sequence of instructions in a single program or
subroutine. Different symbols are used to draw each
type of flowchart.
8. The Flowchart
A Flowchart
shows logic of an algorithm
emphasizes individual steps and their
interconnections
e.g. control flow from one action to the next
9. Flowchart Symbols
Basic
Oval
Parallelogram
Rectangle
Diamond
Hybrid
Name Symbol Use in Flowchart
Denotes the beginning or end of the program
Denotes an input operation
Denotes an output operation
Denotes a decision (or branch) to be made.
The program should continue along one of
two routes. (e.g. IF/THEN/ELSE)
Denotes a process to be carried out
e.g. addition, subtraction, division etc.
Flow line Denotes the direction of logic flow in the program
10. Example
PRINT
“PASS”
Step 1: Input M1,M2,M3,M4
Step 2: GRADE (M1+M2+M3+M4)/4
Step 3: if (GRADE <50) then
Print “FAIL”
else
Print “PASS”
endif
START
Input
M1,M2,M3,M4
GRADE(M1+M2+M3+M4)/4
IS
GRADE<5
0
PRINT
“FAIL”
STOP
Y
N
11. Example 2
Write an algorithm and draw a flowchart to
convert the length in feet to centimeter.
Pseudocode:
Input the length in feet (Lft)
Calculate the length in cm (Lcm) by
multiplying LFT with 30
Print length in cm (LCM)
13. Example 3
Write an algorithm and draw a flowchart that
will read the two sides of a rectangle and
calculate its area.
Pseudocode
Input the width (W) and Length (L) of a rectangle
Calculate the area (A) by multiplying L with W
Print A
14. Example 3
Algorithm
Step 1: Input W,L
Step 2: A L x W
Step 3: Print A
START
Input
W, L
A L x W
Print
A
STOP
15. Example 4
Write an algorithm and draw a flowchart that
will calculate the roots of a quadratic equation
Hint: d = sqrt ( ), and the roots are:
x1 = (–b + d)/2a and x2 = (–b – d)/2a
2
0
ax bx c
2
4
b ac
16. Example 4
Pseudocode:
Input the coefficients (a, b, c) of the
quadratic equation
Calculate d
Calculate x1
Calculate x2
Print x1 and x2
17. Example 4
Algorithm:
Step 1: Input a, b, c
Step 2: d sqrt ( )
Step 3: x1 (–b + d) / (2 x a)
Step 4: x2 (–b – d) / (2 x a)
Step 5: Print x1, x2
START
Input
a, b, c
d sqrt(b x b – 4 x a x c)
Print
x1 ,x2
STOP
x1 (–b + d) / (2 x a)
X2 (–b – d) / (2 x a)
4
b b a c
18. DECISION STRUCTURES
The expression A>B is a logical expression
it describes a condition we want to test
if A>B is true (if A is greater than B) we take
the action on left
print the value of A
if A>B is false (if A is not greater than B) we
take the action on right
print the value of B
23. Example 6
Write an algorithm that reads two values, determines the
largest value and prints the largest value with an
identifying message.
ALGORITHM
Step 1: Input VALUE1, VALUE2
Step 2: if (VALUE1 > VALUE2) then
MAX VALUE1
else
MAX VALUE2
endif
Step 3: Print “The largest value is”, MAX
24. Example 6
MAX VALUE1
Print
“The largest value is”,
MAX
STOP
Y N
START
Input
VALUE1,VALUE2
MAX VALUE2
is
VALUE1>VALUE2
25. LOOPS
Computers are particularly well suited to
applications in which operations are
repeated many times.
If the same task is repeated over and over
again a loop can be used to reduce
program size and complexity
26. Example 7: Write an algorithm and
draw a flowchart to calculate 24 .
Algorithm:
Step 1: Base 2
Step 2: Product Base
Step 3: Product Product * Base
Step 4: Product Product * Base
Step 5: Product Product * Base
Step 6: Print Product
28. Question: What happens if you want to
calculate 2 to the power of 1000?
Answer: Use a LOOP (repeated execution
of the same set of instructions)
29. Example 8:
Write an algorithm and draw a flowchart to
calculate 24 using a loop approach? Verify
your result by a trace table.
30. Algorithm:
Step 1: Base 2
Step 2: Power 4
Step 3: Product Base
Step 4: Counter 1
Step 5: While Counter < Power
Repeat Step 5 through step 7
Step 6: Product Product * Base
Step 7: Counter Counter +1
Step 8: Print Product
31. START
Product Base
Counter 1
Print
Product
STOP
Y
is
Counter < Power
Product Product * Base
Counter Counter + 1
N
Base 2
Power 4
32. TRACING
BASE POWER PRODUCT COUNTER COUNTER < POWER
STEP 1: 2 ? ? ? ?
STEP 2: 2 4 ? ? ?
STEP 3: 2 4 2 ? ?
STEP 4: 2 4 2 1 T
STEP 5: 2 4 2 1 T
STEP 6: 2 4 2x2=4 1 T
STEP 7: 2 4 4 1+1=2 T
STEP 5: 2 4 4 2 T
STEP 6: 2 4 4x2=8 2 T
STEP 7: 2 4 8 2+1=3 T
STEP 5: 2 4 8 3 T
STEP 6: 2 4 8x2=16 3 T
STEP 7: 2 4 16 3+1=4 F
STEP 5: 2 4 16 4 F
STEP 8: print 16.
Step 1: Base 2
Step 2: Power 4
Step 3: Product Base
Step 4: Counter 1
Step 5: While Counter < Power
Repeat Step 5 through
step 7
Step 6: Product Product *
Base
Step 7: Counter Counter +1
Step 8: Print Product
33. Example 10: Write down an algorithm and
draw a flowchart to find and print the
largest of three numbers. Read numbers
one by one. Verify your result by a trace
table. (Use 5, 7, 3 as the numbers read)
34. Algorithm
Step 1: Input N1
Step 2: Max N1
Step 3: Input N2
Step 4: If (N2>Max) then
Max = N2
endif
Step 5: Input N3
Step 6: If (N3>Max) then
Max = N3
endif
Step 7: Print “The largest number is:”,Max
36. Example 11: Write down an algorithm and
draw a flowchart to find and print the
largest of N (N can be any number)
numbers. Read numbers one by one.
Verify your result by a trace table.
(Assume N to be 5 and the following set to
be the numbers {1 4 2 6 8 })
37. Algorithm:
Step 1: Input N
Step 2: Input X
Step 3: Max Current
Step 4: Counter 1
Step 5: While (Counter < N)
Repeat steps 5 through 8
Step 6: Counter Counter + 1
Step 7: Input X
Step 8: If (X > Max) then
Max X
endif
Step 9: Print Max
38. N X Max Cou
nter
Count
er < N
Next >
Max
Step 1
Step 2
Step 3
Step 4
Step 5
Step 6
Step 7
Step 8
Step 5
Step 6
Step 7
Step 8
Step 5
Step 6
Step 7
Step 8
Step 5
Step 6
Step 7
Step 8
Step 5
Step 9
5
5
5
5
5
5
5
5
5
5
5
5
5
5
5
5
5
5
5
5
5
1
1
1
1
1
1
4
4
4
4
2
2
2
2
6
6
6
6
8
8
8
1
1
1
1
1
4
4
4
4
4
4
4
4
6
6
6
6
8
8
8
output
1
1
2
2
2
2
3
3
3
3
4
4
4
4
5
5
5
5
T
T
T
T
T
T
T
T
T
T
T
T
T
T
F
F
F
F
T
F
F
F
F
F
F
T
T
F
F
T
T
F
START
Input
N, X
Max X
Print
Max
STOP
Y
Counter < N
N
Counter 1
Counter Counter +1
Input
X
X>Max
Y
N
Max X
1
2
3
4
5
6
7
8
9
Tracing
How many times will steps 4, 6, and 7 be executed?
39. Do Loops
It is convenient to introduce a special type
of loop that is headed by a special
macroinstructions.
This terminology comes from FORTRAN ,
although many programming languages
have this type of loop.
40. For example :
BASIC
DO K=1 to N
{body of loop}
END;
FORTRAN
Do n K=1 , N
{body of loop}
n CONTIOUE
41.
42. Example : A company has 80
employees give a flowchart that
finds the average salary and the number
of employees earning above the average
salary. Observe that the salaries are read
into an array, SALARY. Next, the average
salary, AVG, is calculated.
Then each salary , SALARY(K), is
compared with AVG to obtain the number
NUM of salaries grater than AVG.
45. Prob. 1. Write an algorithm and draw a flowchart to
print the square of all numbers from 1 to10.
Prob. 2. Write an algorithm and draw a flowchart to
print the SUM of numbers from LOW to HIGH. Test
with LOW=3 and HIGH=9.
Prob. 3. Write an algorithm and draw a flowchart to
print all numbers between LOW and HIGH that are
divisible by NUMBER.
Prob. 4. Draw a flowchart for a program that reads
10 numbers from the user and prints out their sum,
and their product.
46. Prob. 5. Write an algorithm and draw a flowchart to
count and print all numbers from LOW to HIGH by
steps of STEP. Test with LOW=0 and HIGH=100 and
STEP=5.
Prob. 6. Write an algorithm and draw a flowchart to
print the multiplication table for 6's. i.e.
---- 1 6 = 6
---- 2 6 = 12
…
---- 12 6 = 72
Prob. 7. Write an algorithm and draw a flowchart that
will find and print the product of 3 numbers.
47.
Prob. 8. Write an algorithm and draw a
flowchart that will find and print
The factorial of NUMBER is FACTORIAL.
Test the flowchart for NUMBER=5.