Downloaded 119 times


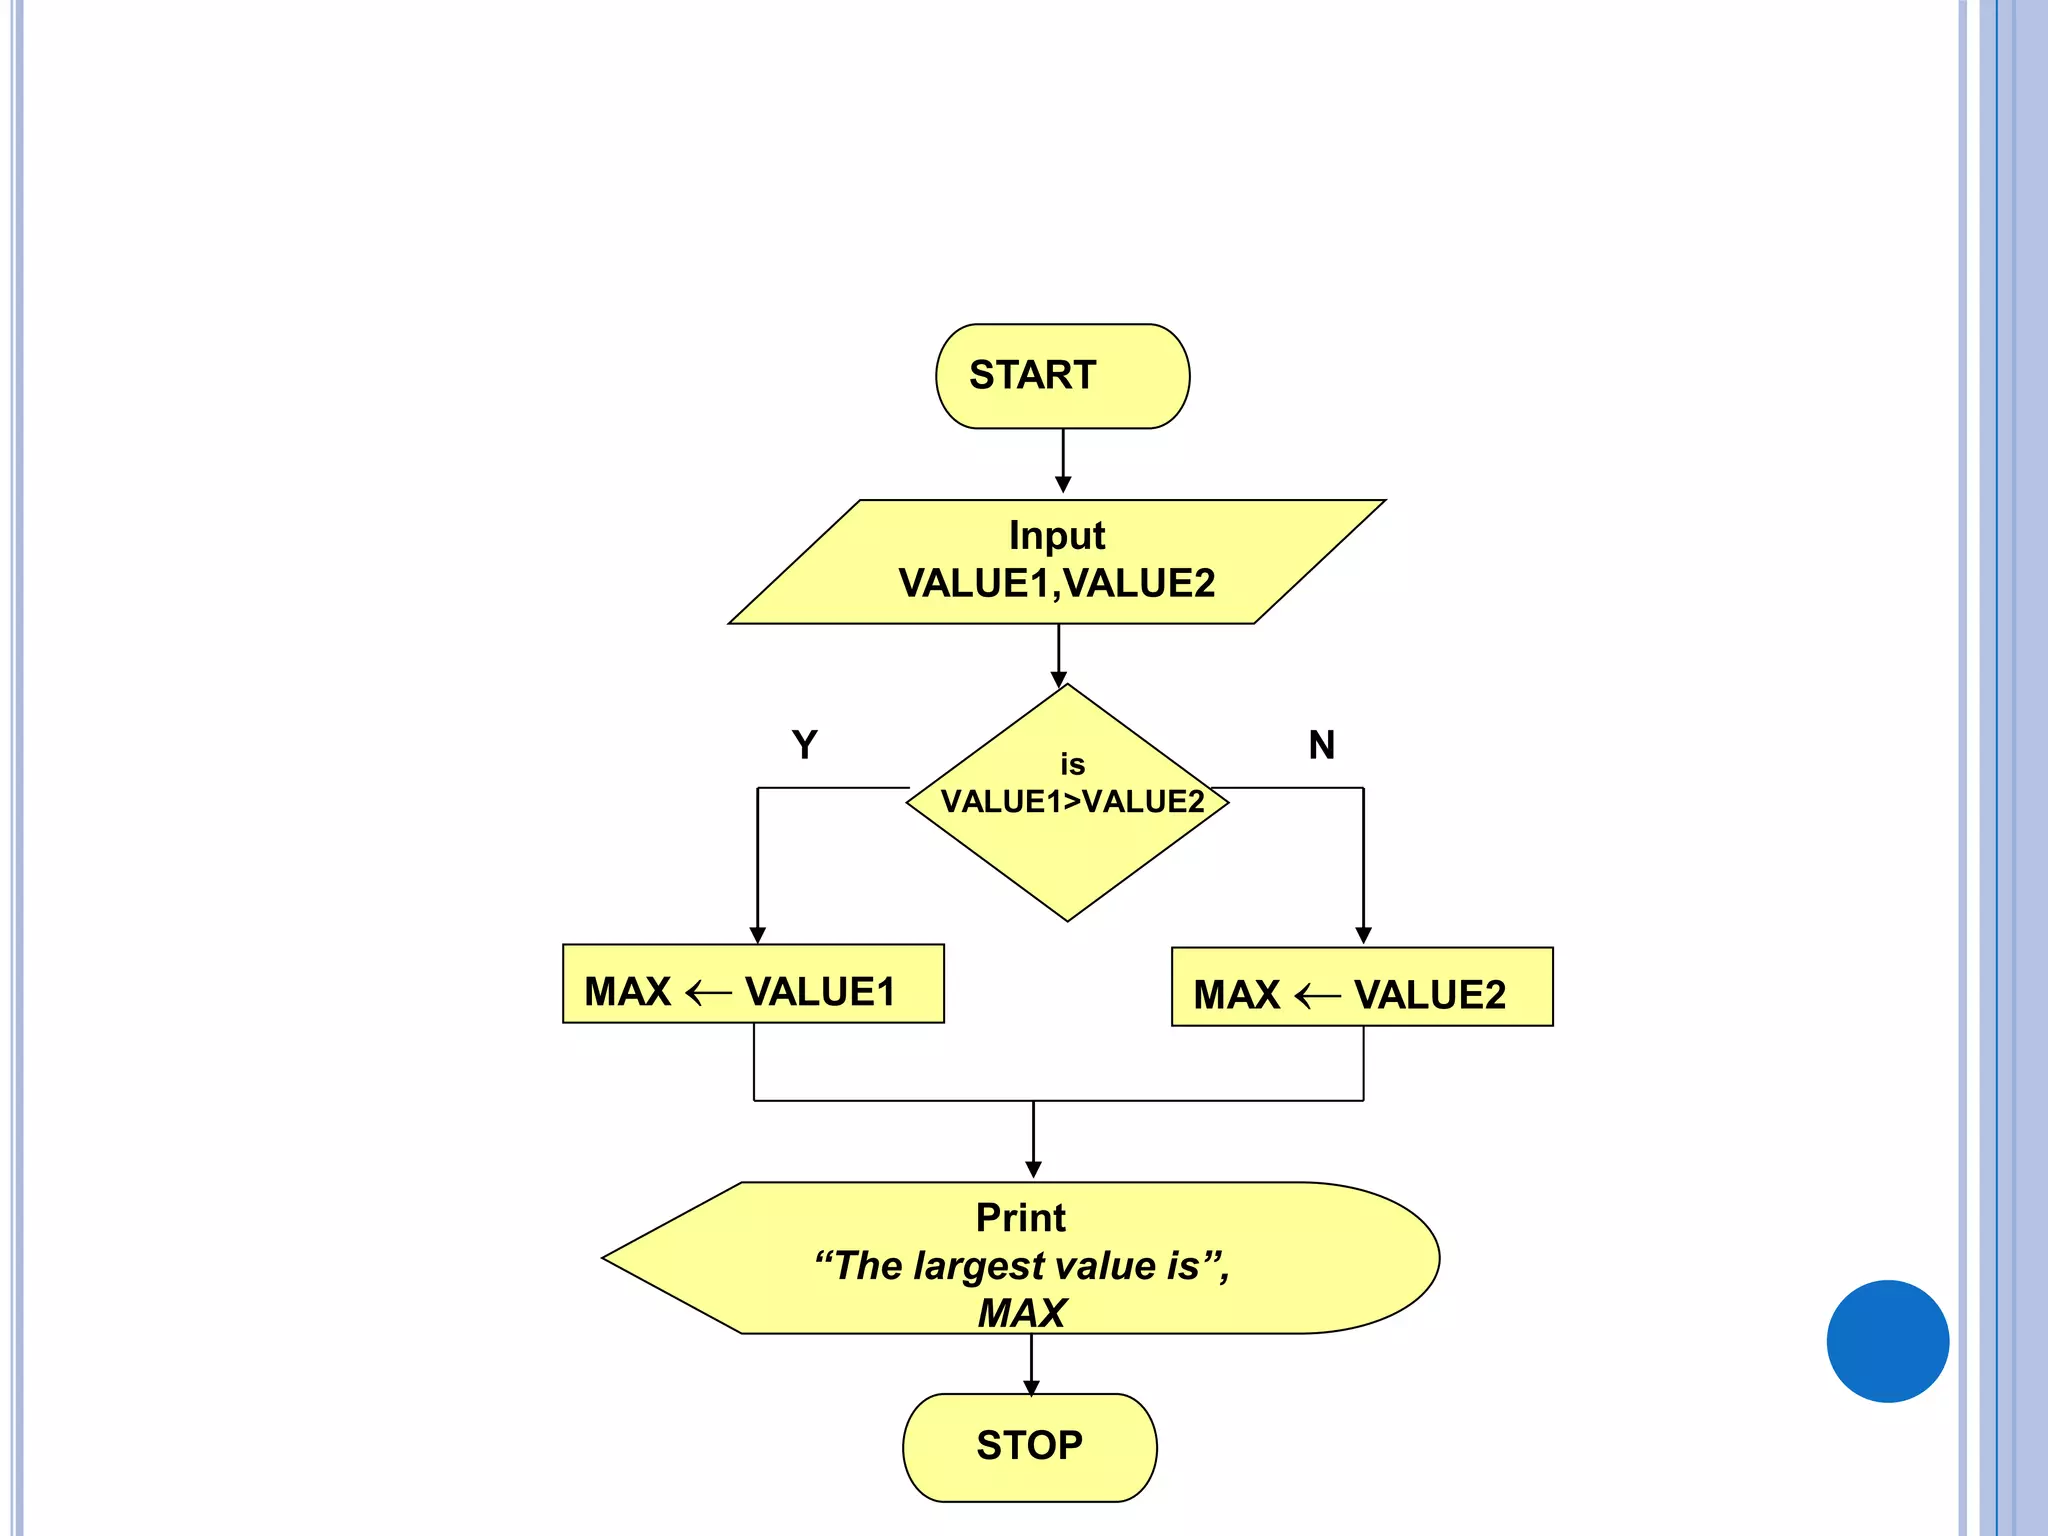
![Step 1: Input N1, N2, N3
Step 2: if (N1>N2) then
if (N1>N3) then
MAX N1 [N1>N2, N1>N3]
else
MAX N3 [N3>N1>N2]
endif
else
if (N2>N3) then
MAX N2 [N2>N1, N2>N3]
else
MAX N3 [N3>N2>N1]
endif
endif
Step 3: Print “The largest number is”, MAX](https://image.slidesharecdn.com/algorithmsandflowcharts-161121143206/75/Algorithms-and-flowcharts-32-2048.jpg)
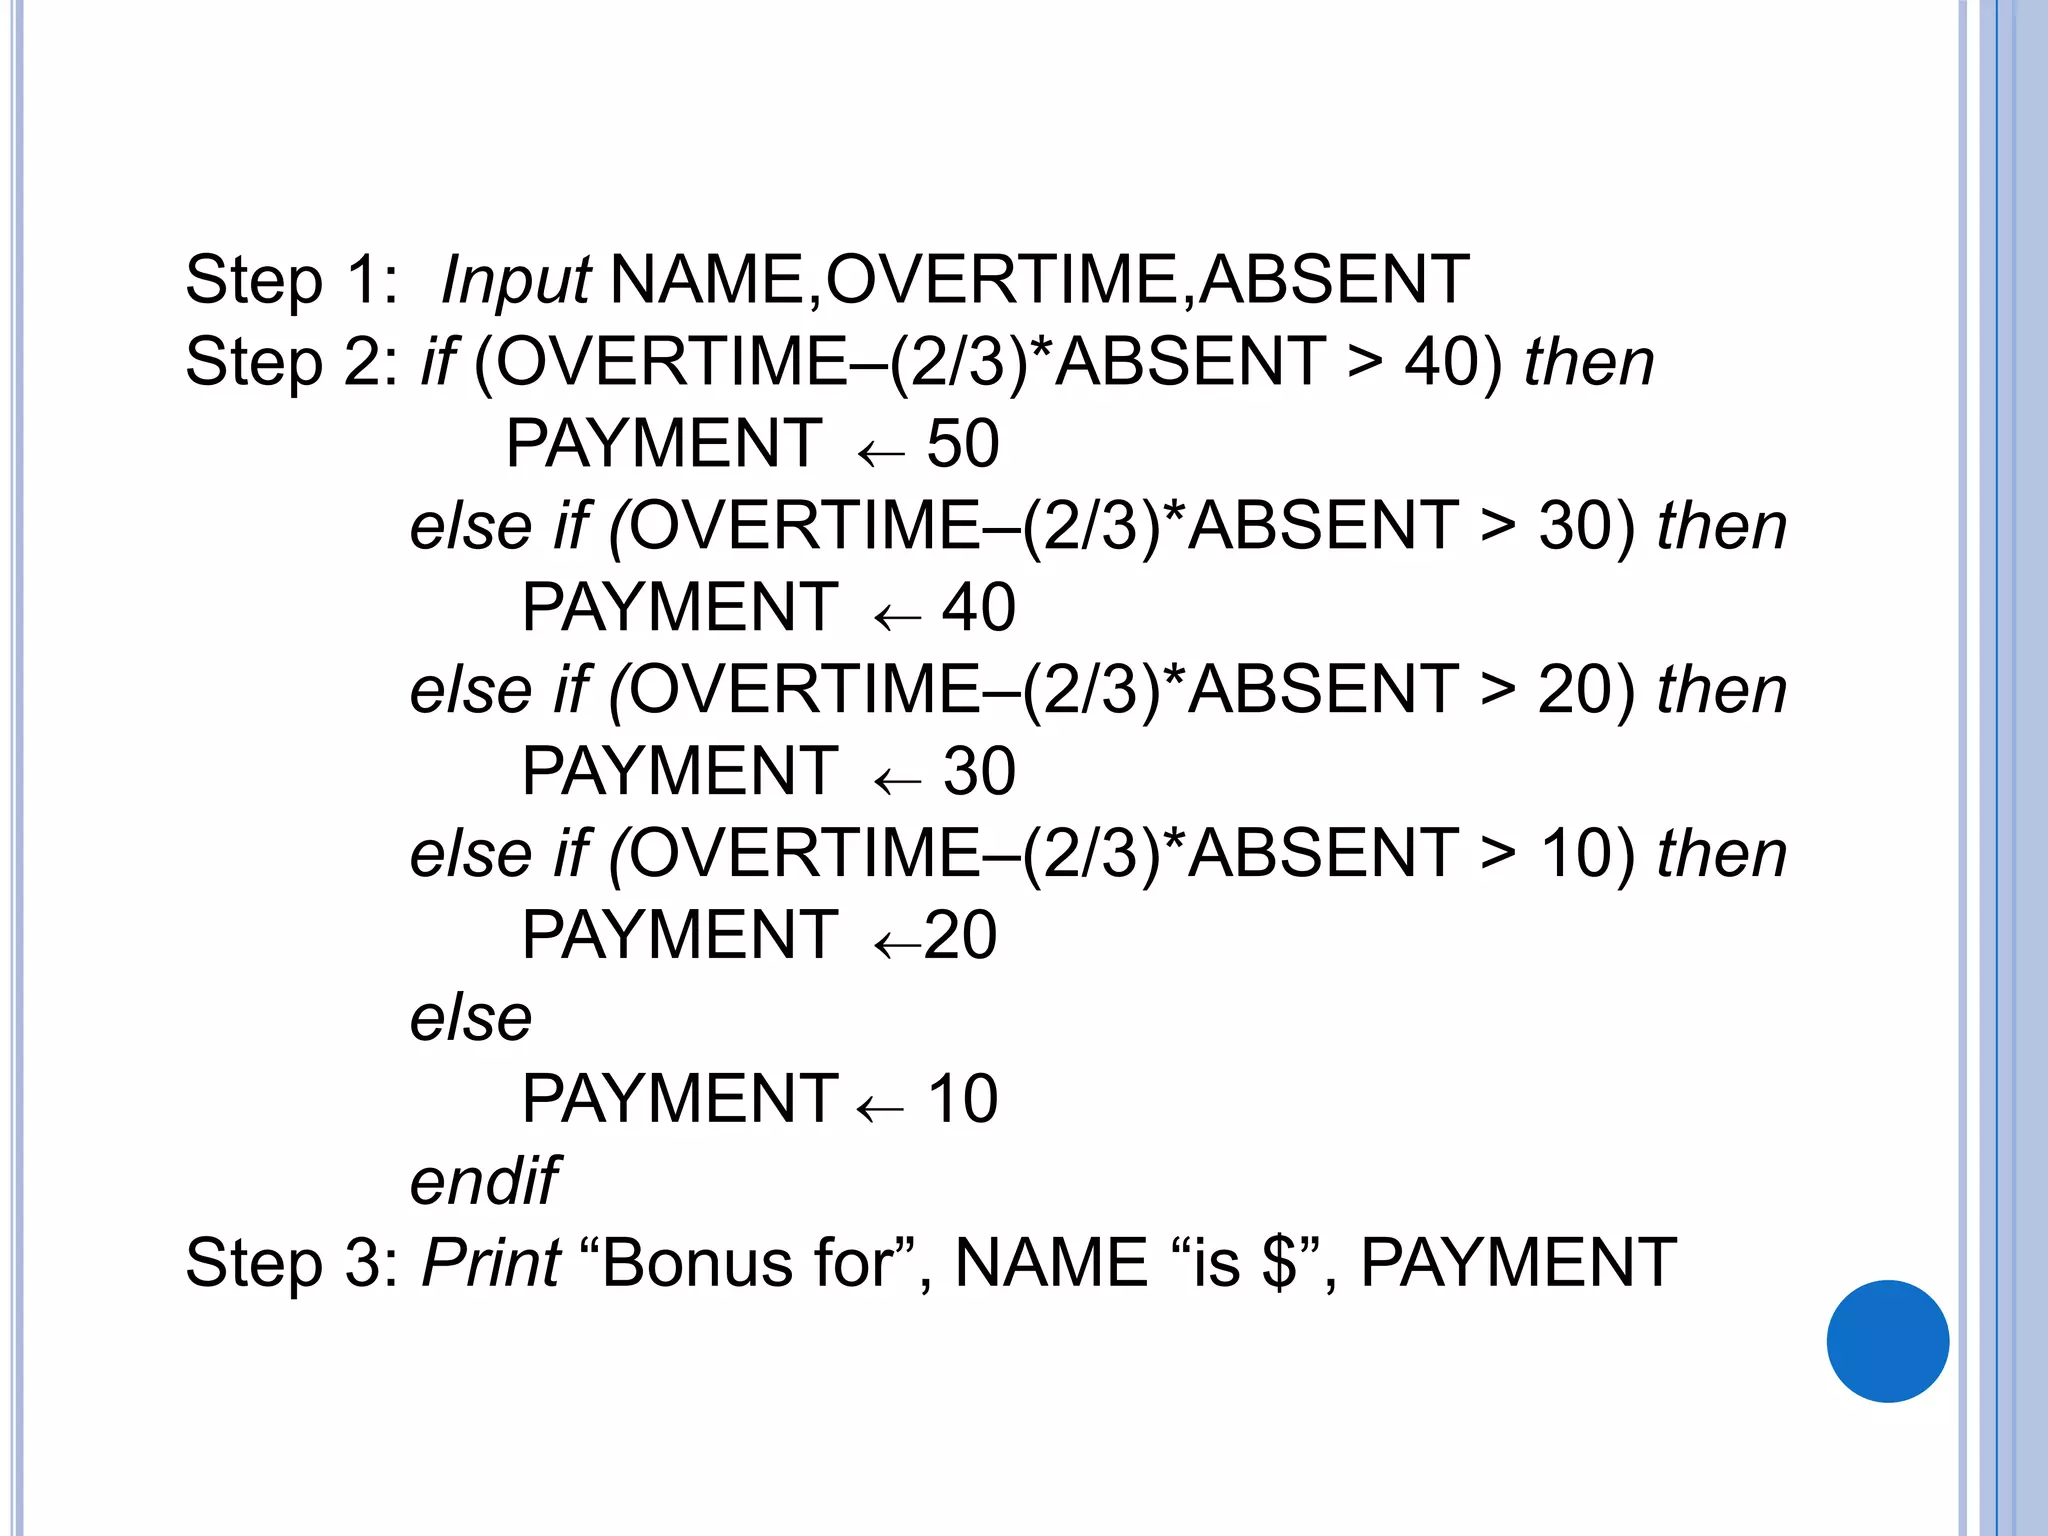
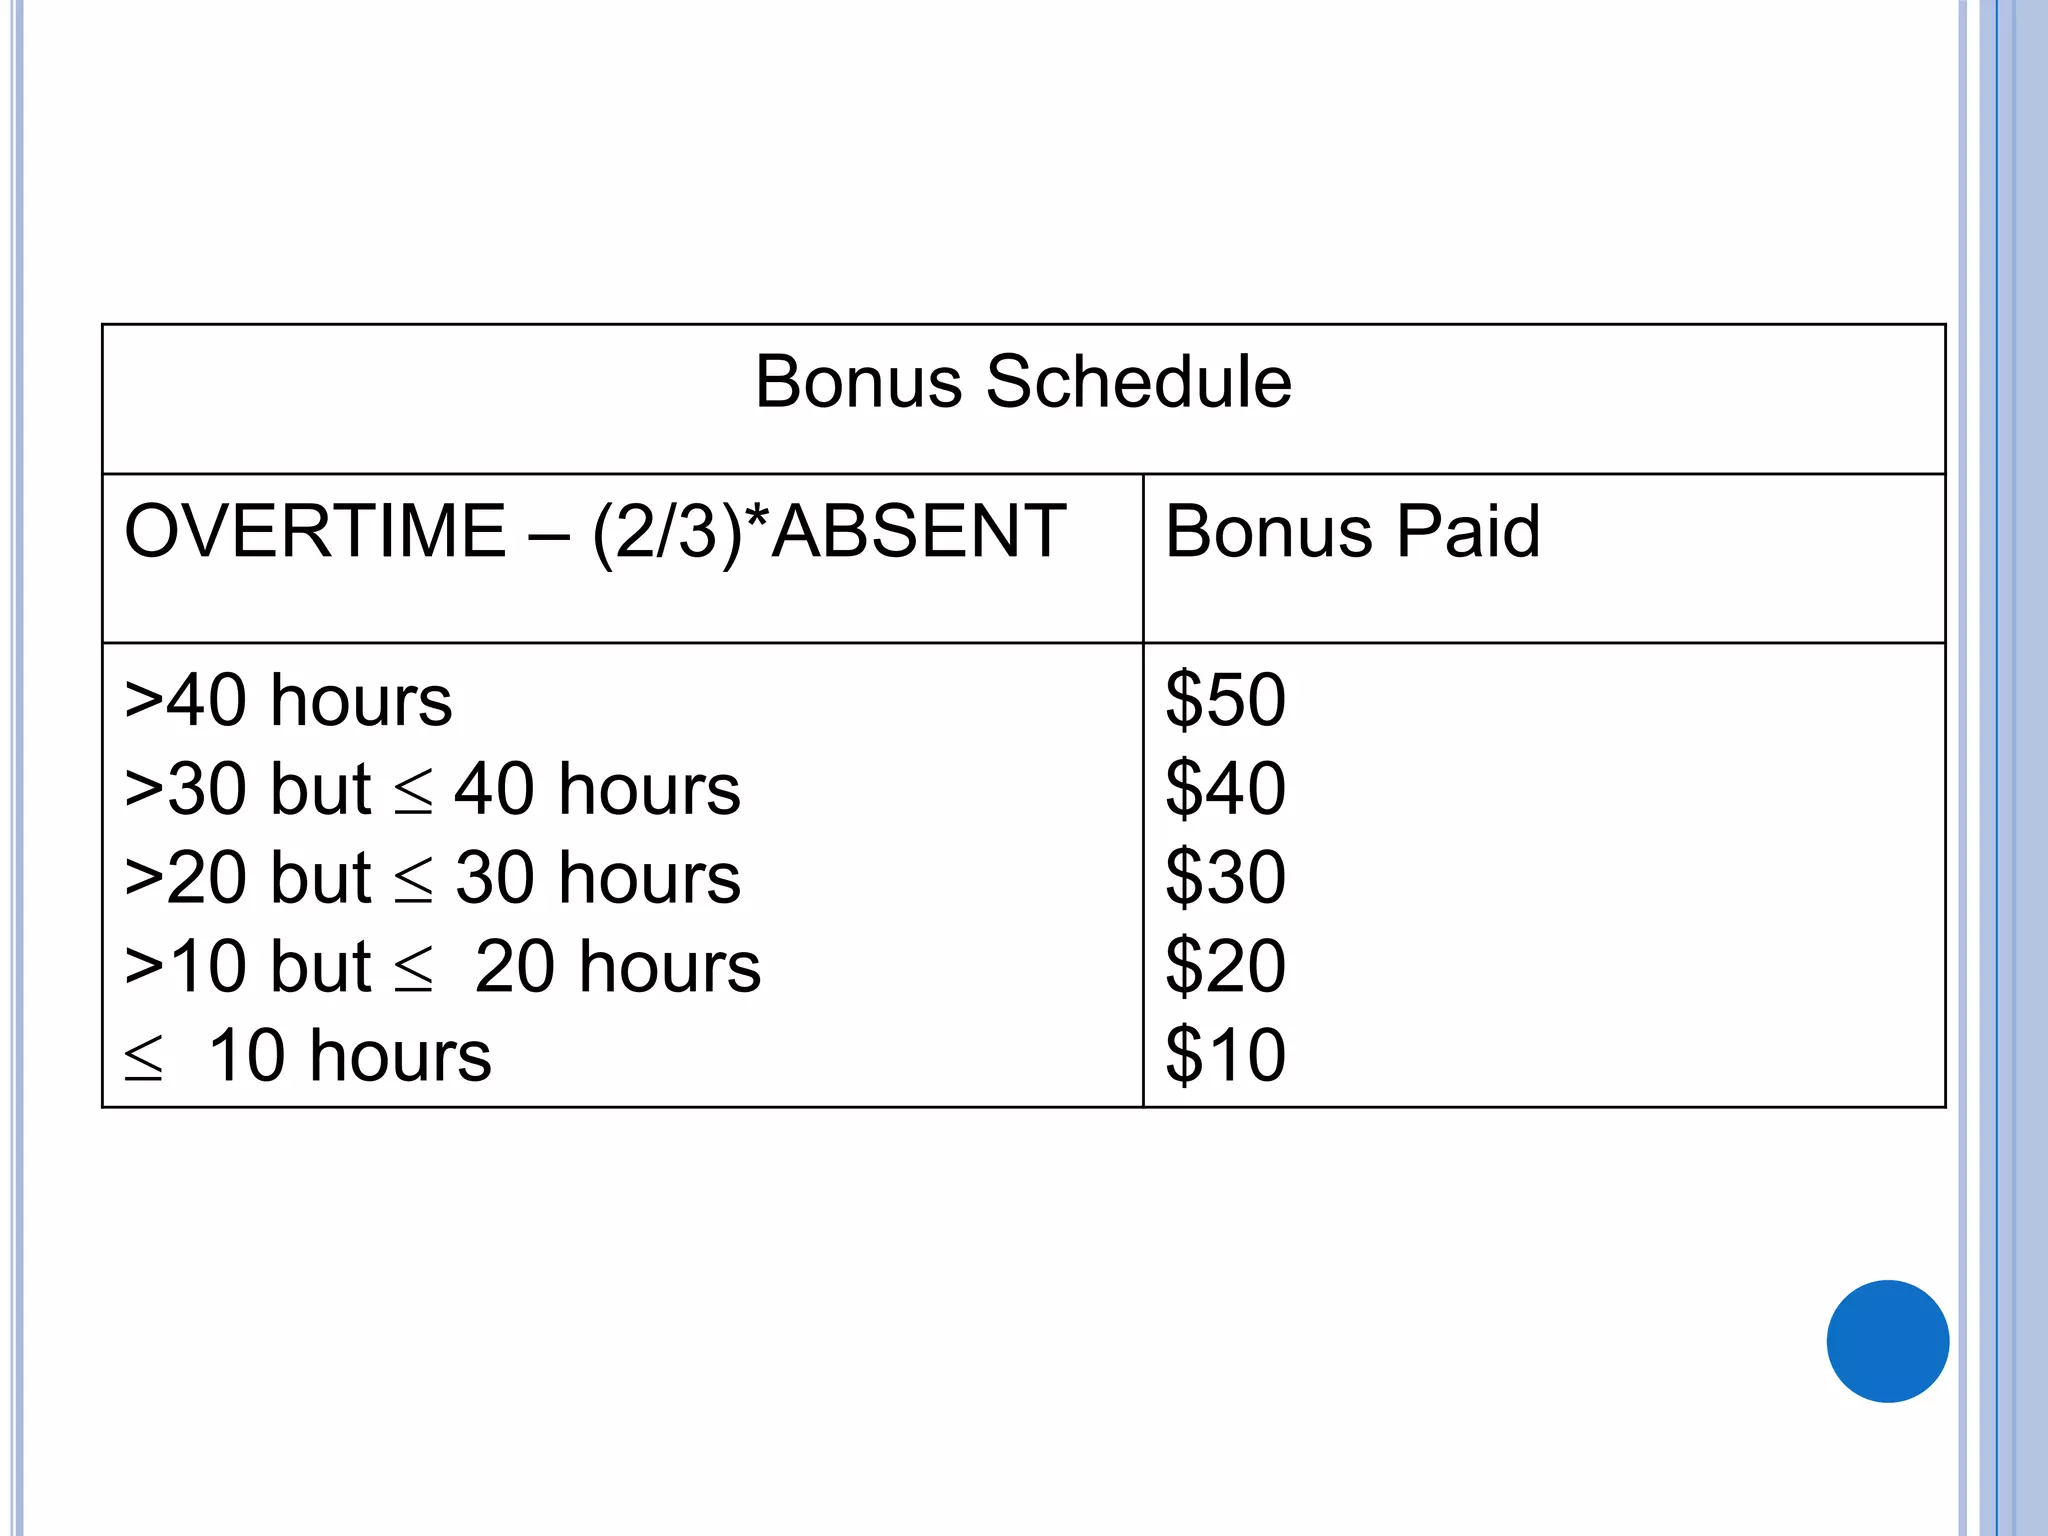


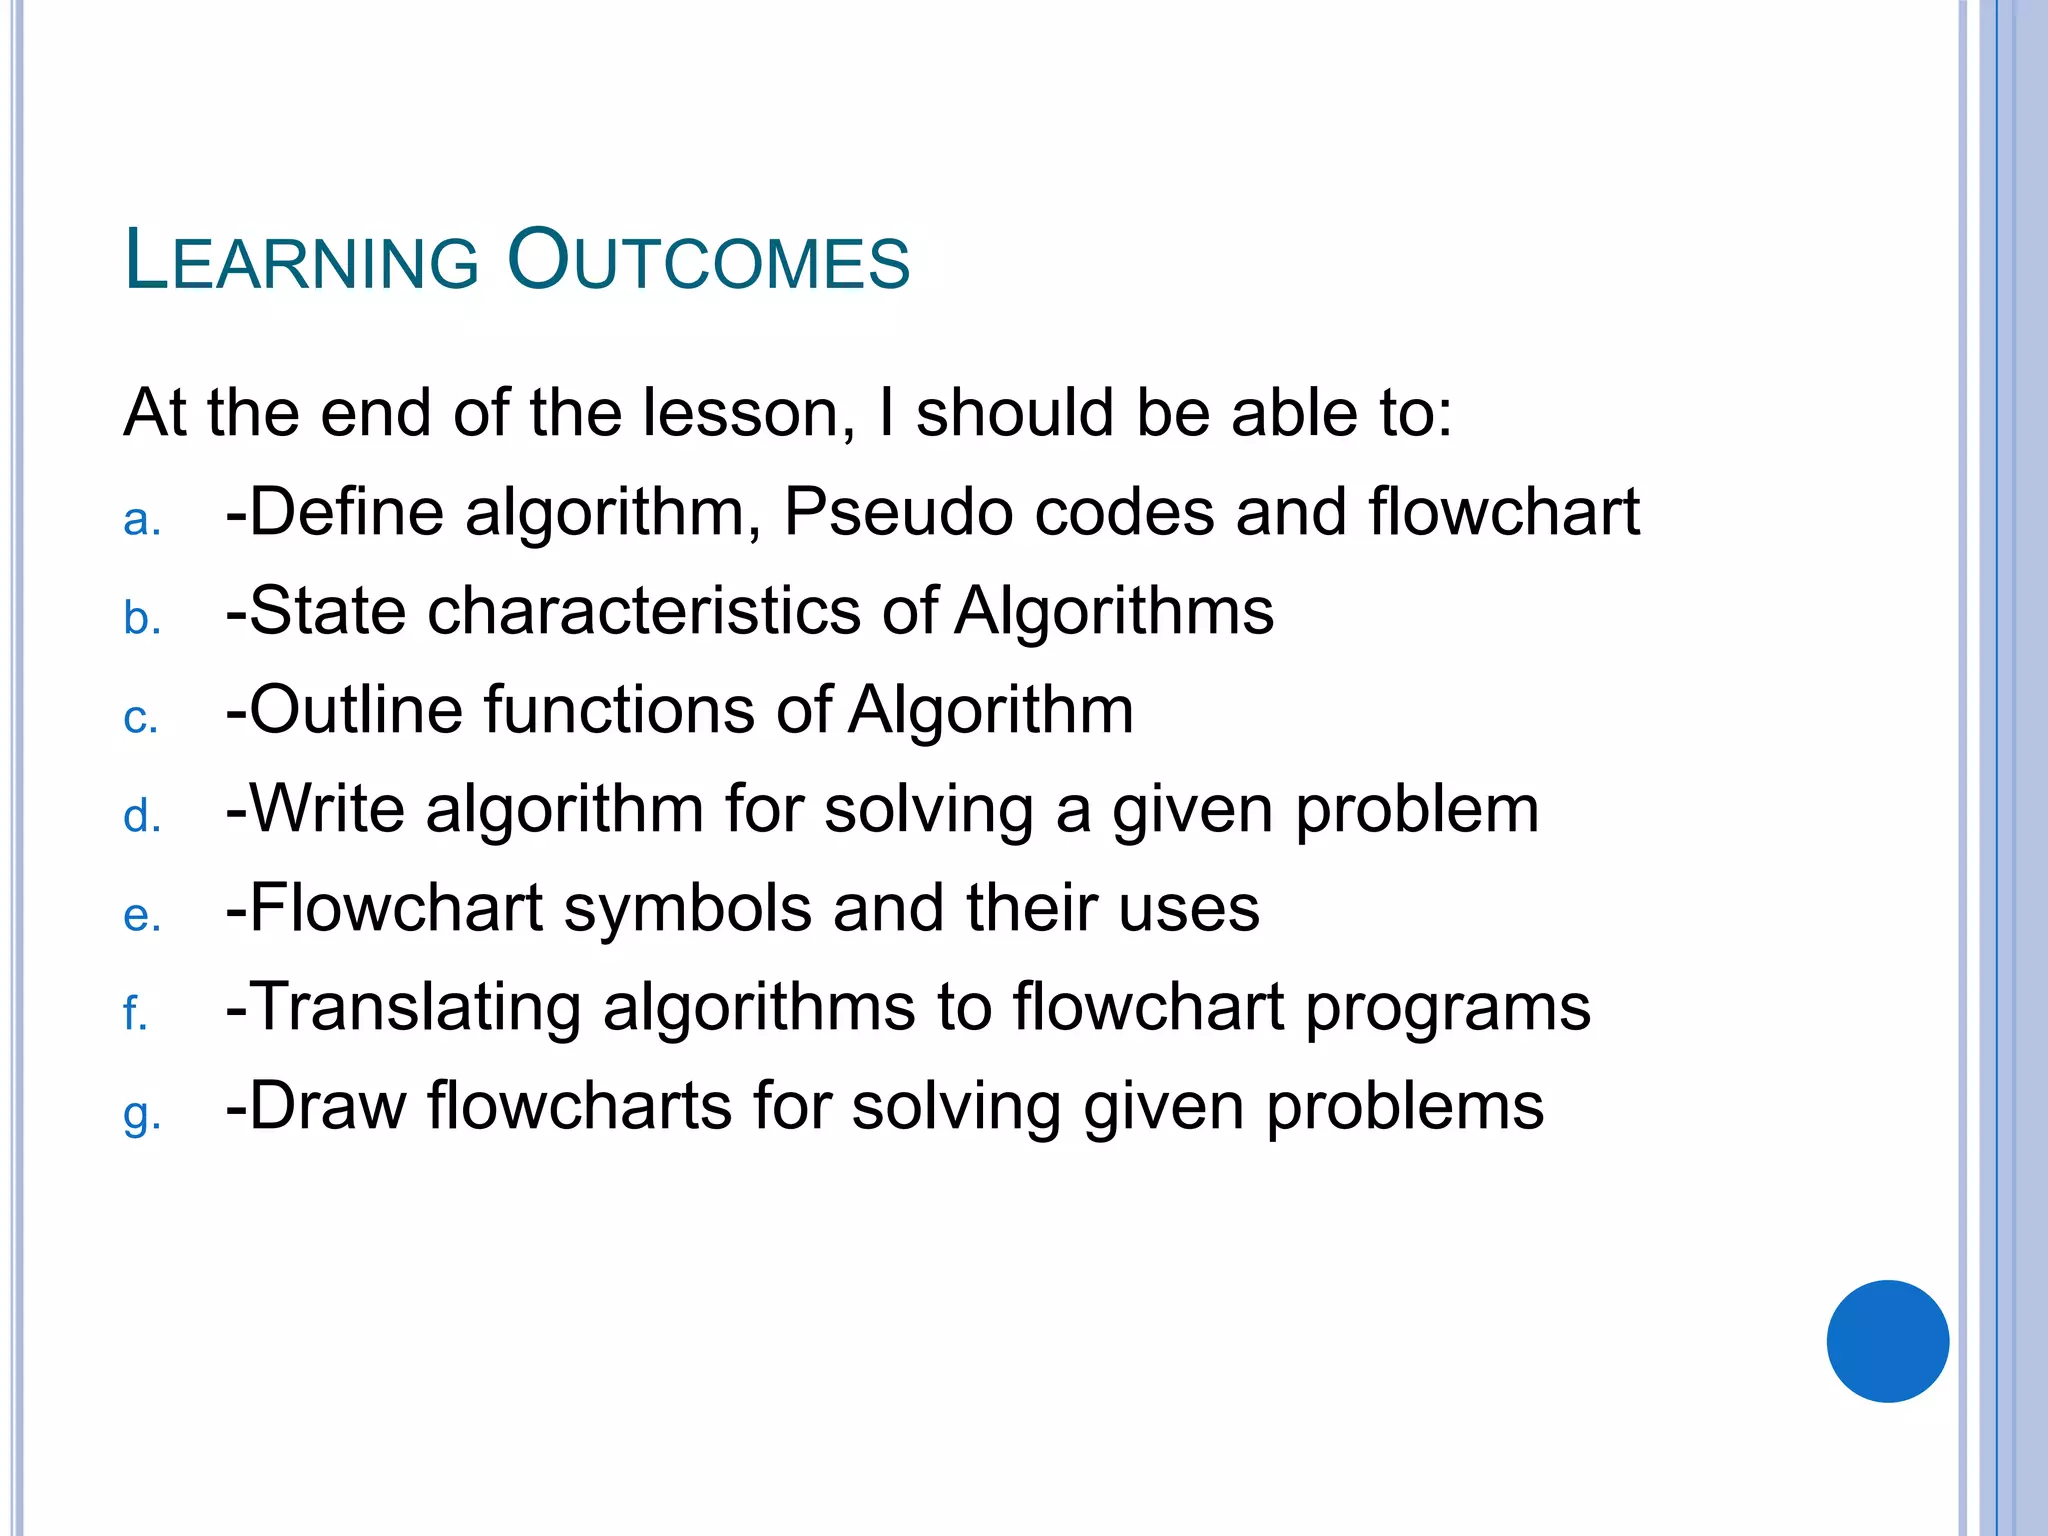
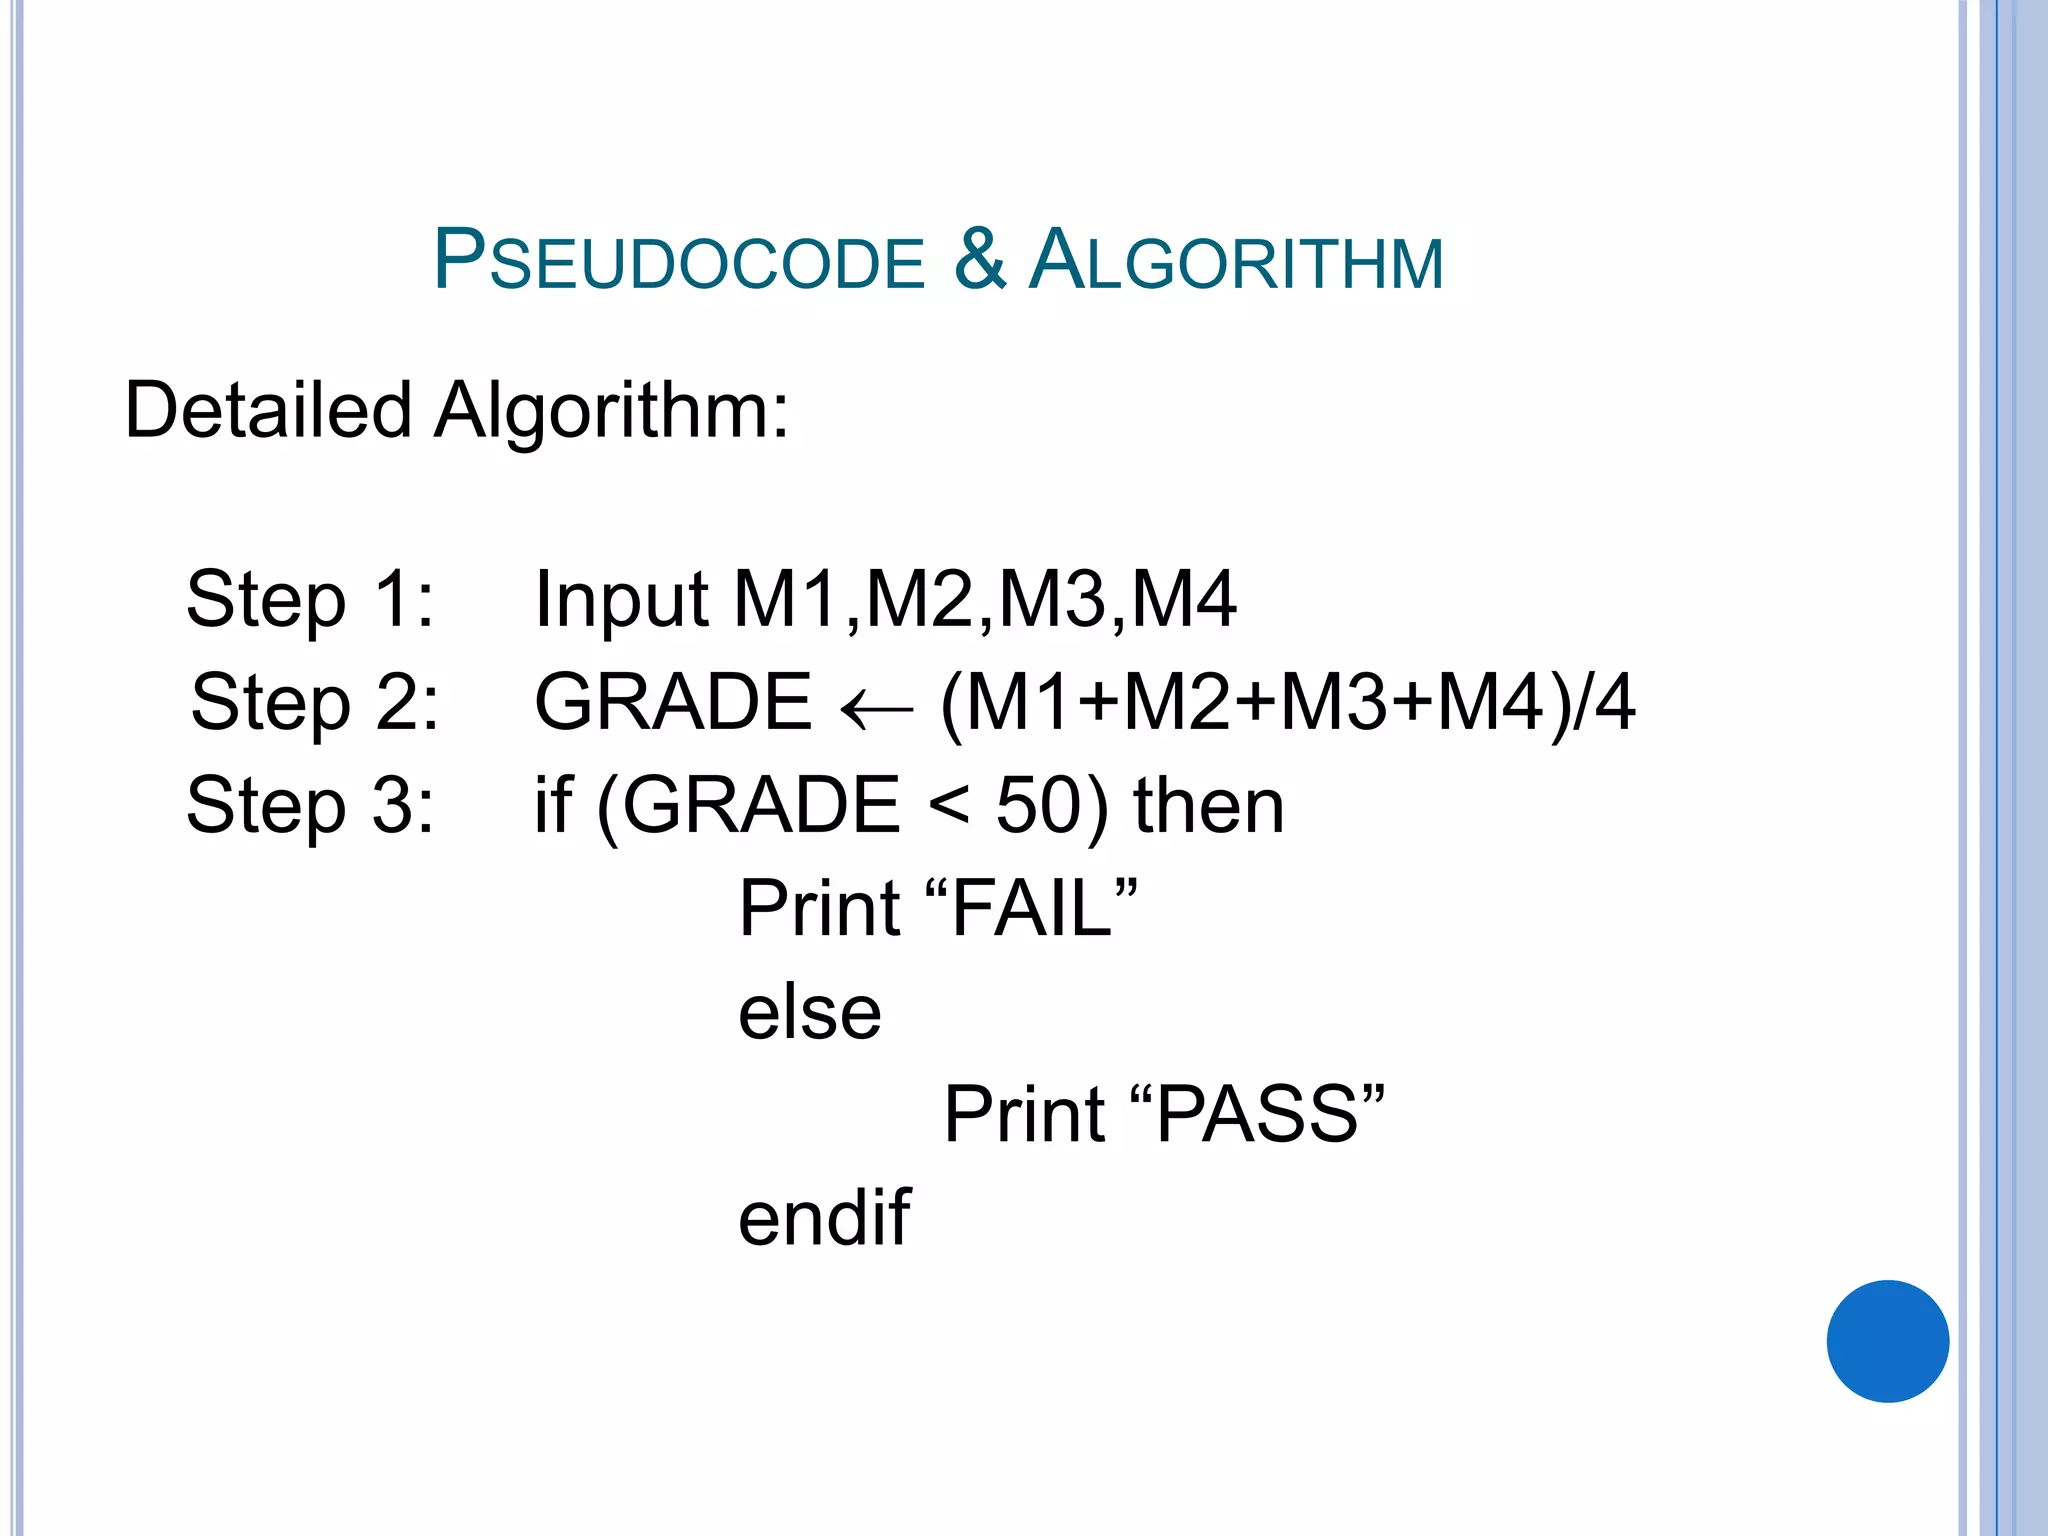
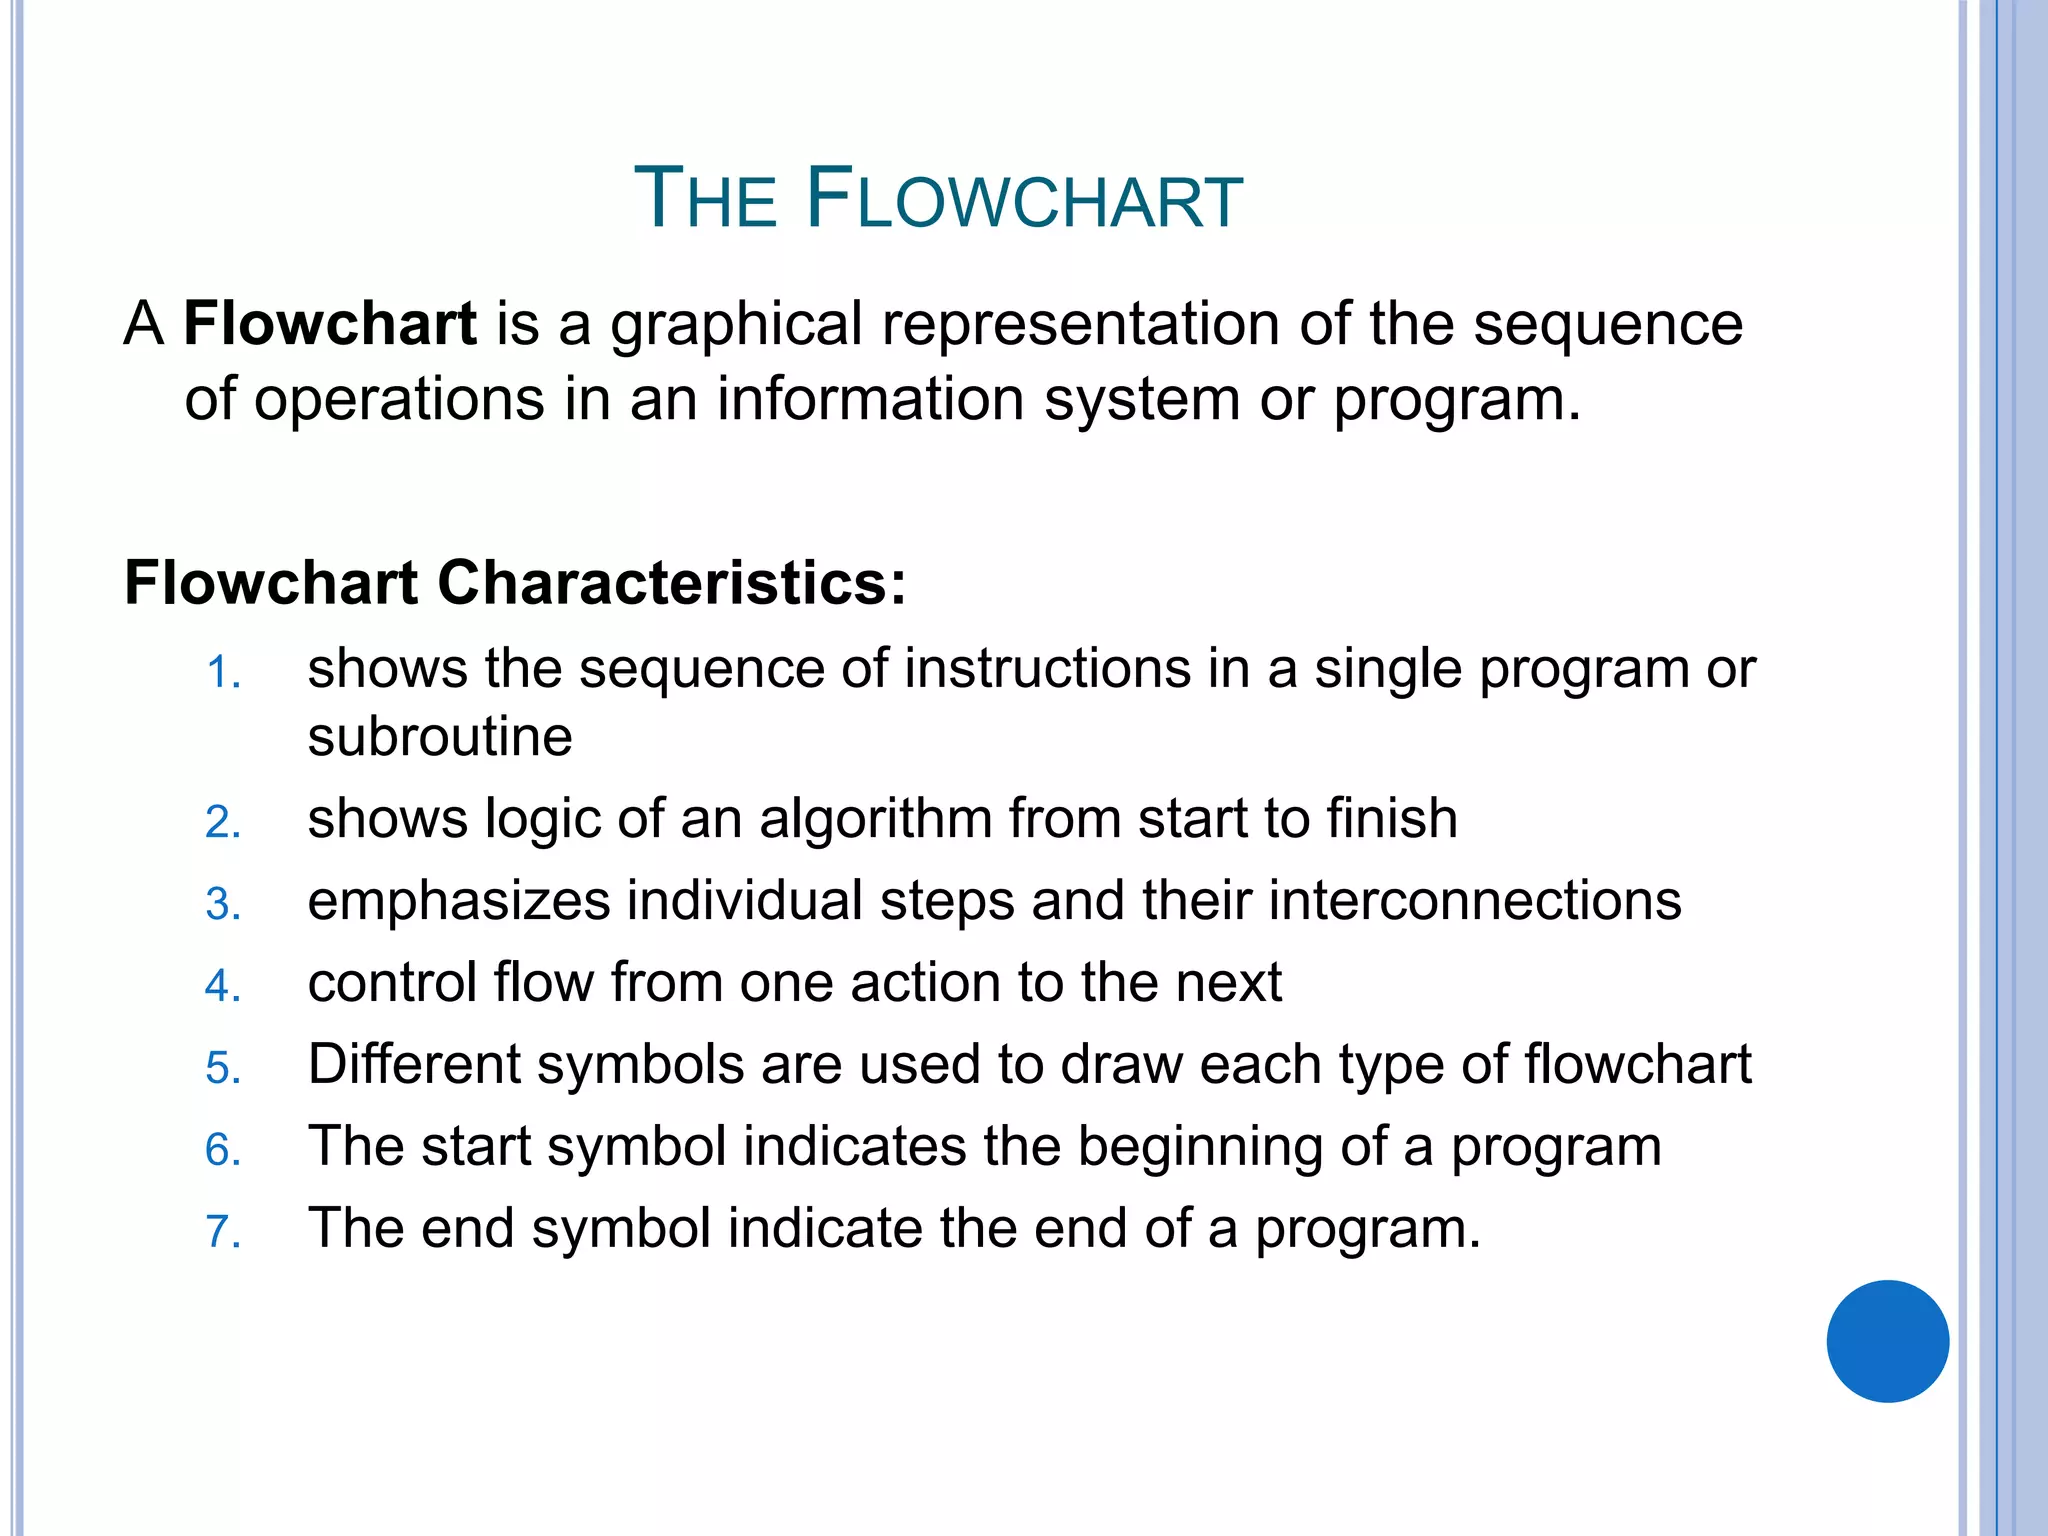
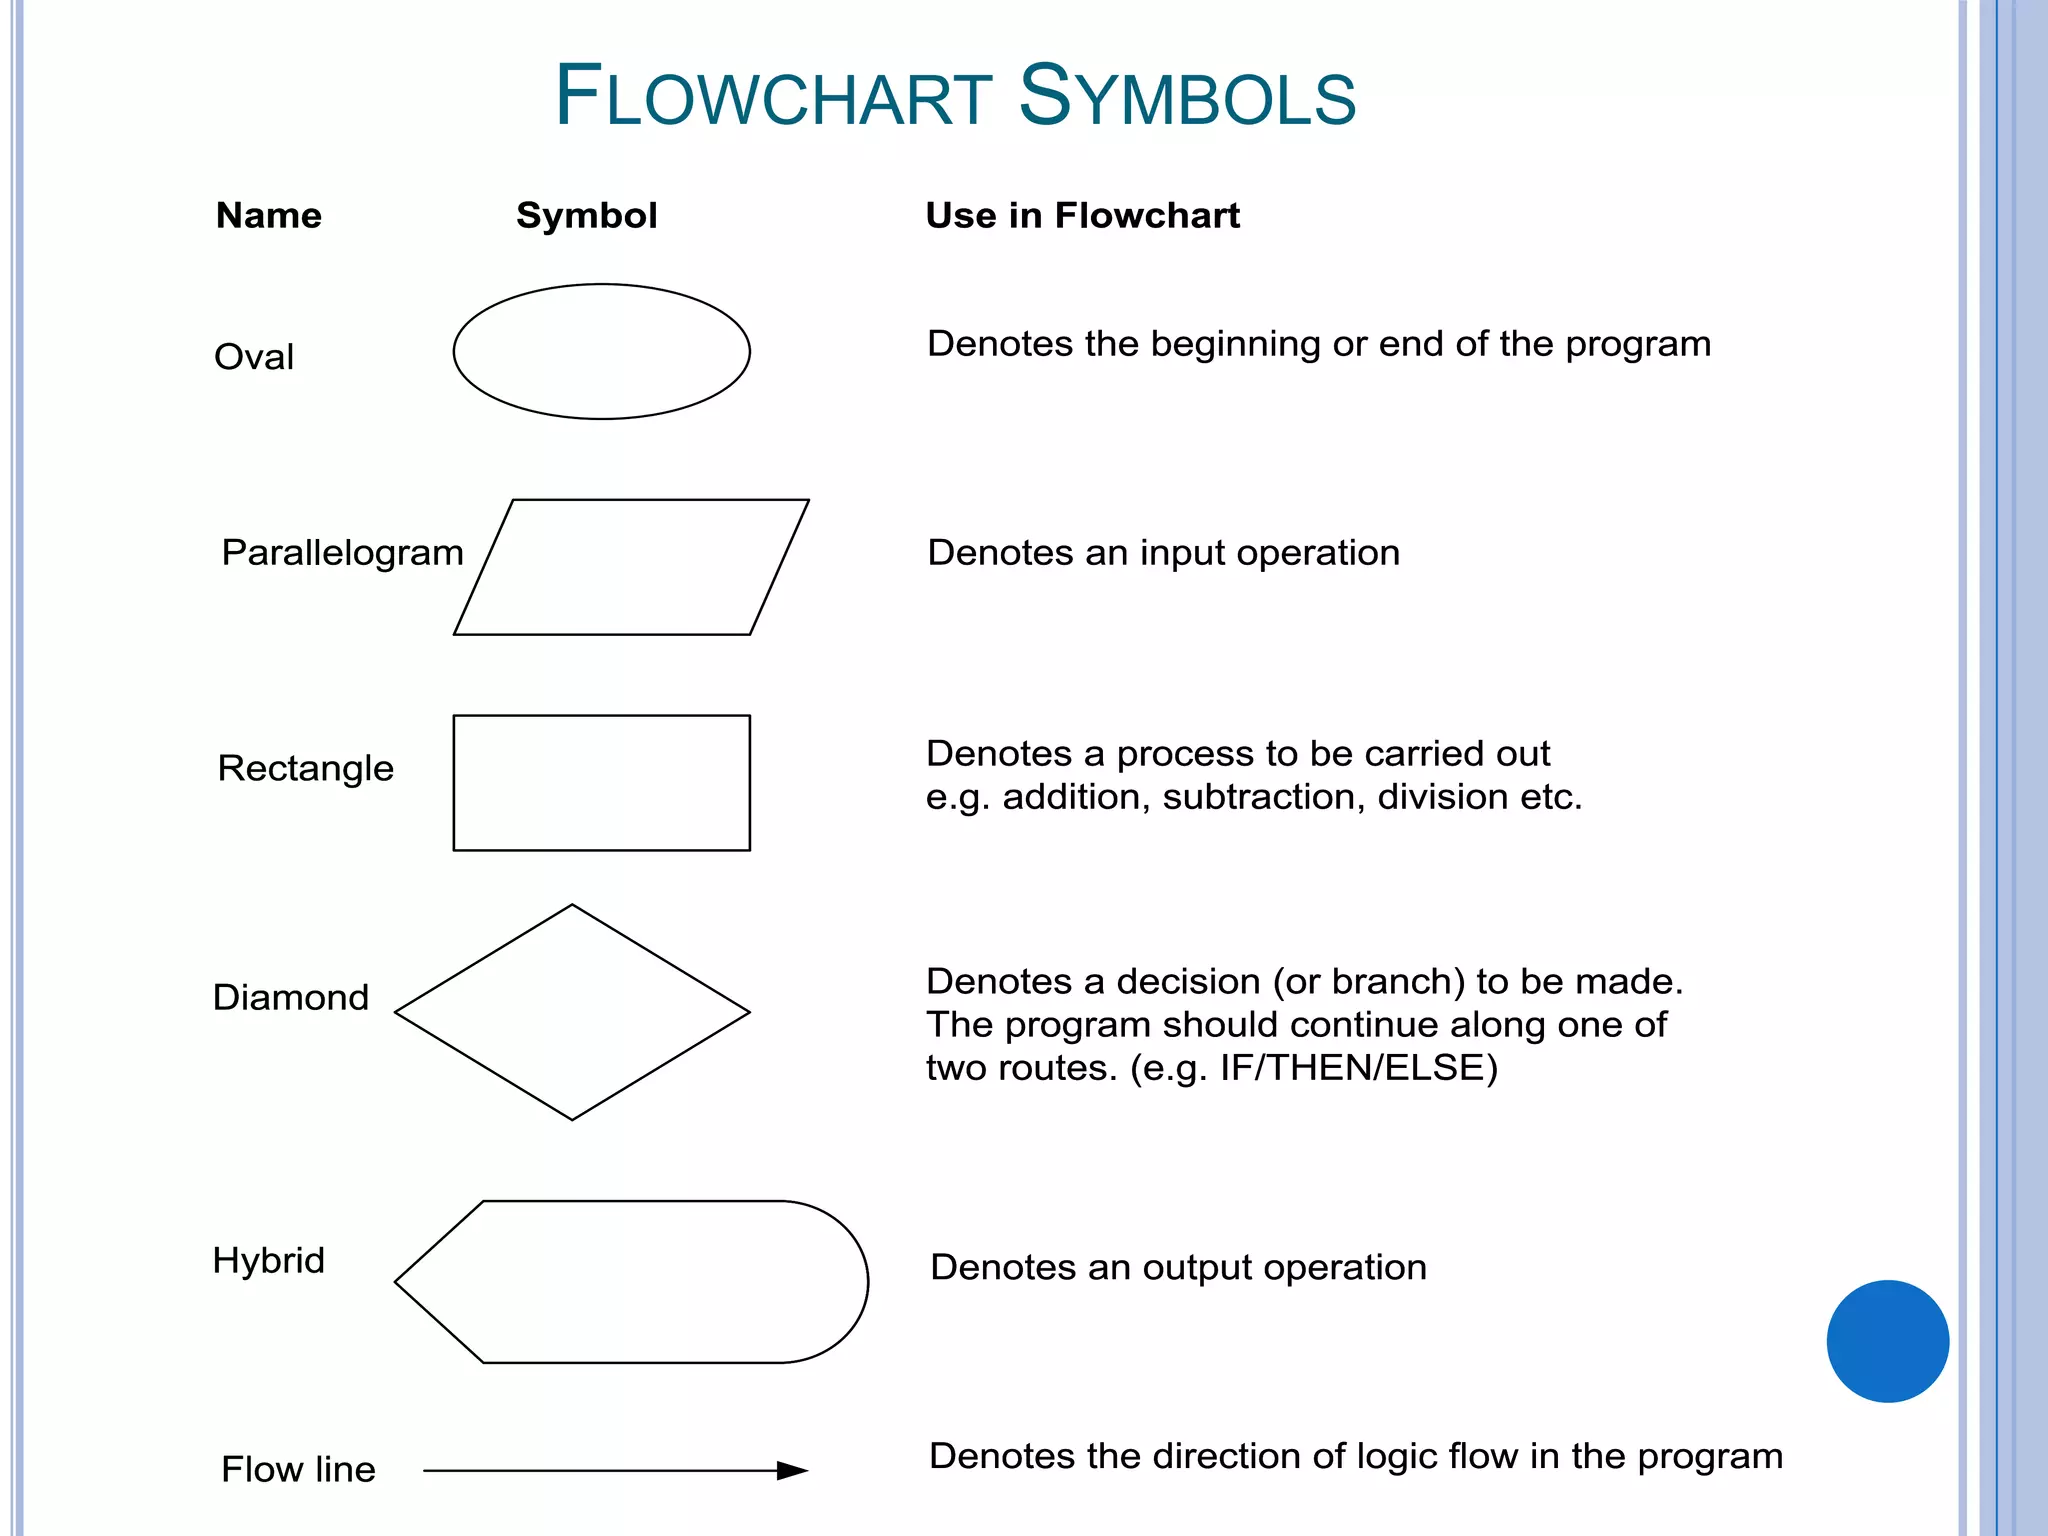
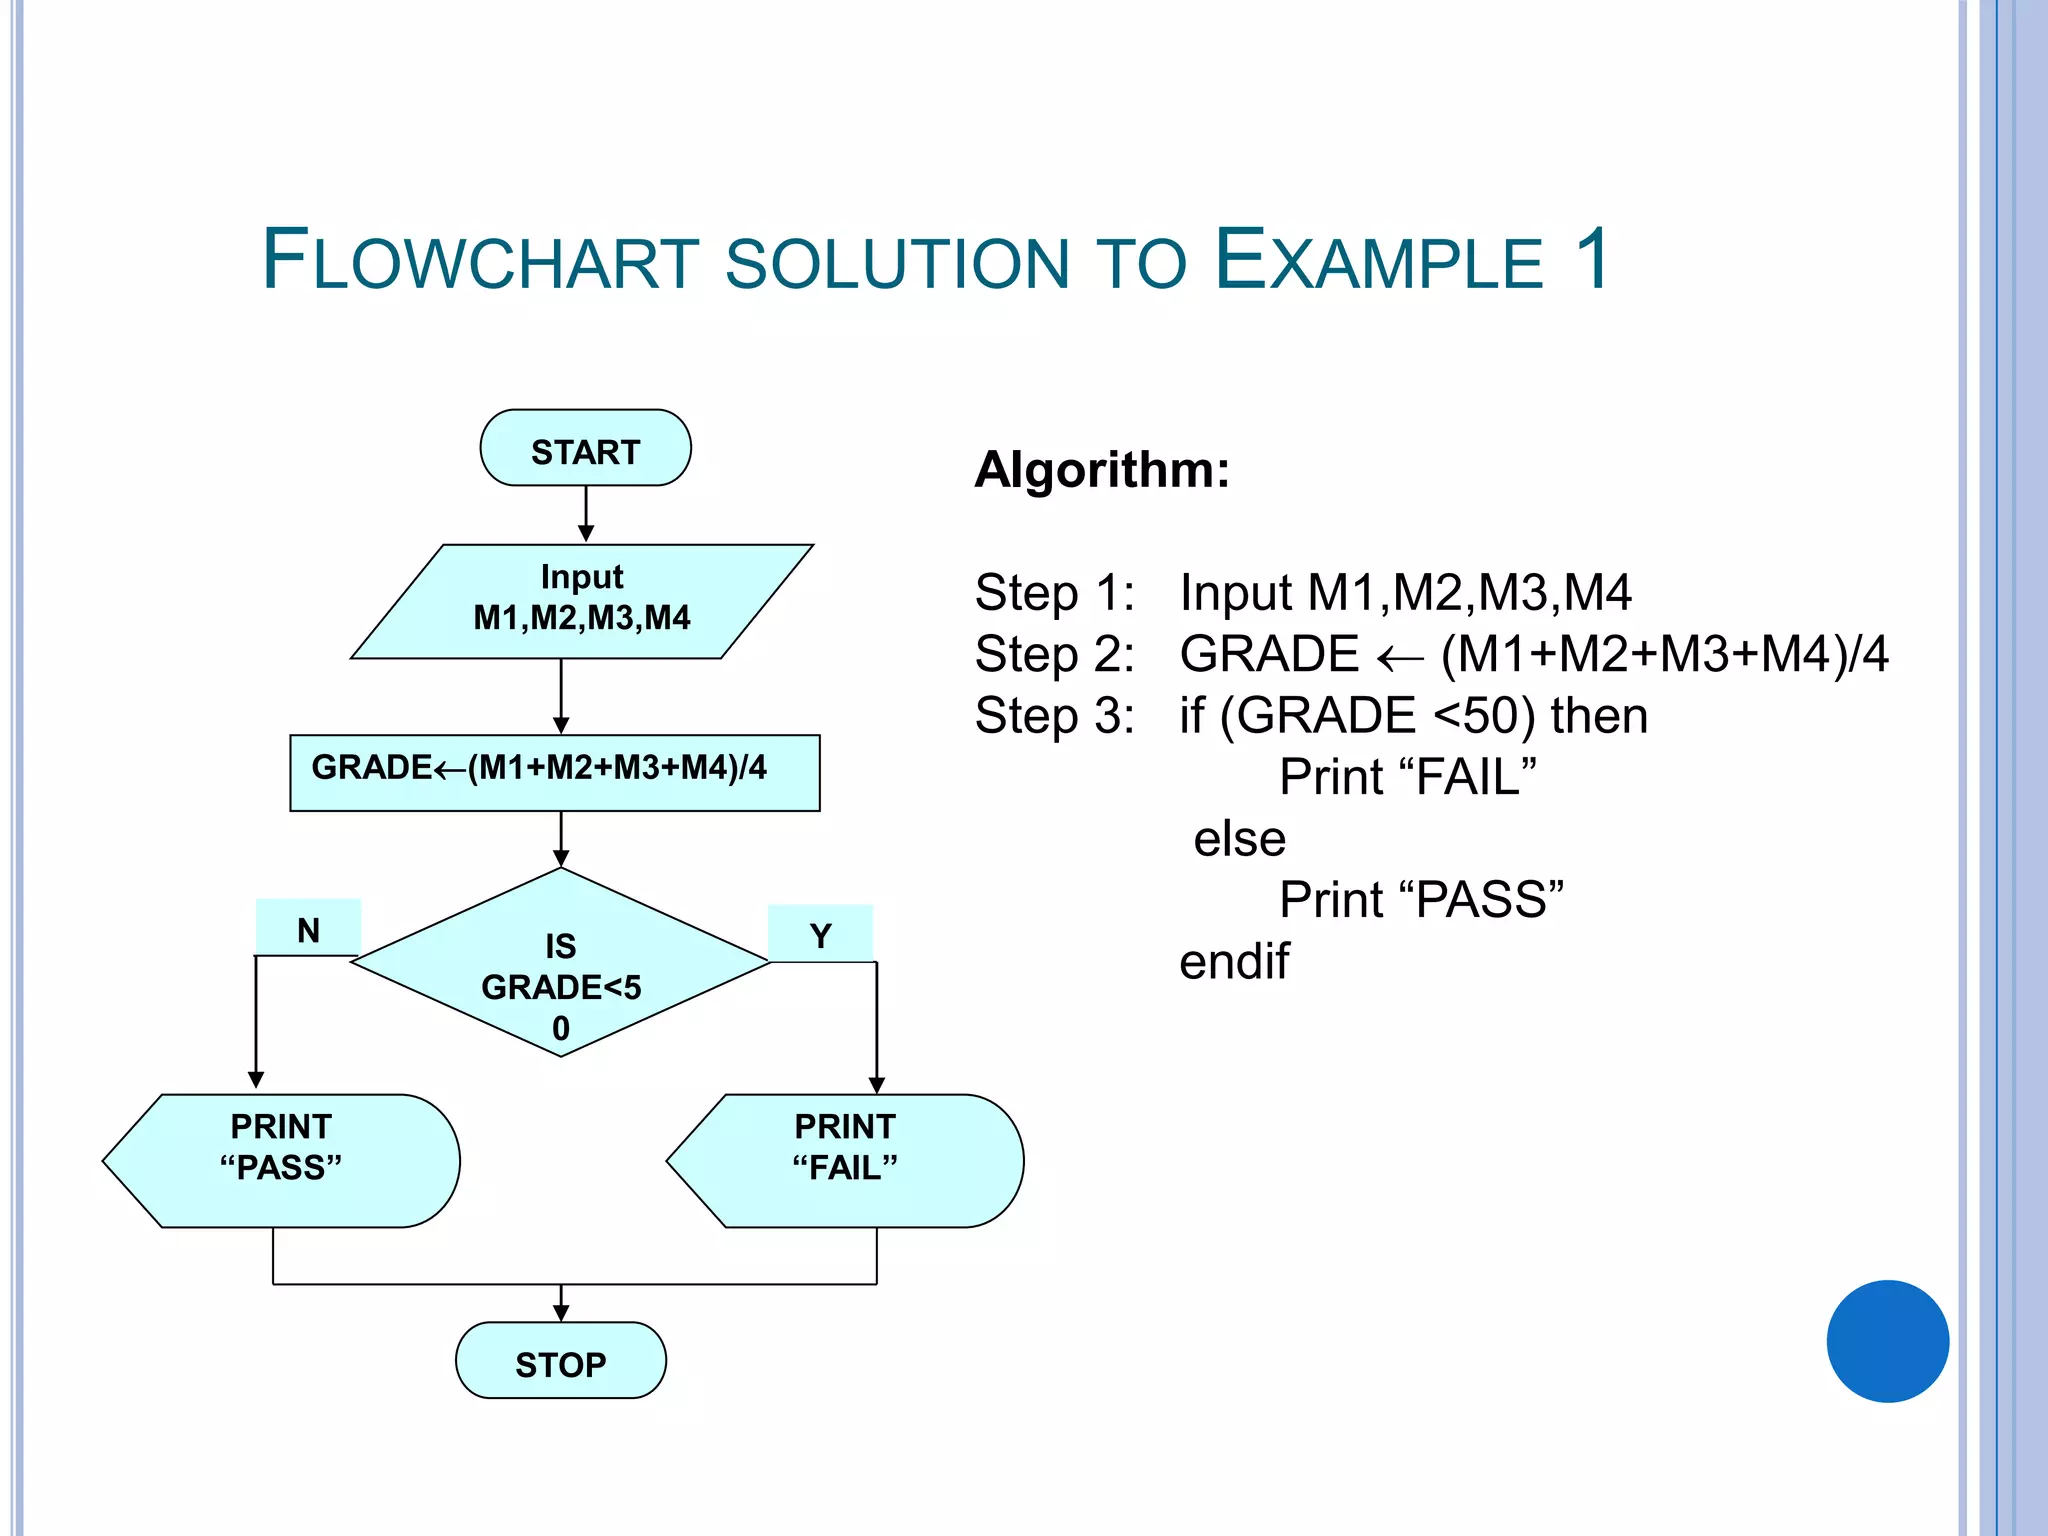
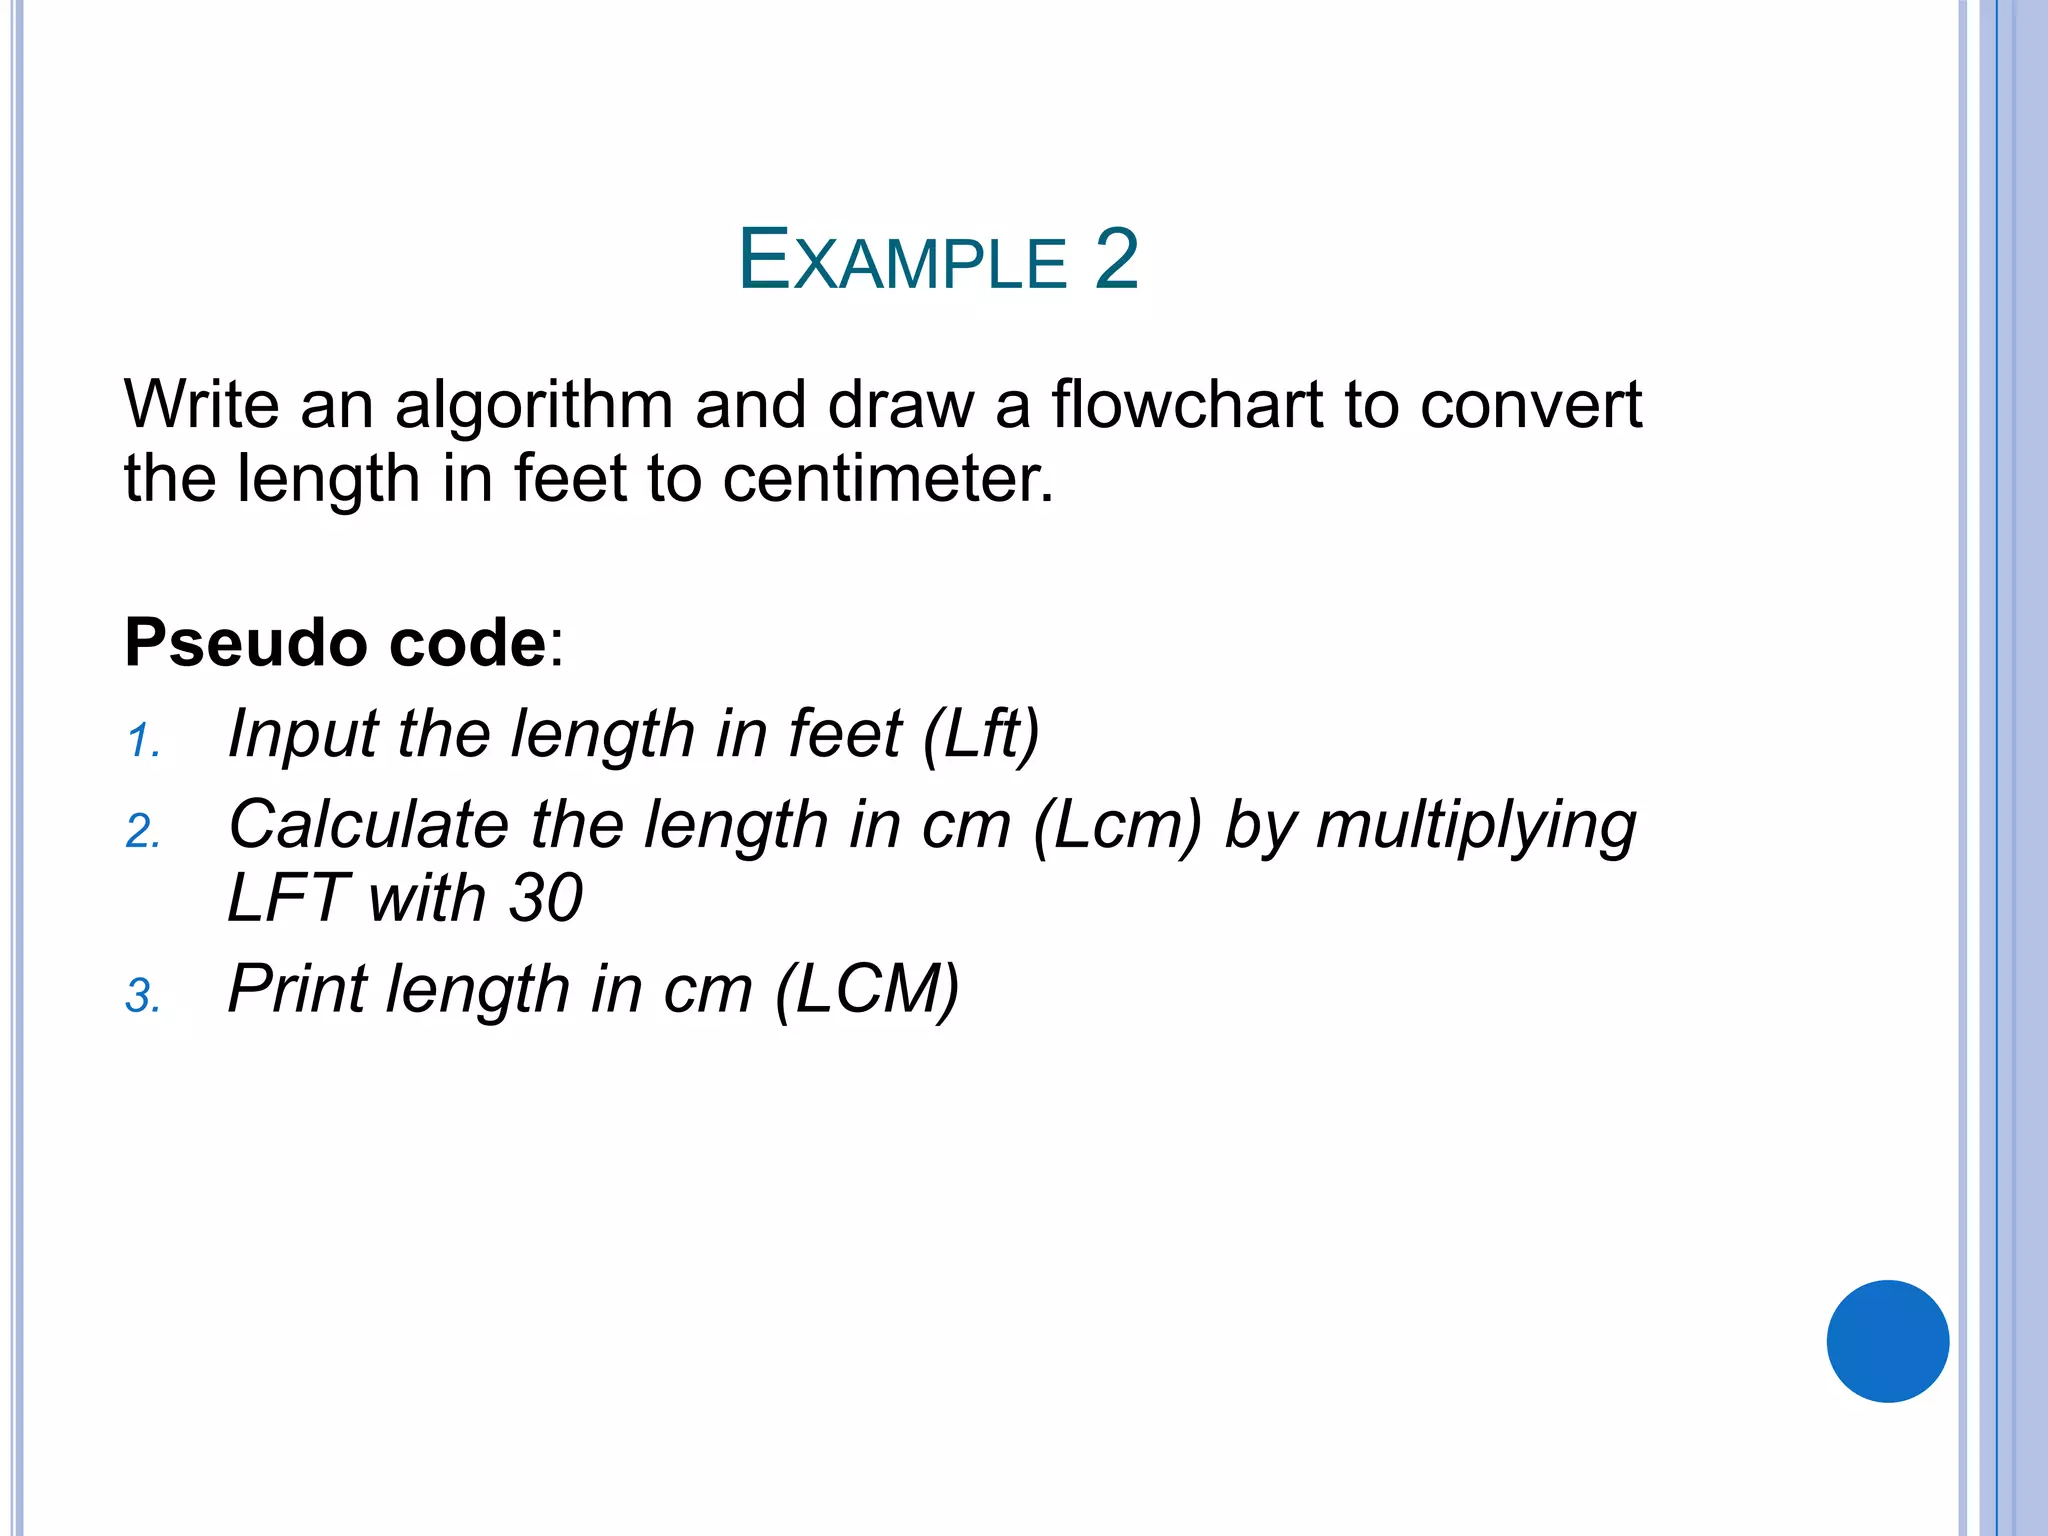
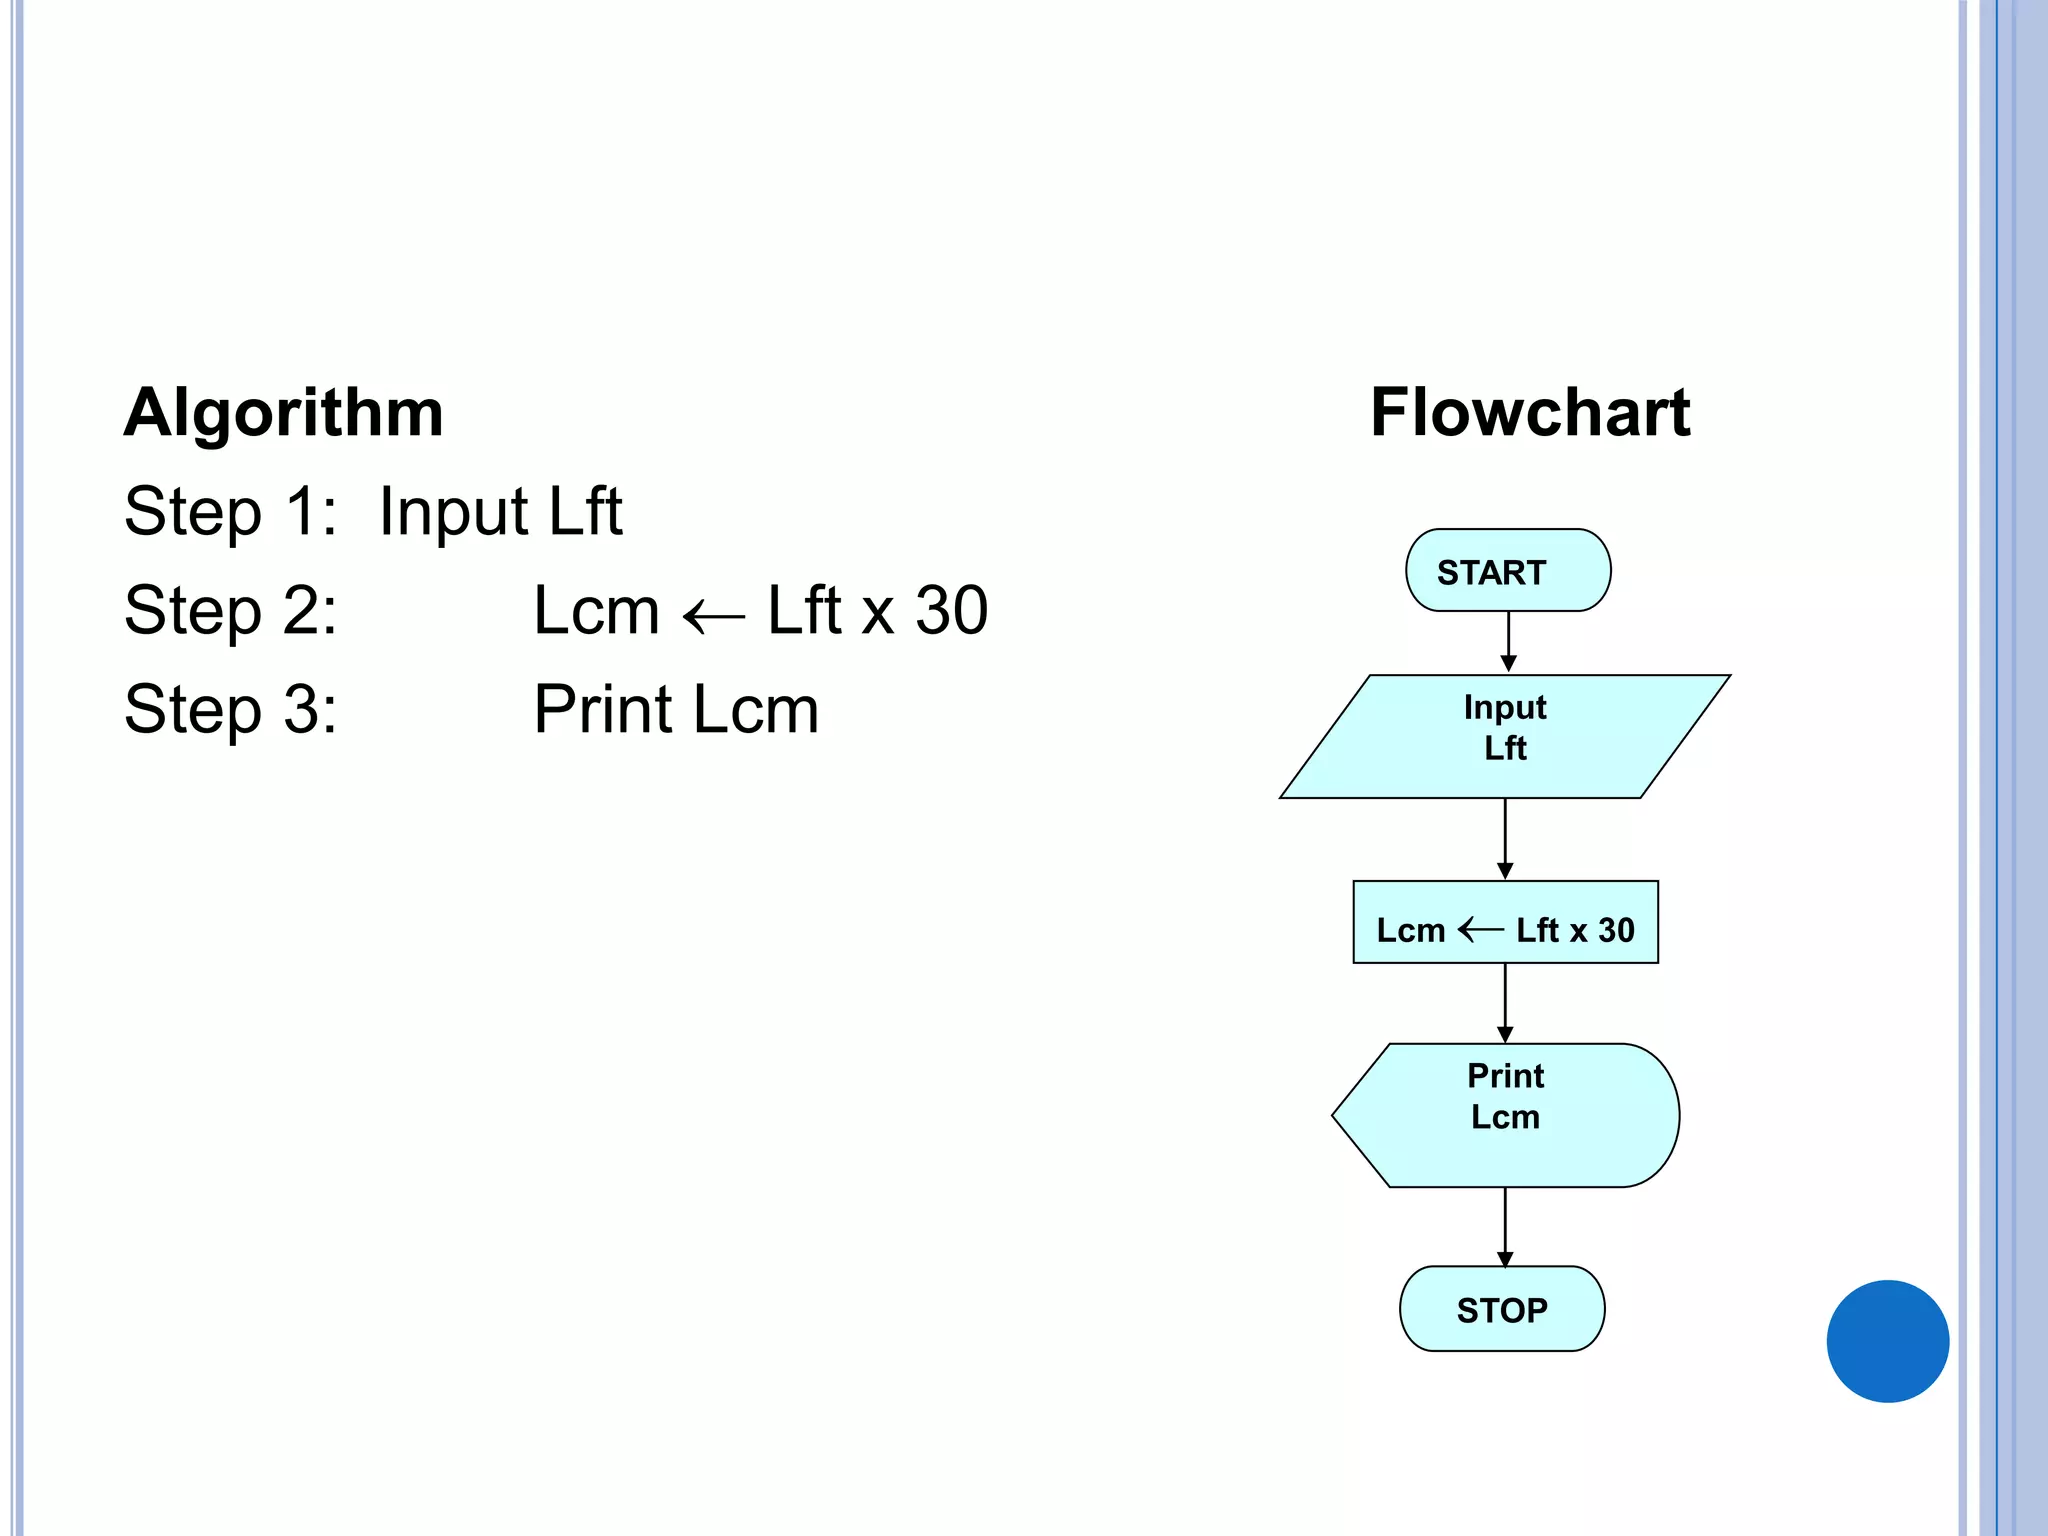
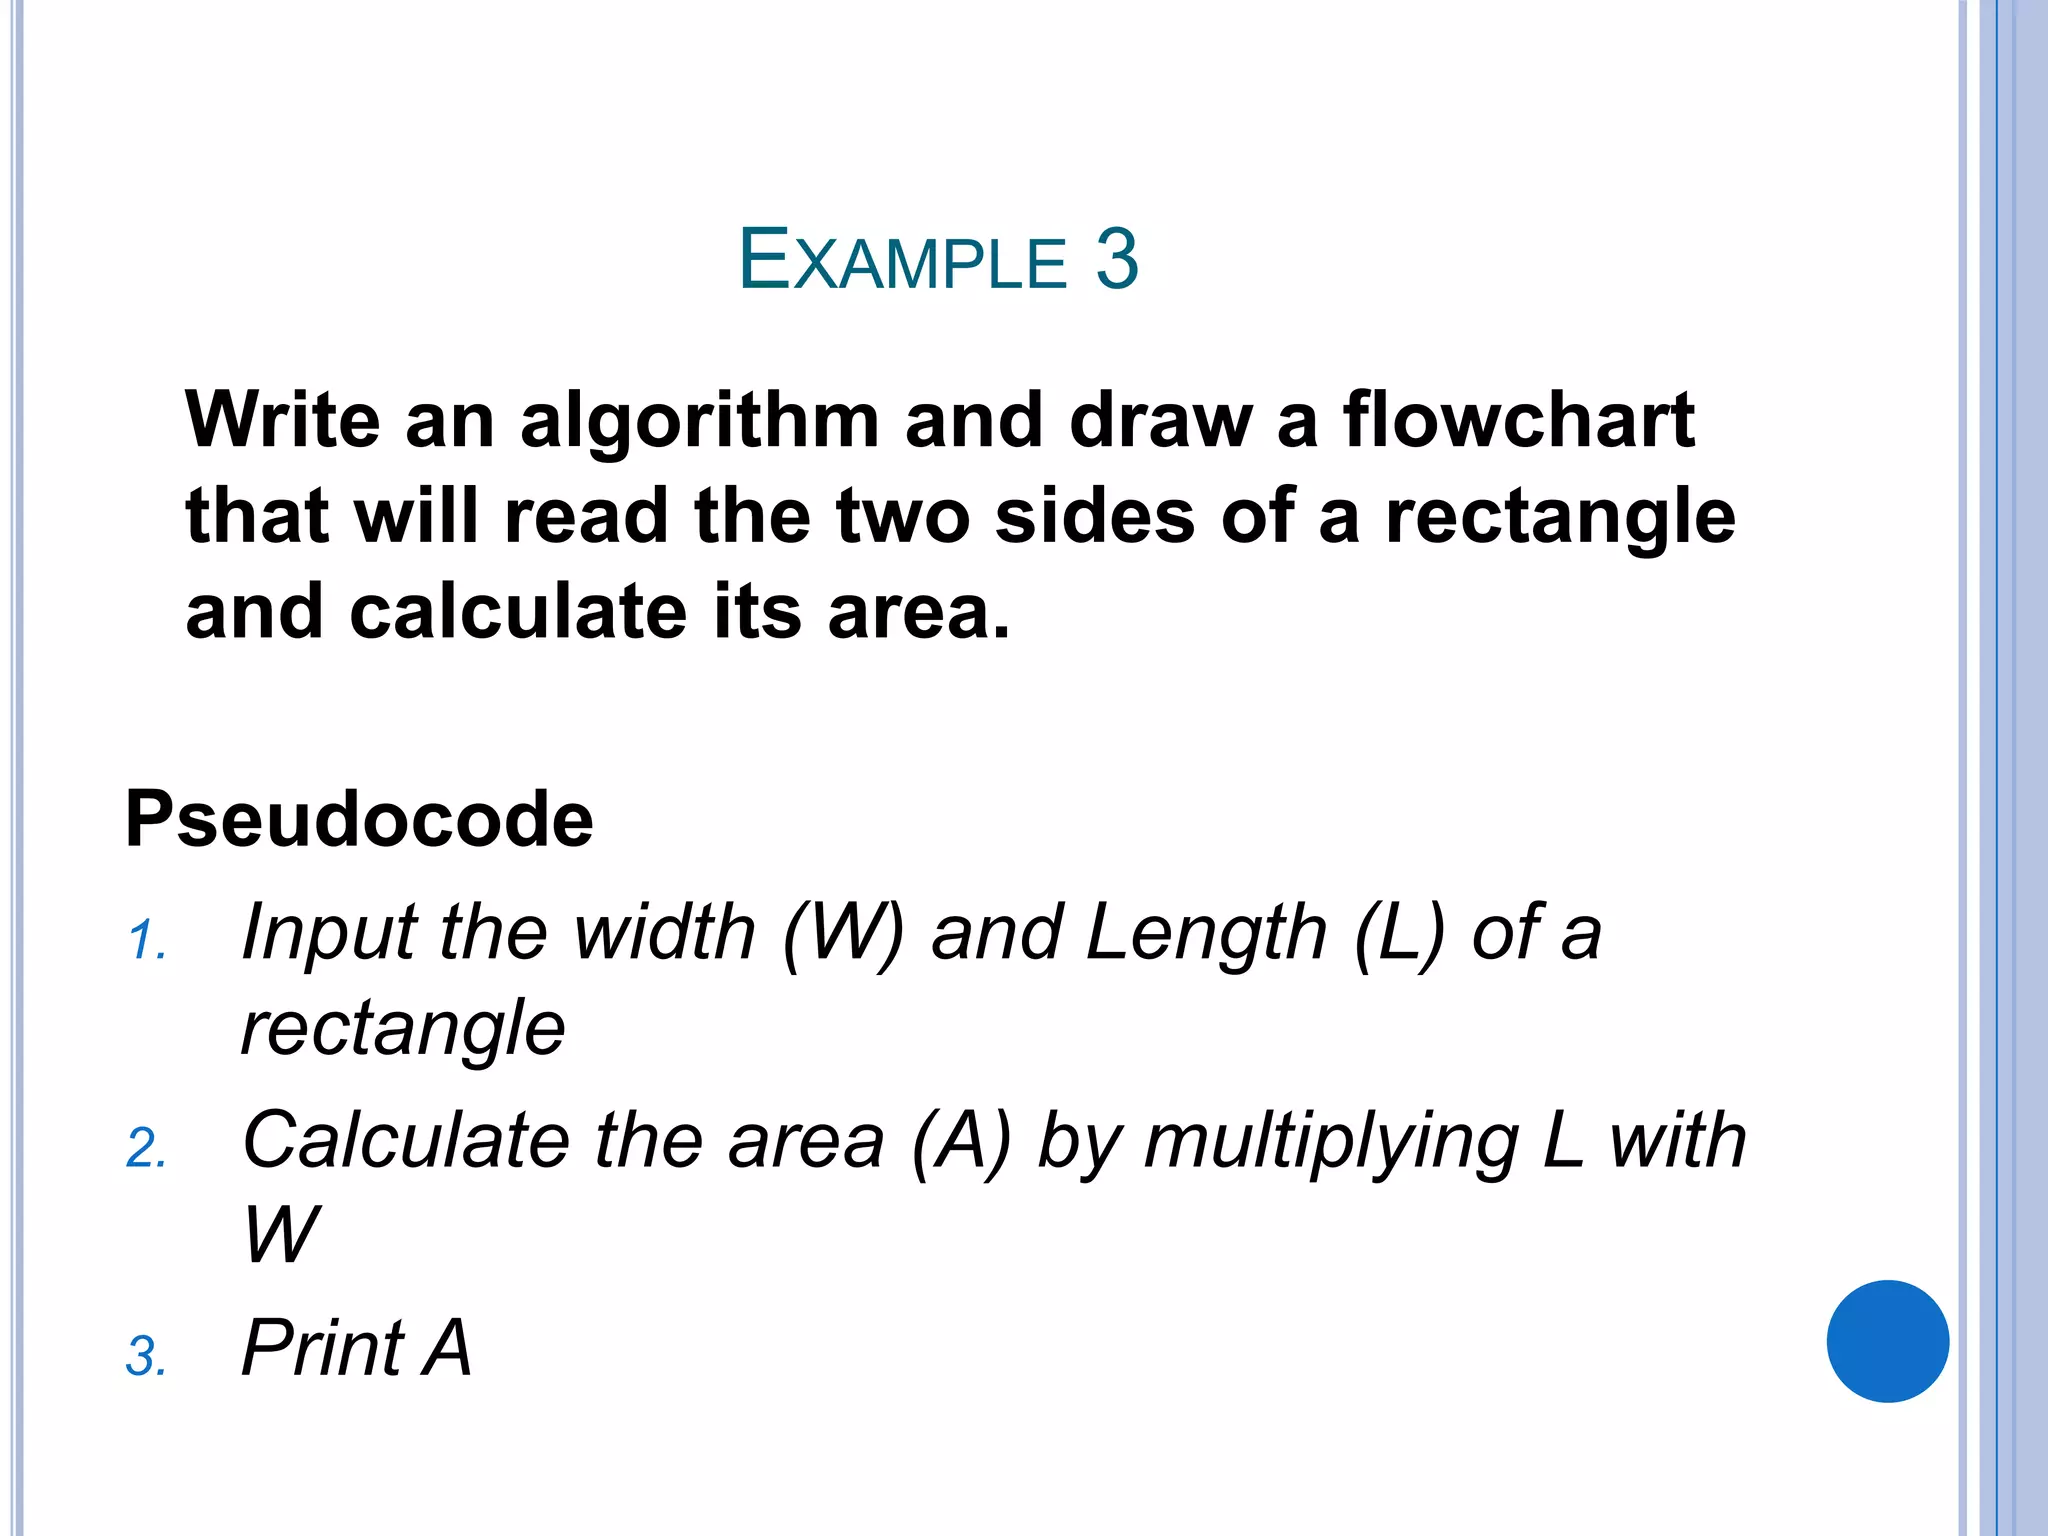
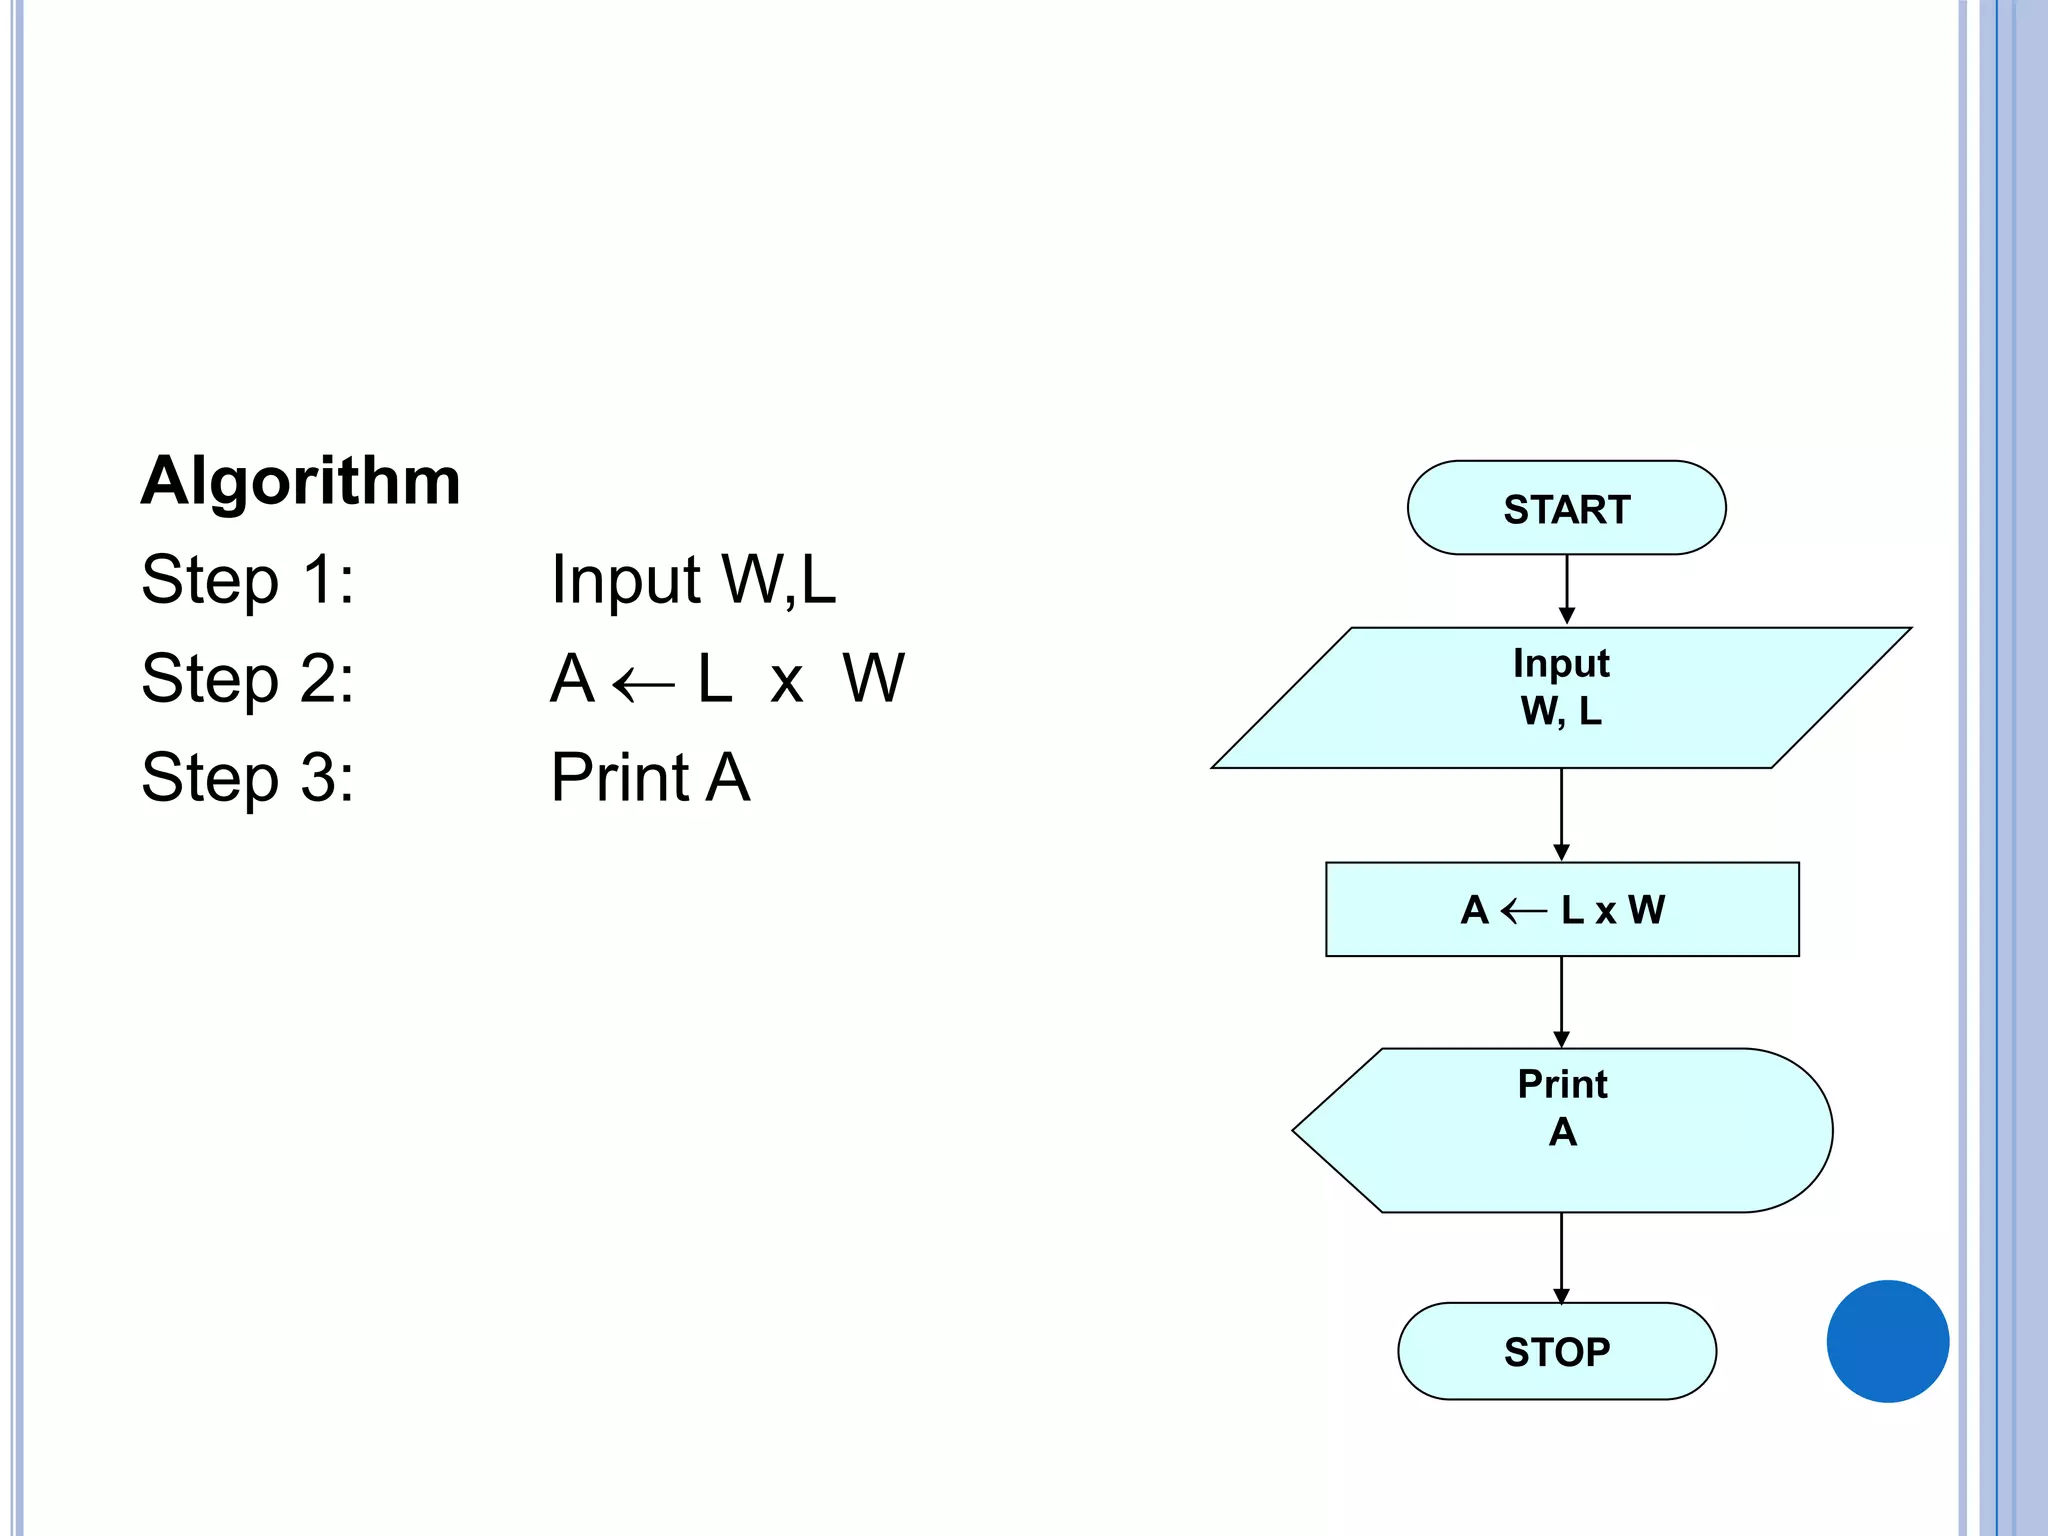
This document discusses algorithms, flowcharts, pseudocode, and decision structures. It begins by defining algorithms and their purpose in problem solving. It then explains flowchart symbols and how to represent algorithms visually using flowcharts. Several examples are provided of writing pseudocode, detailed algorithms, and corresponding flowcharts to solve problems. The document also covers decision structures like if-then-else statements and relational operators. It provides examples of algorithms using nested if statements. Finally, it presents an example of determining an employee bonus based on overtime worked and absences.