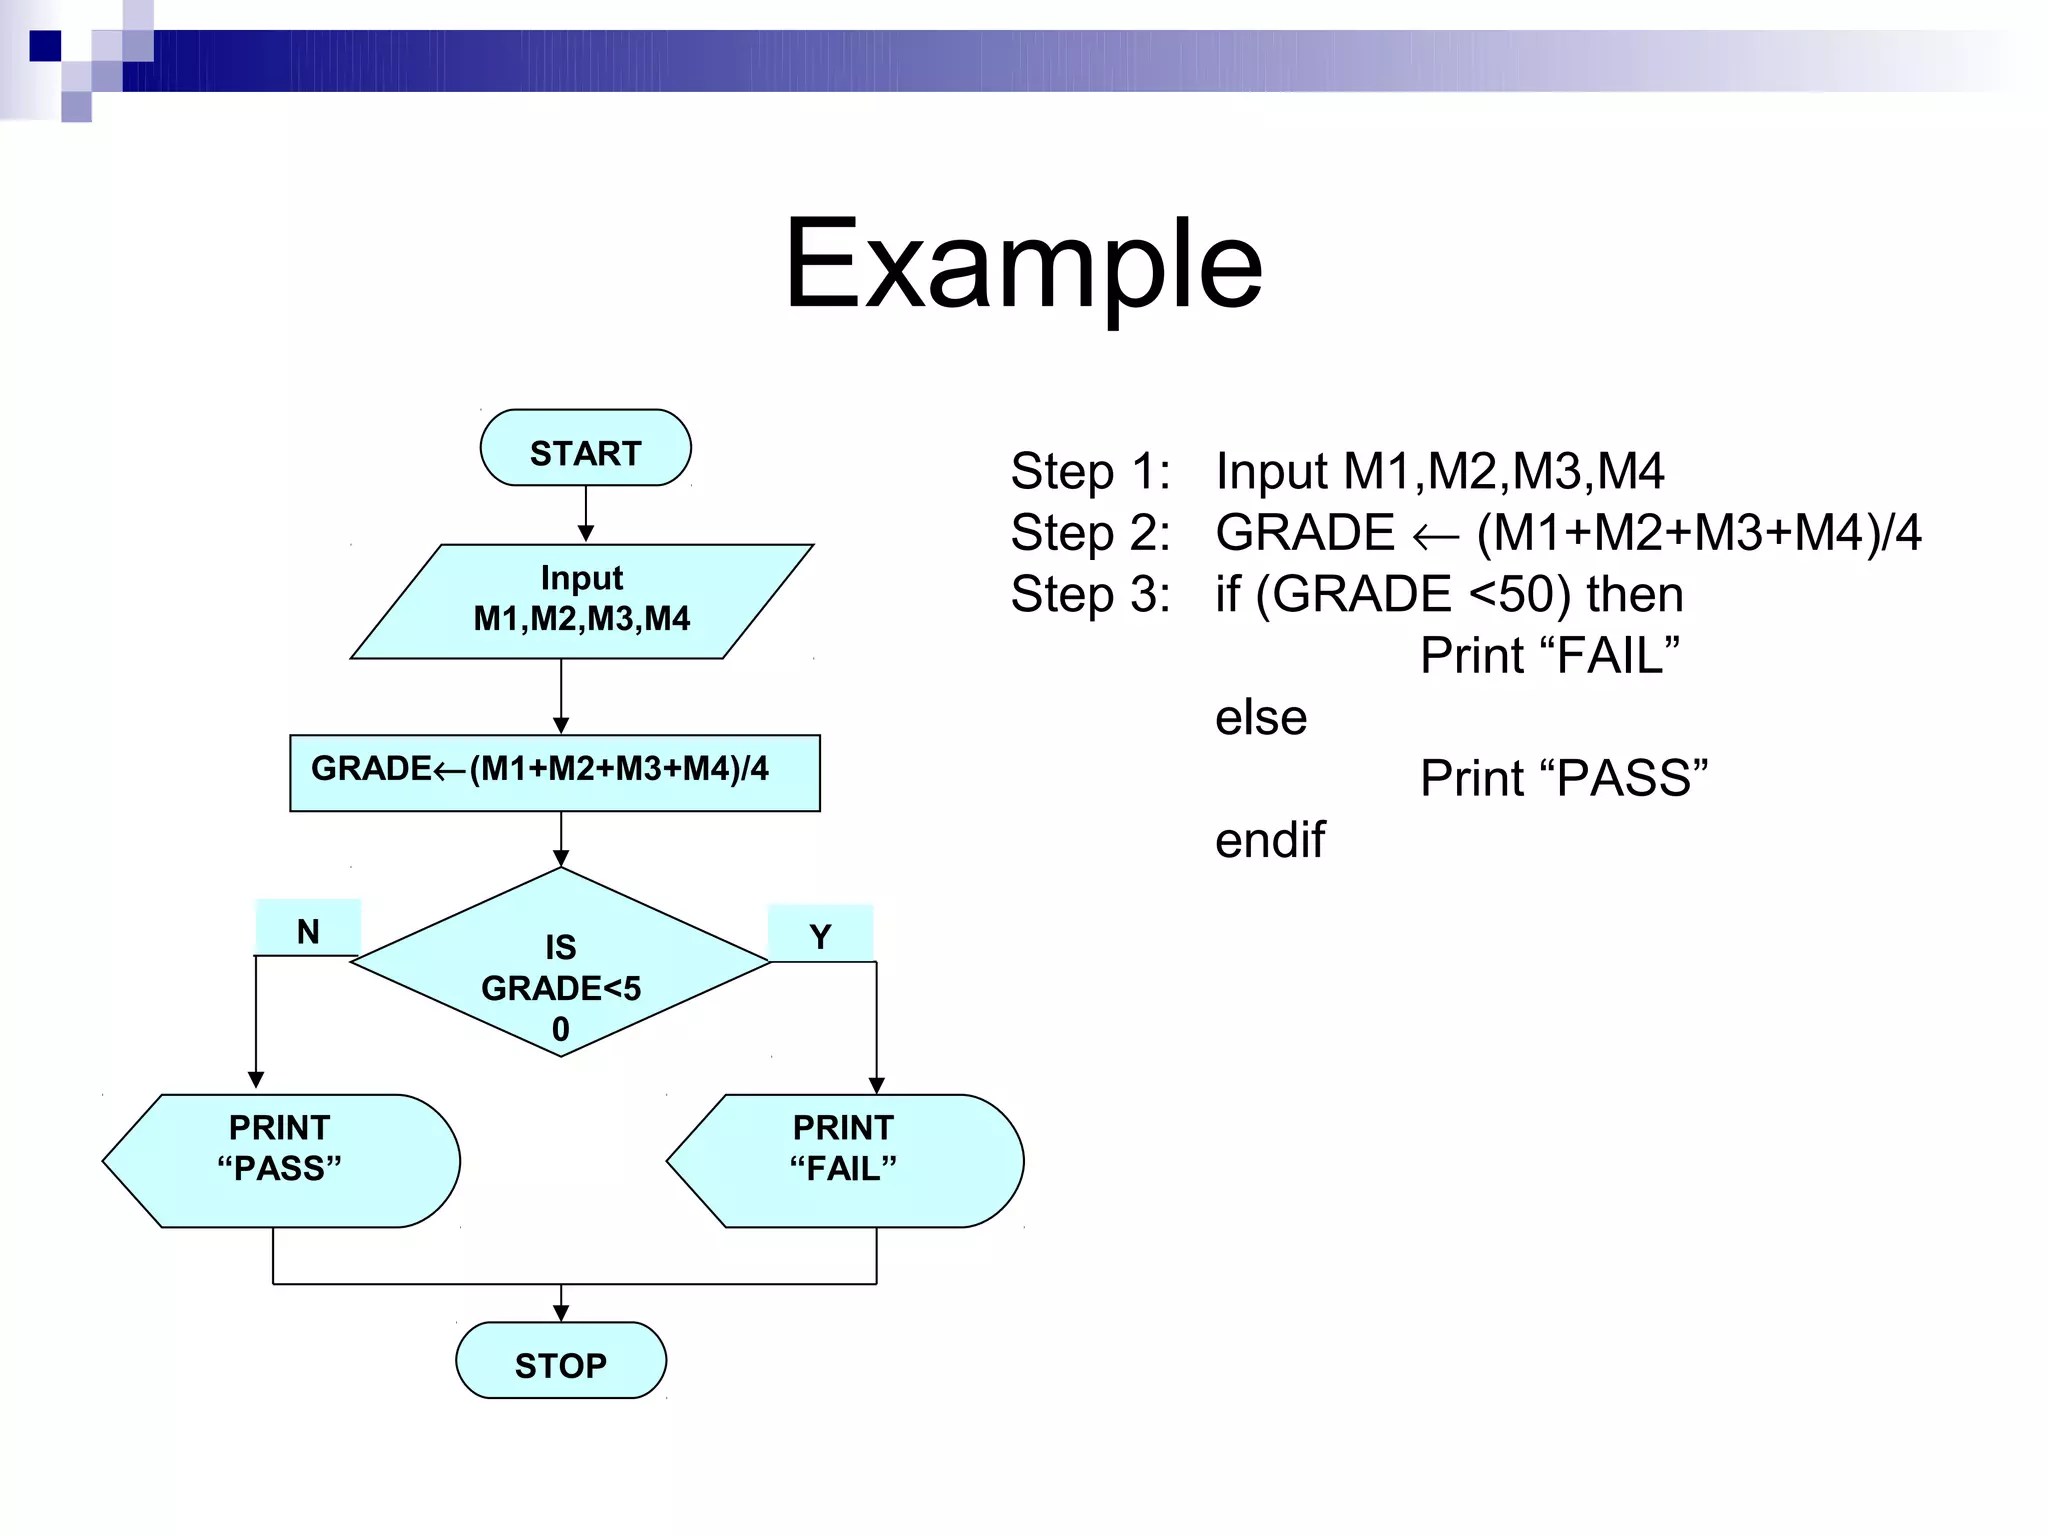
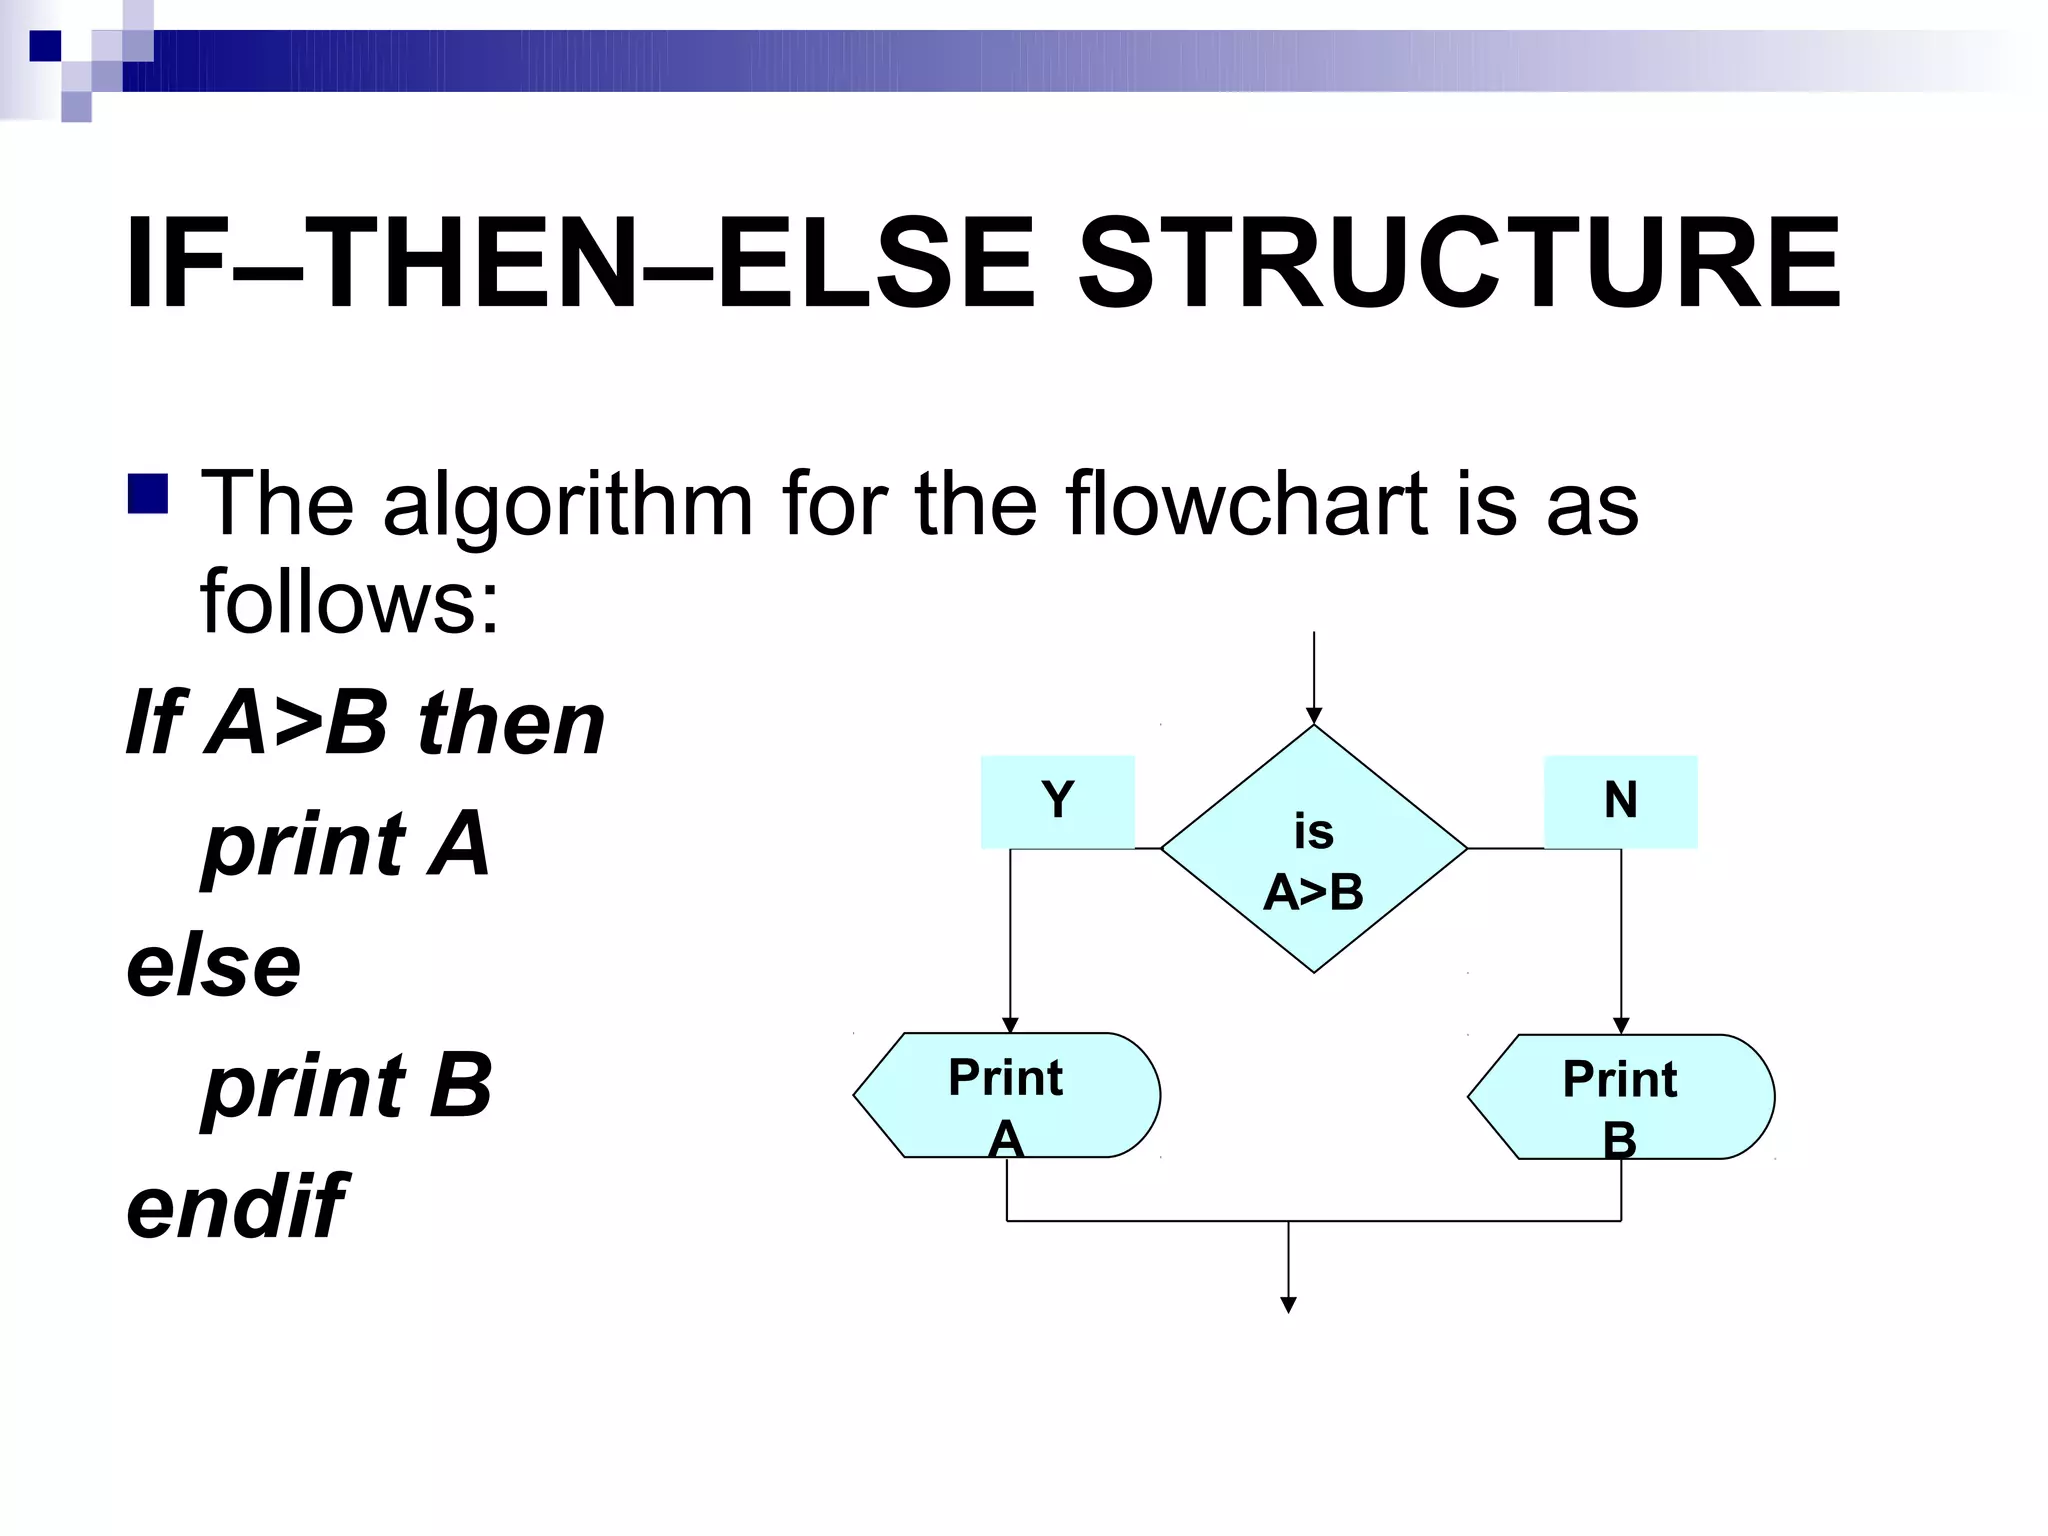
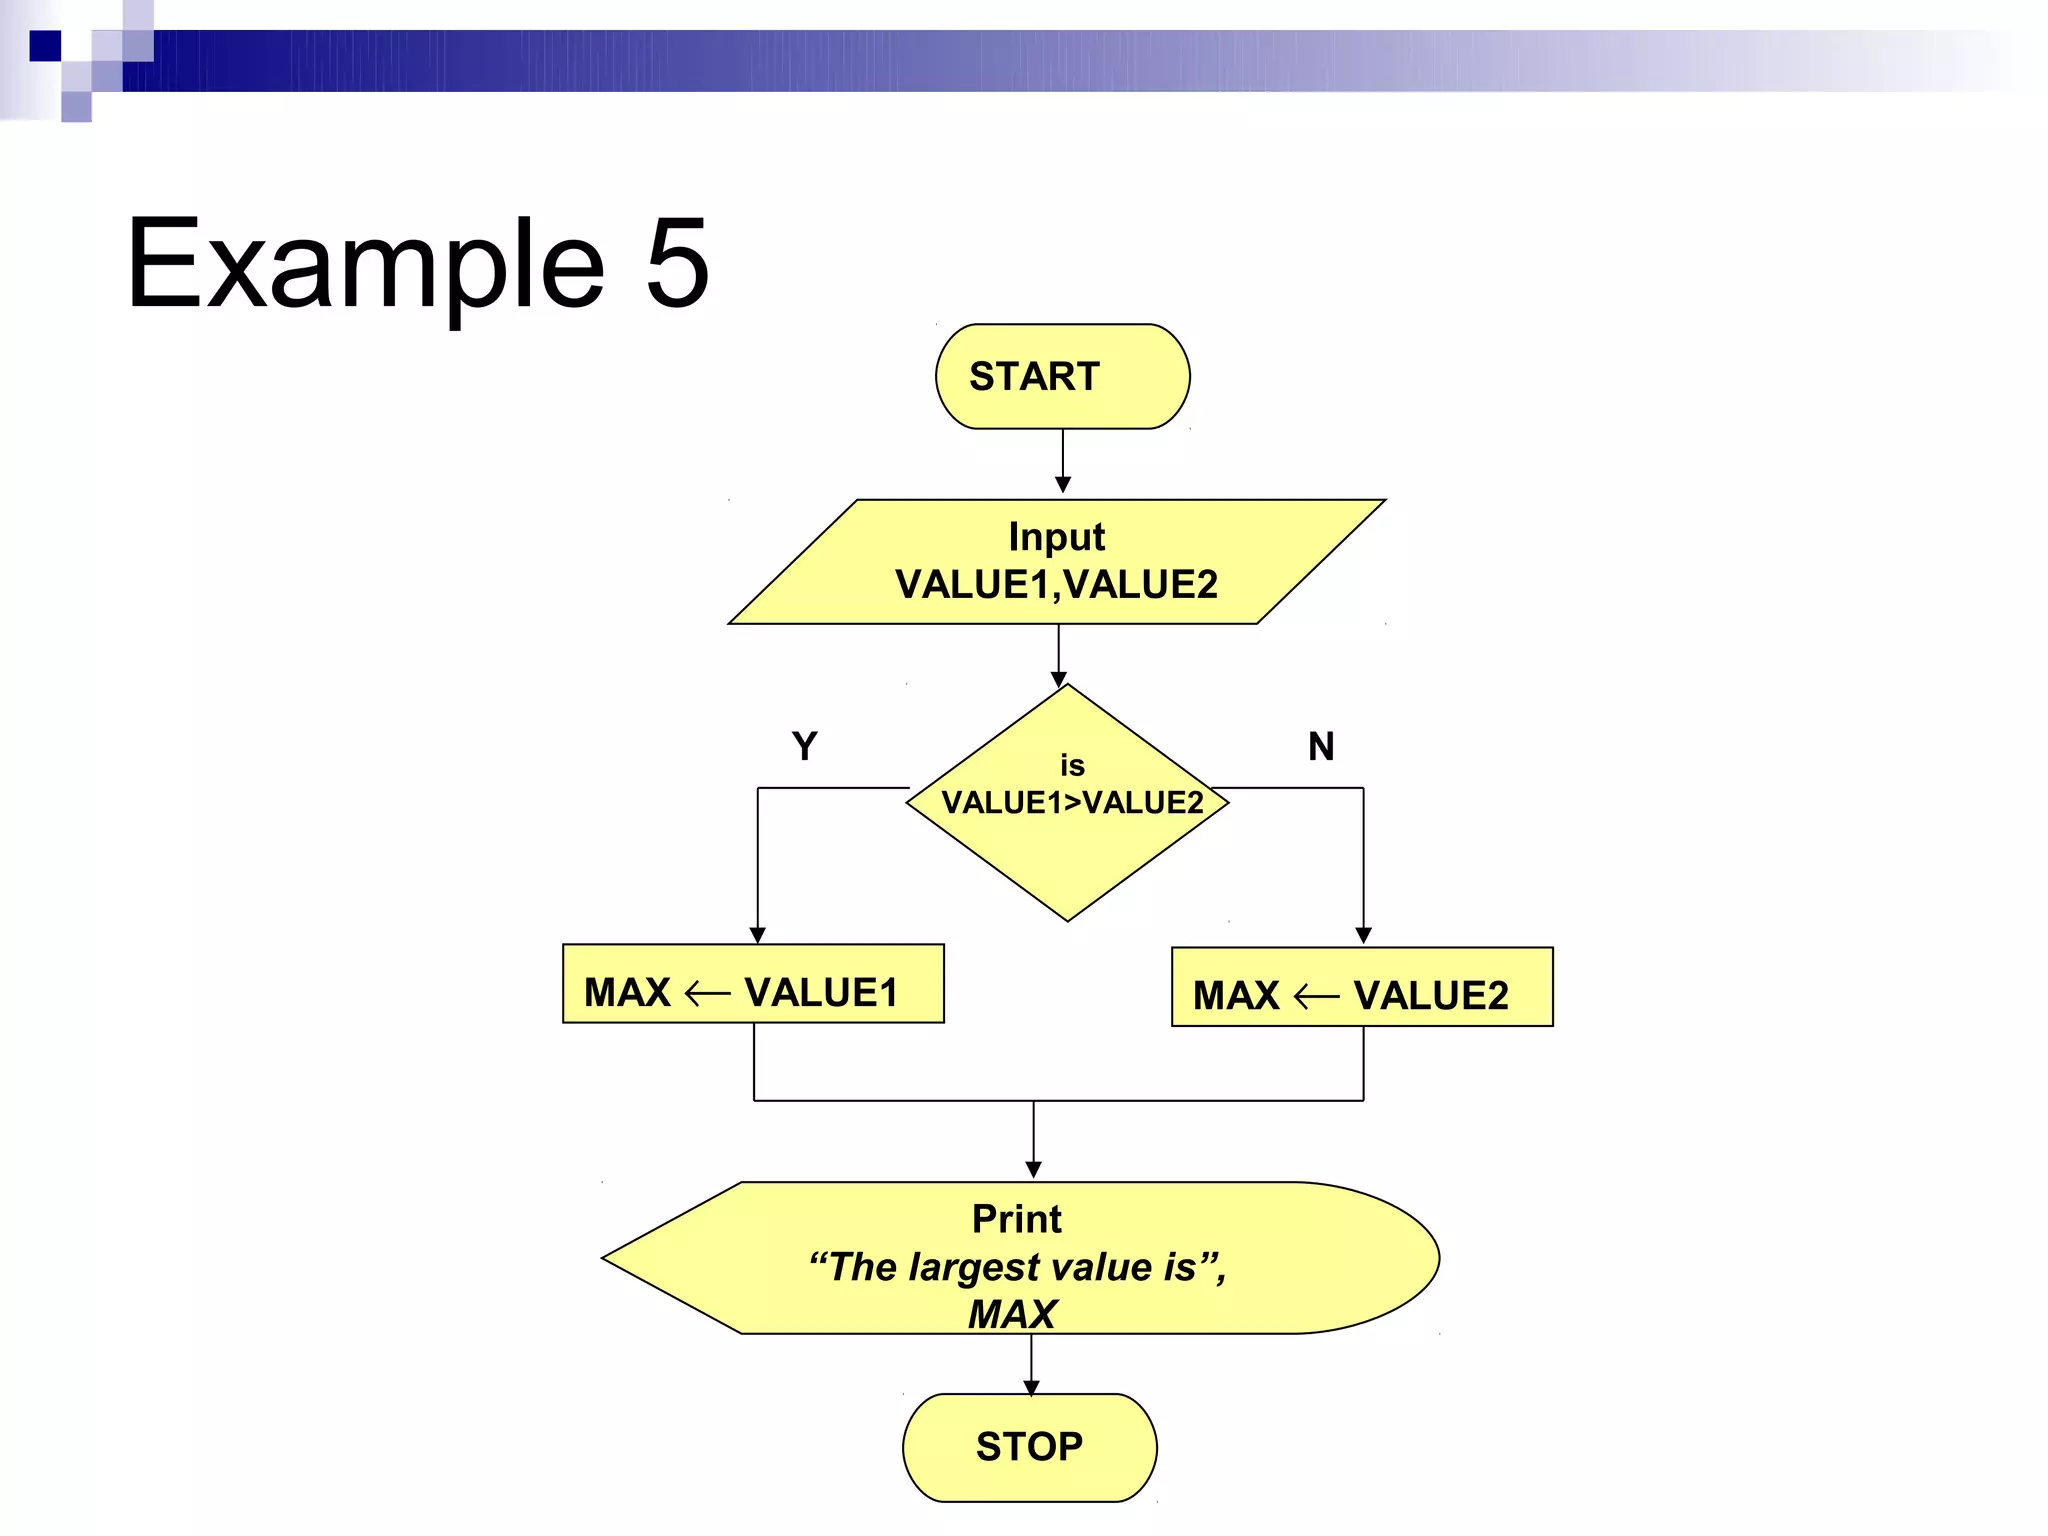
Here is the flowchart for the above algorithm:
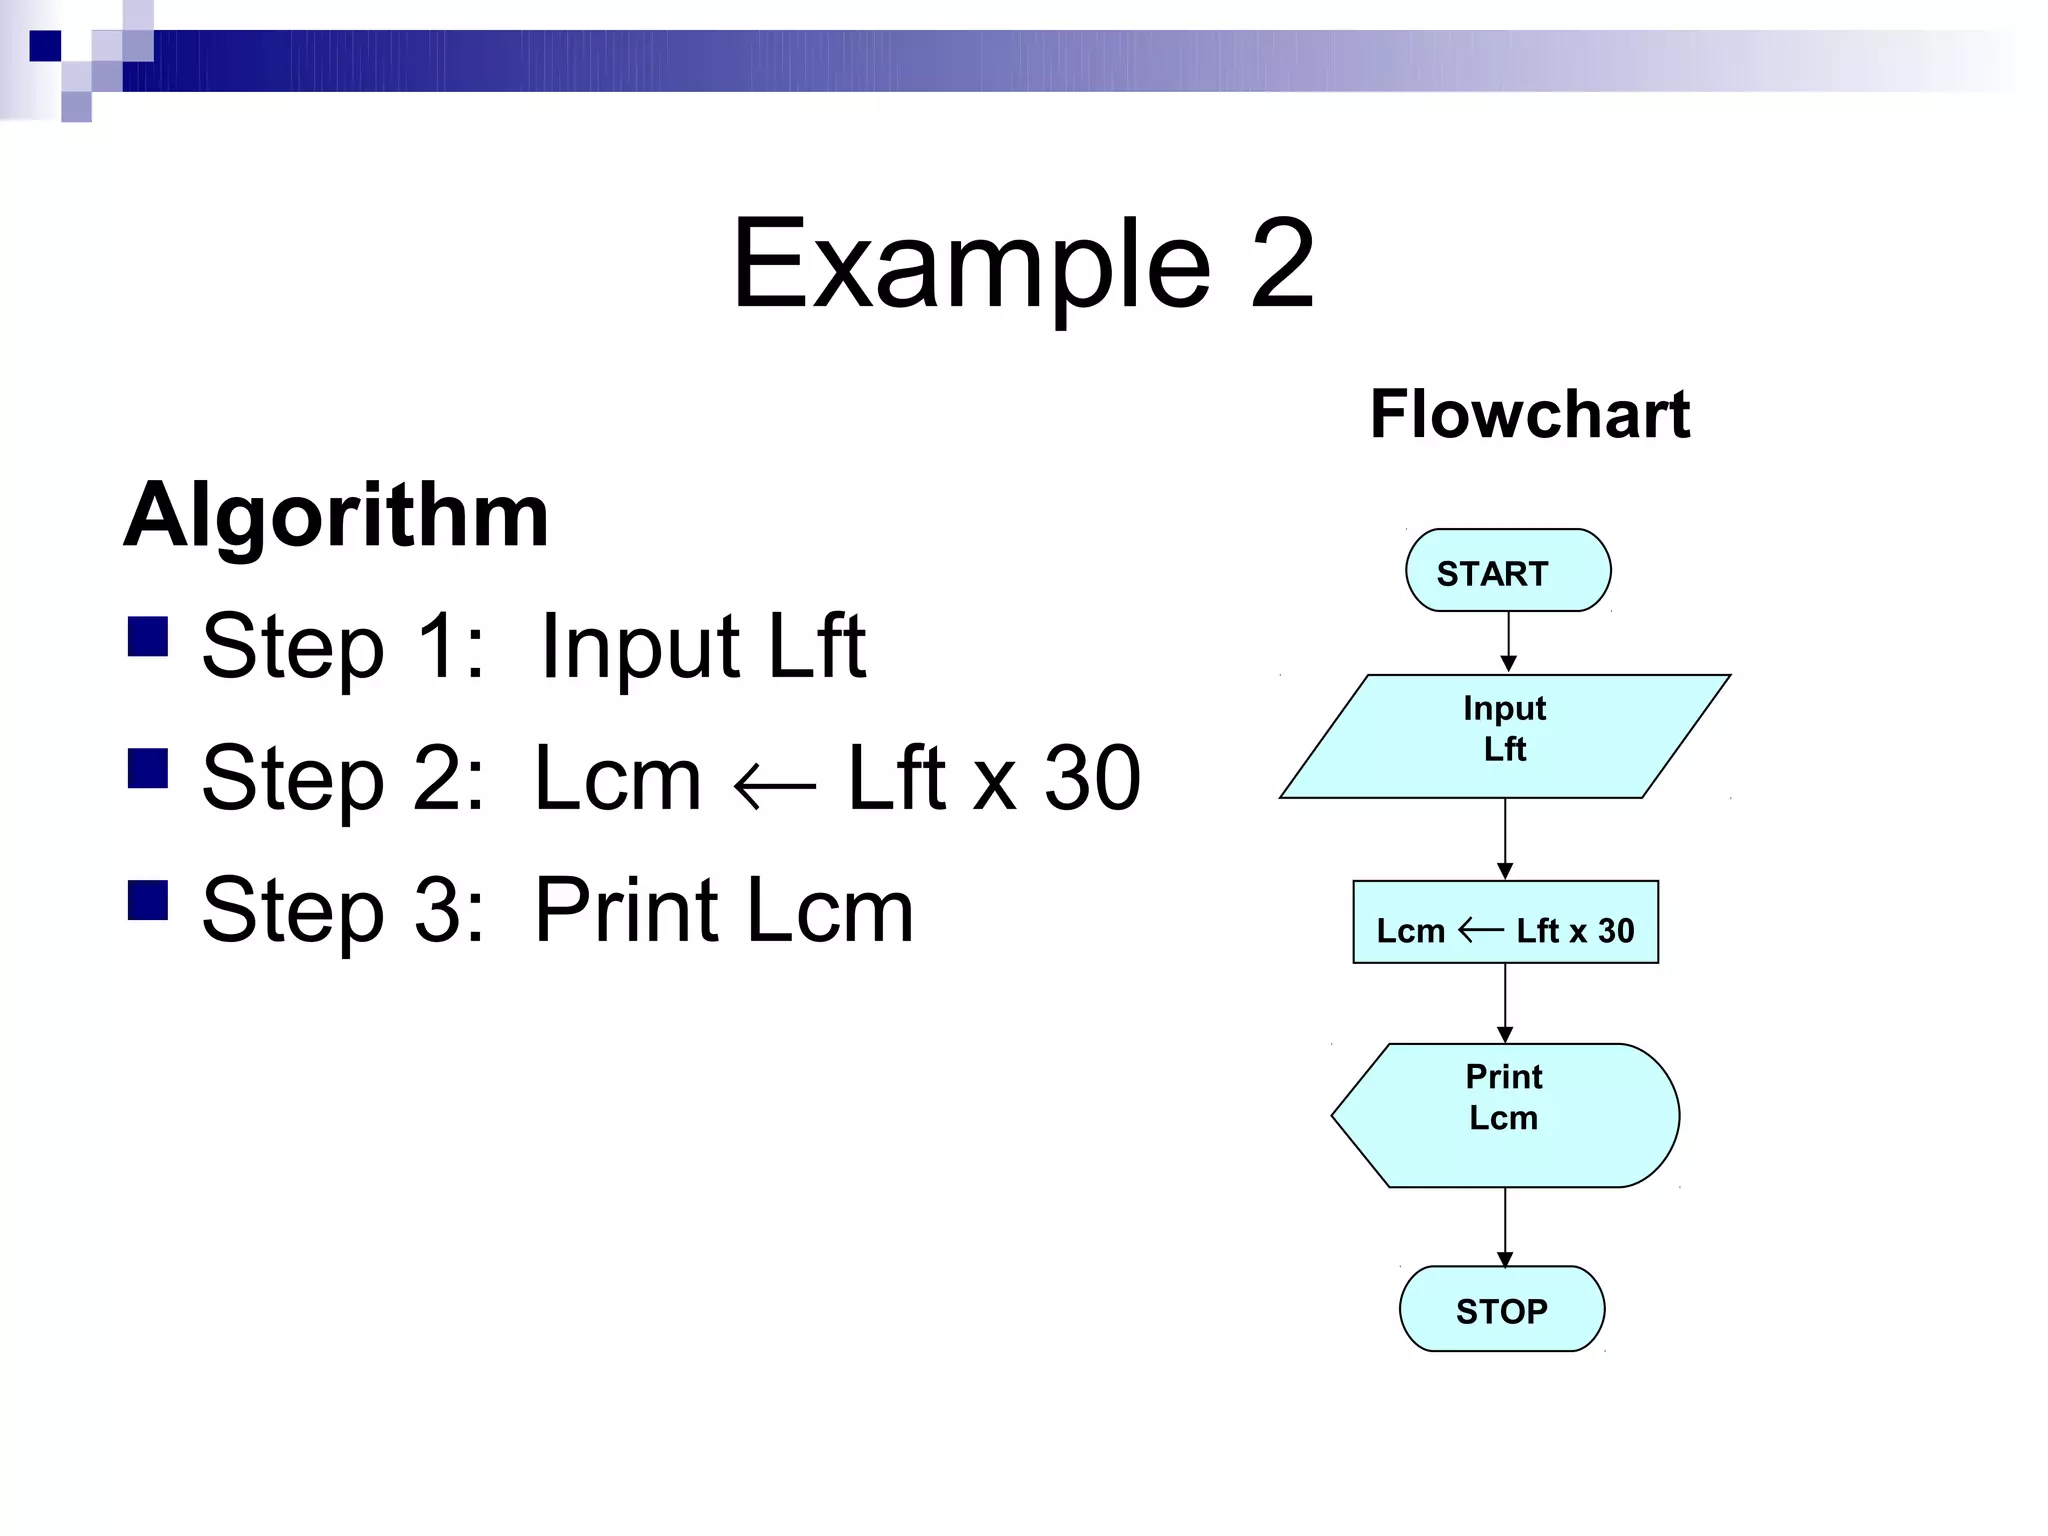
START
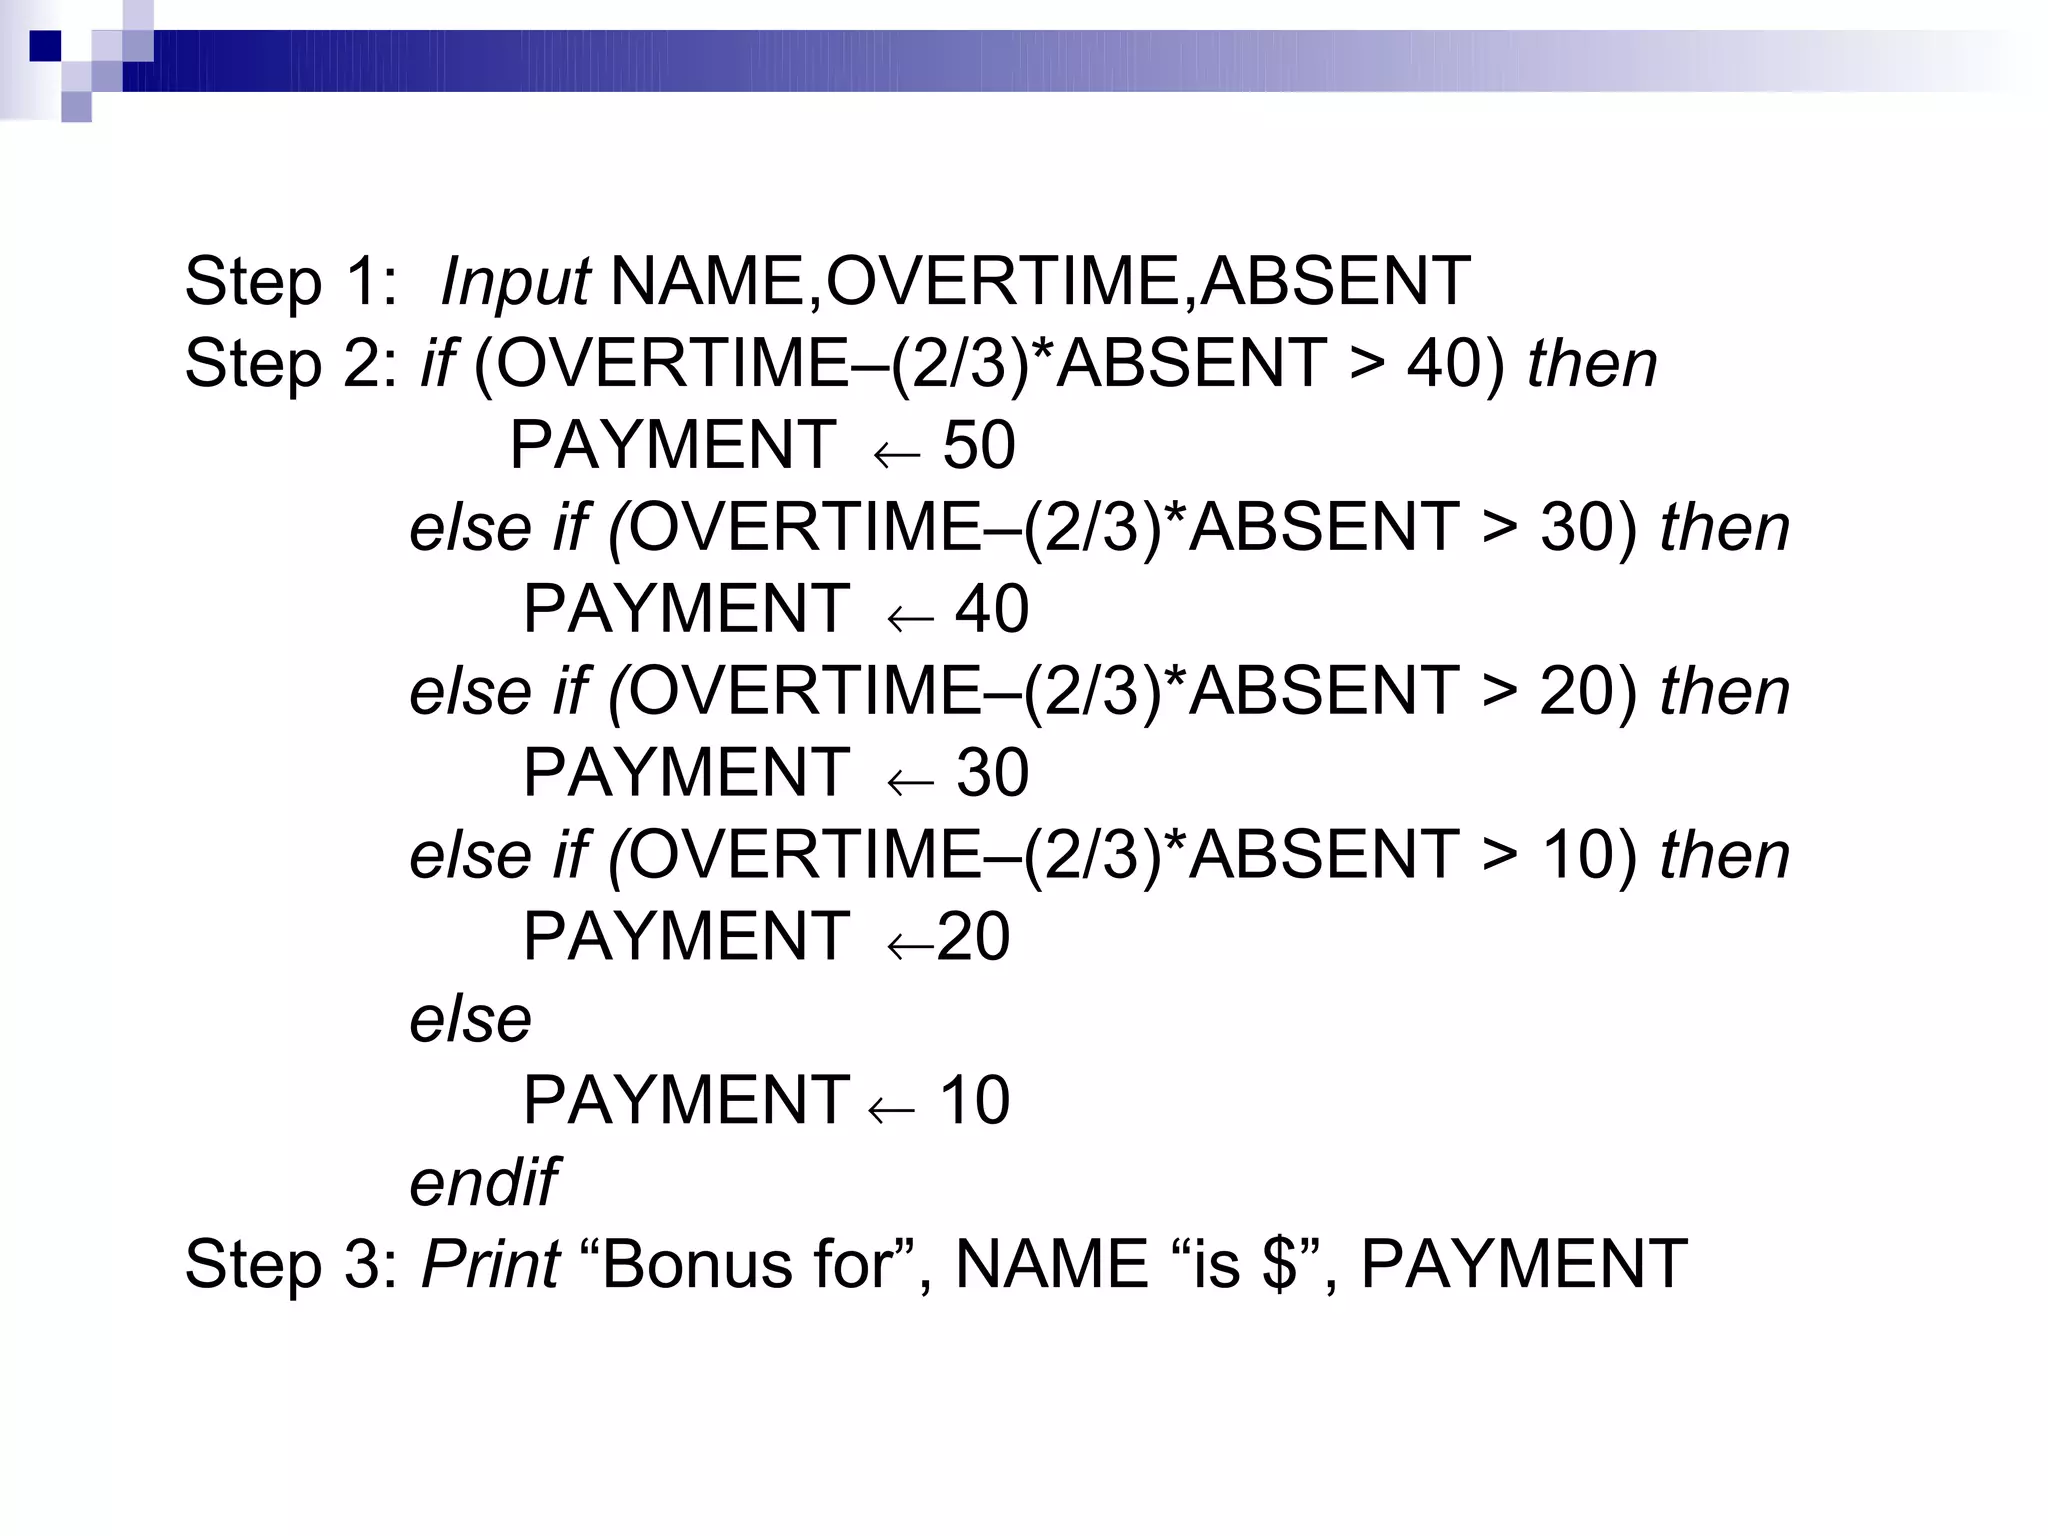
Input
NAME, OVERTIME,
ABSENT
NET ← OVERTIME – (2/3)*ABSENT
Y is N
NET > 40 NET > 40?
PAYMENT ← 50 PAYMENT ← 40
Y is N
NET > 30 NET > 30?
PAYMENT ← 40 PAYMENT ← 30
Y is N
NET > 20 NET > 20?
PAYMENT ← 30 PAYMENT ← 20
Y is N
NET > 10 NET > 10?
PAYMENT


![Example 6
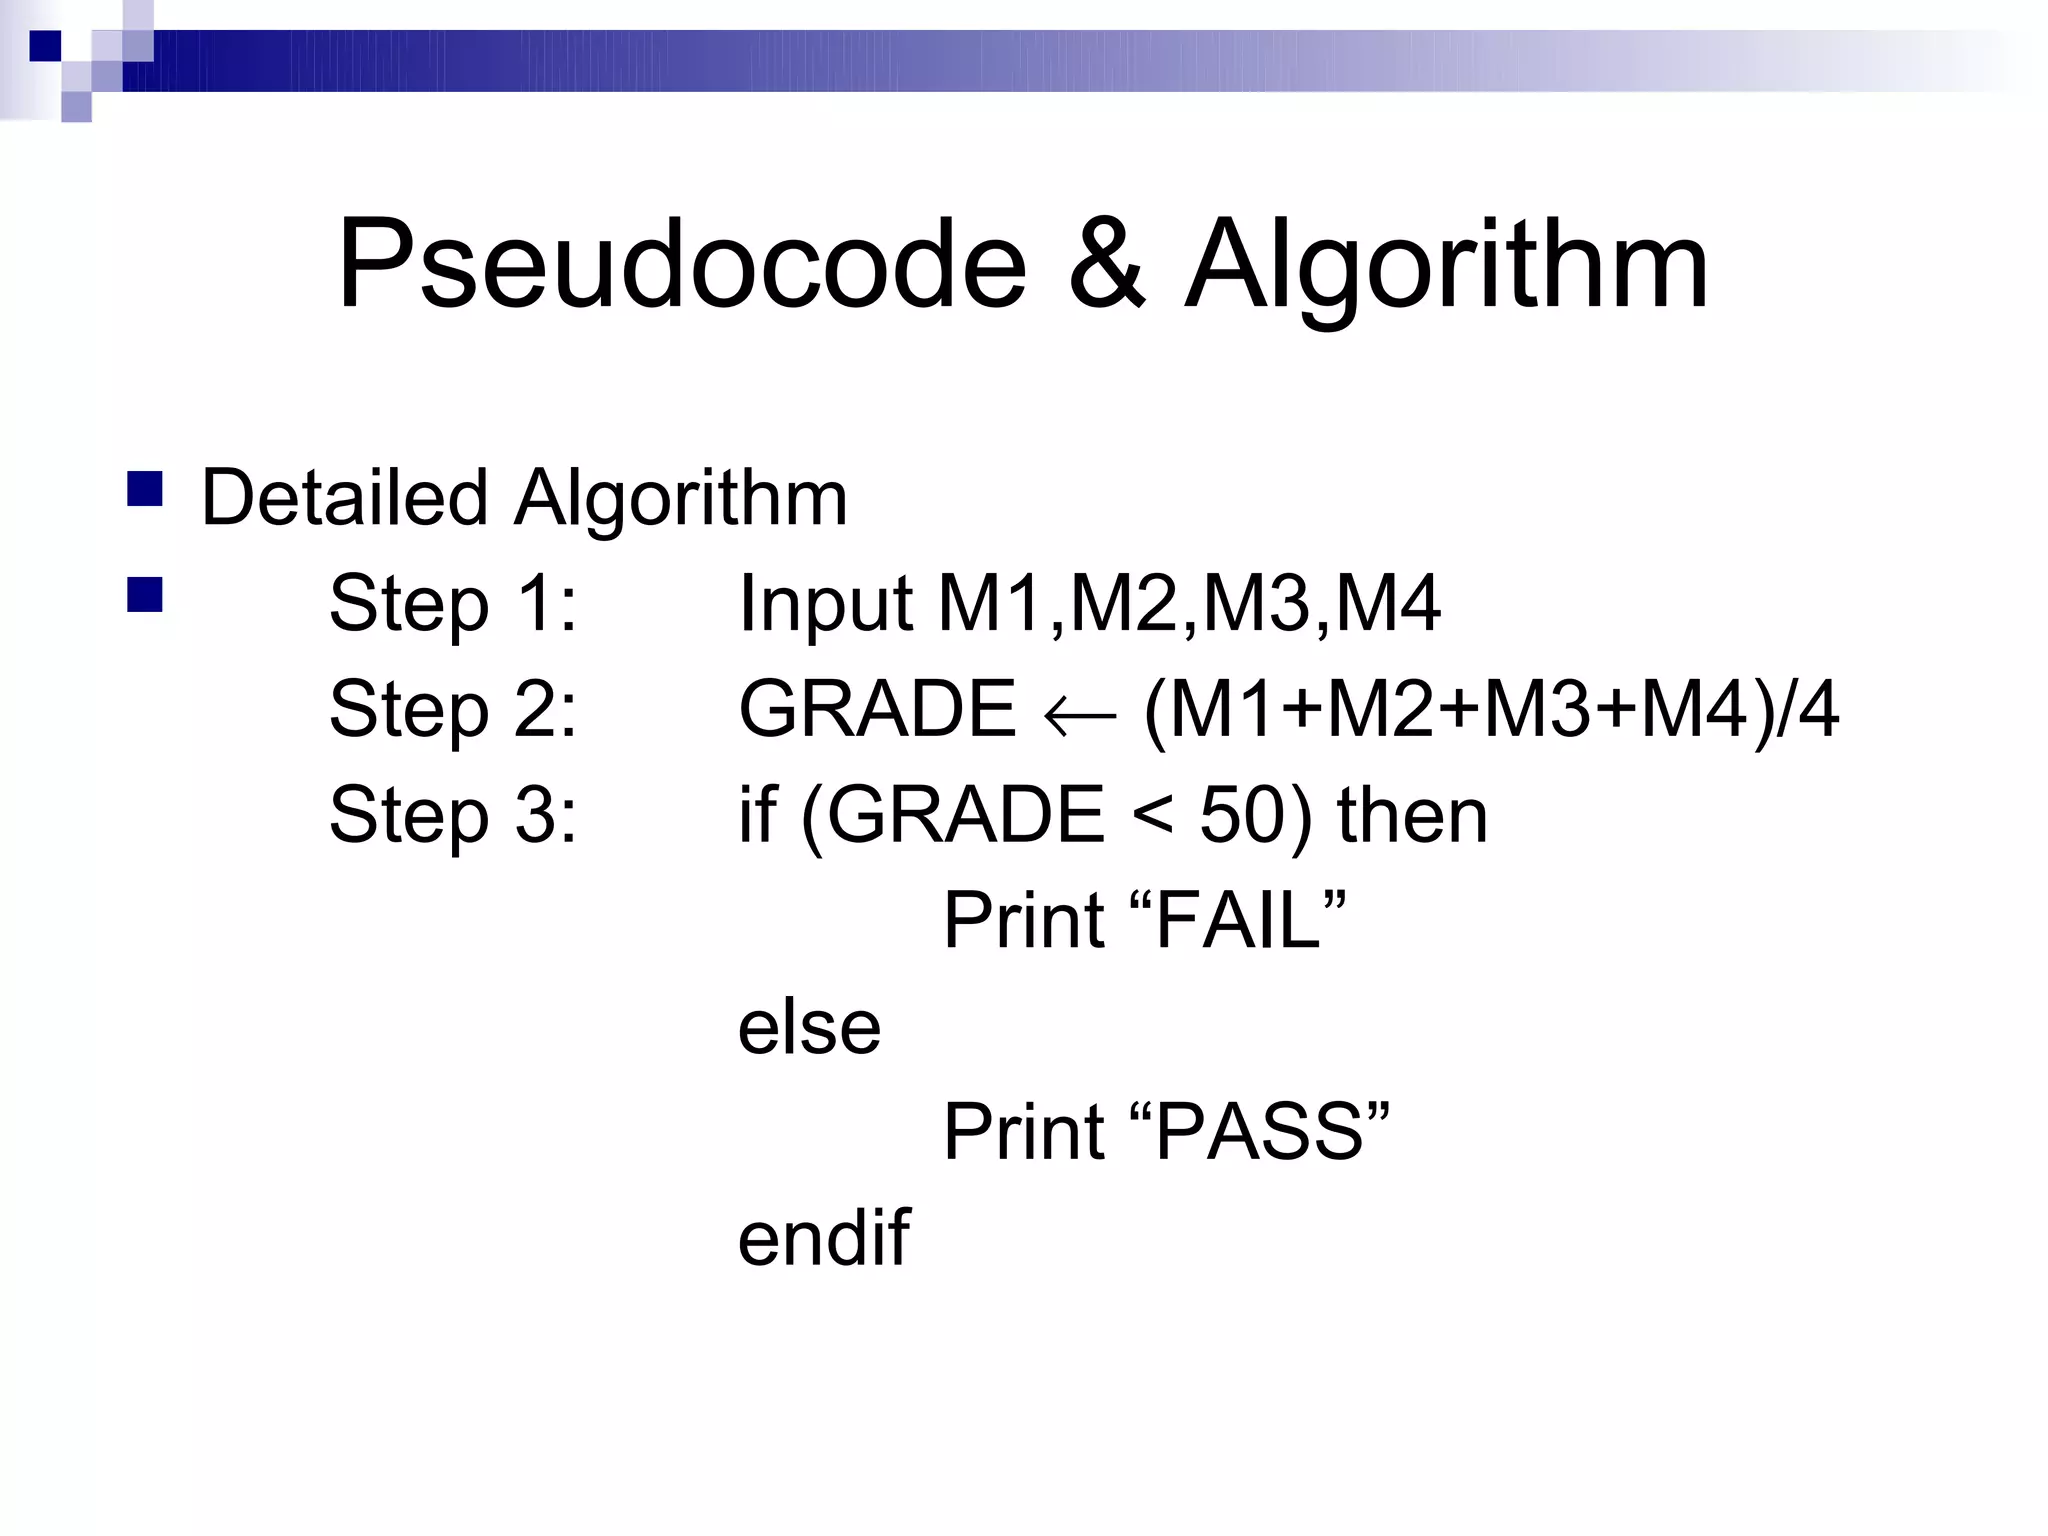
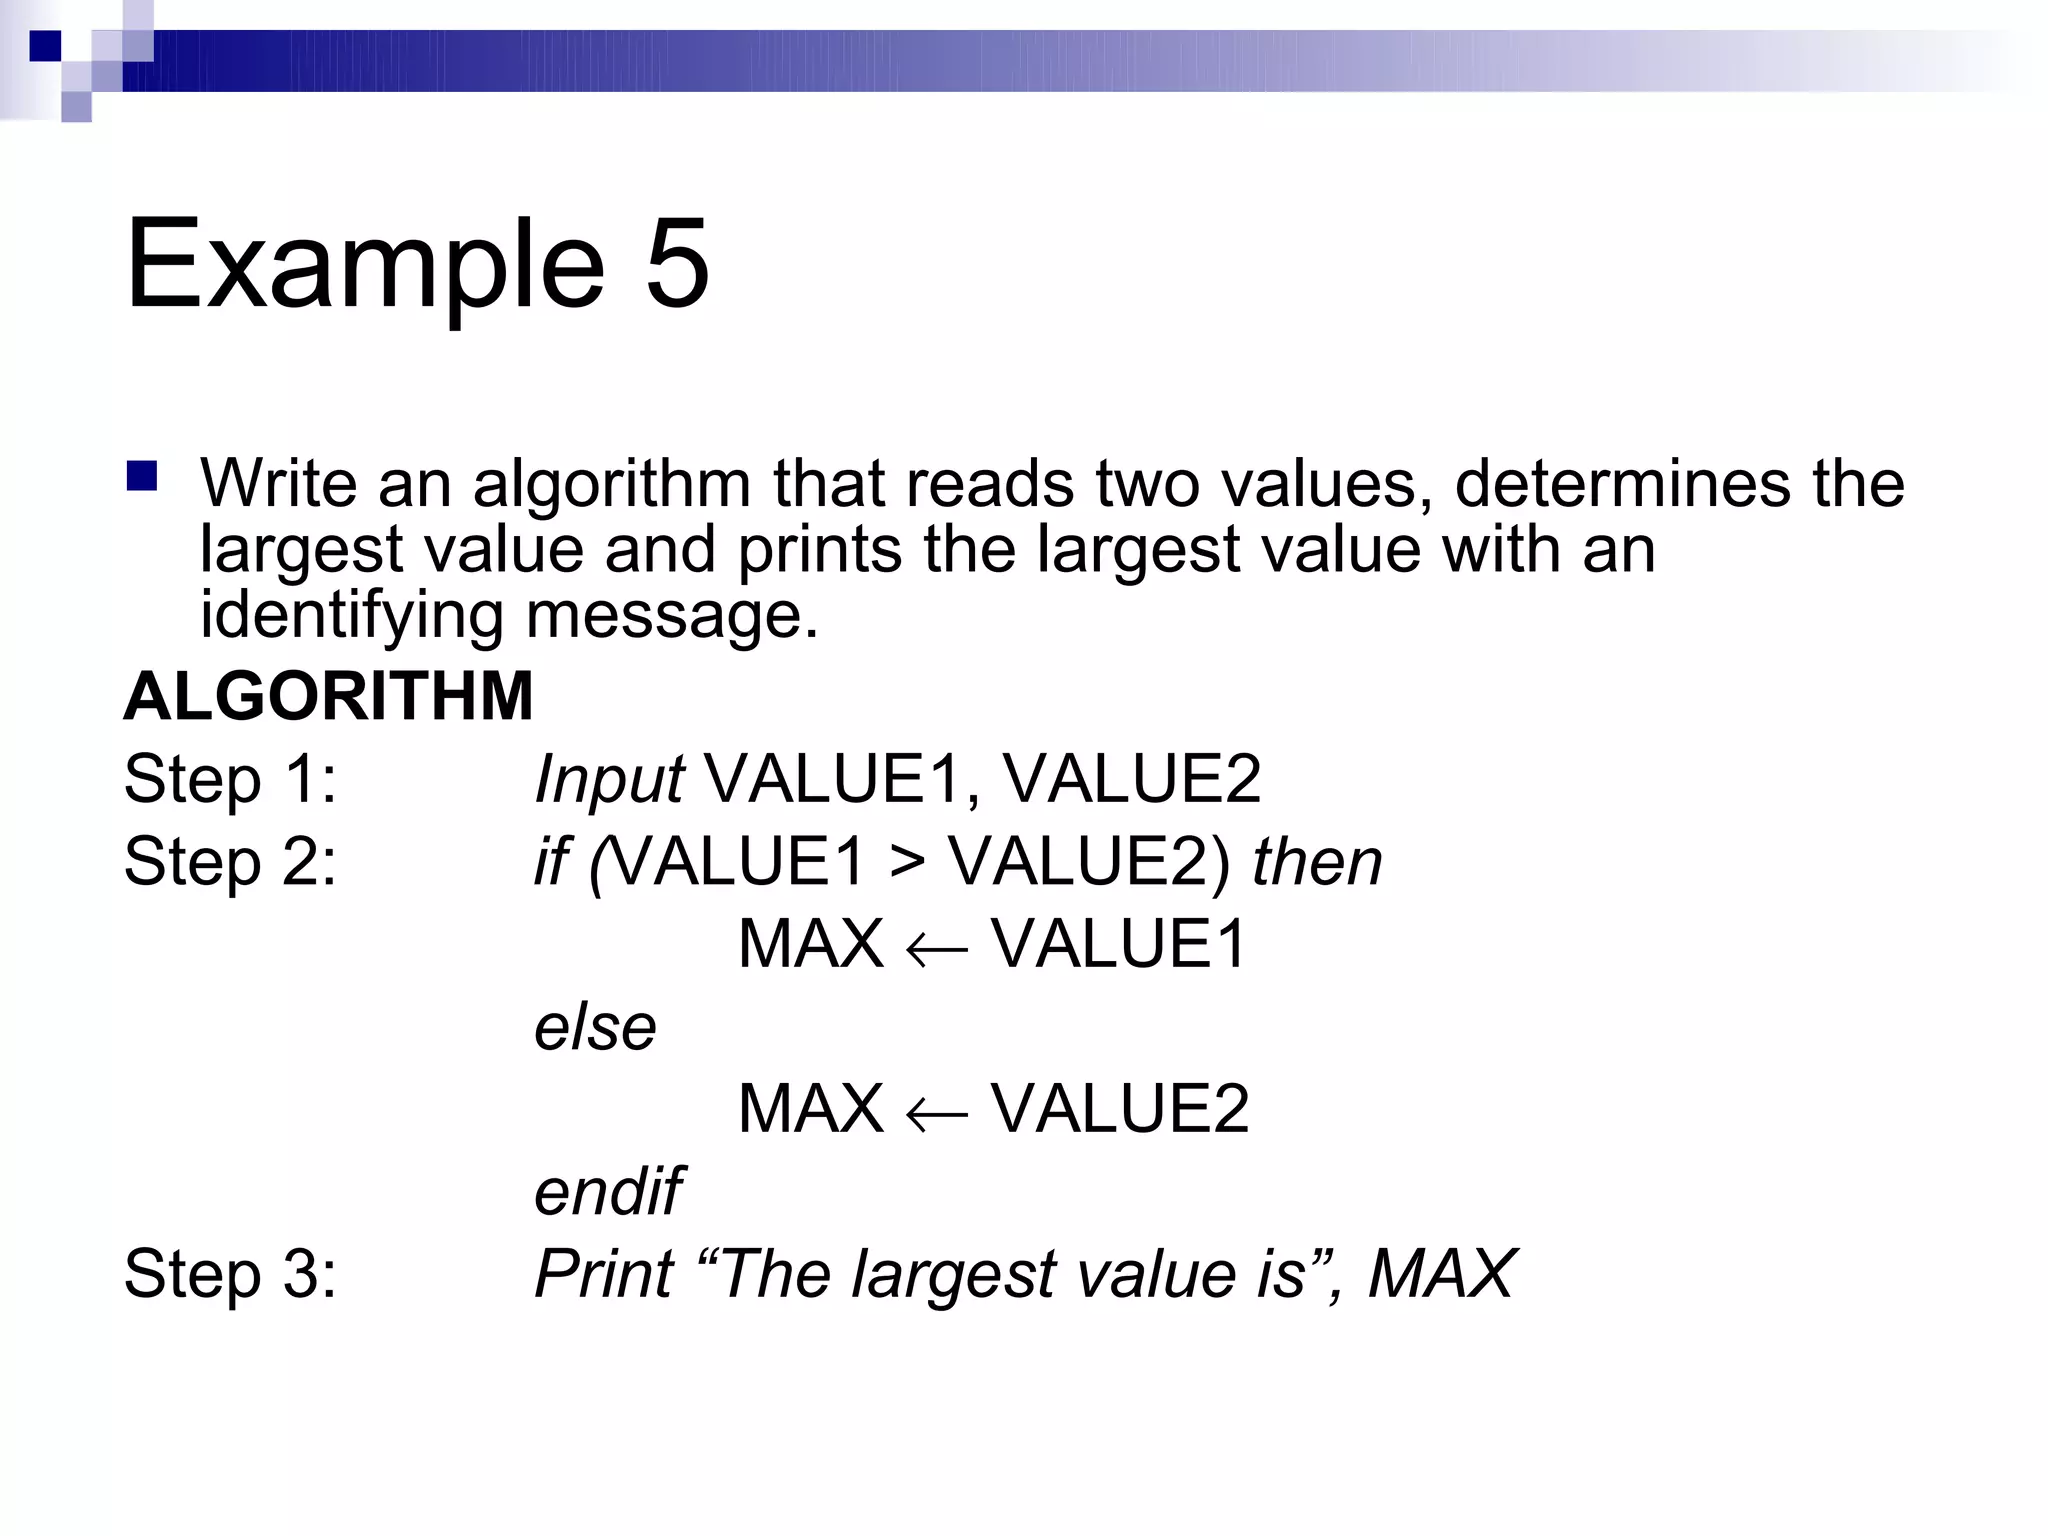
Step 1: Input N1, N2, N3
Step 2: if (N1>N2) then
if (N1>N3) then
MAX ← N1 [N1>N2, N1>N3]
else
MAX ← N3 [N3>N1>N2]
endif
else
if (N2>N3) then
MAX ← N2 [N2>N1, N2>N3]
else
MAX ← N3 [N3>N2>N1]
endif
endif
Step 3: Print “The largest number is”, MAX](https://image.slidesharecdn.com/algorithmsandflowcharts1-120830033201-phpapp02/75/Algorithmsandflowcharts1-27-2048.jpg)