
Downloaded 90 times
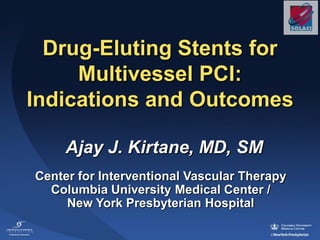

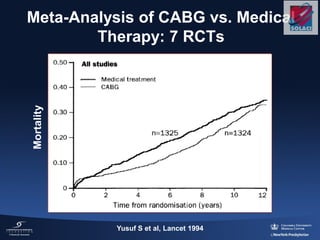
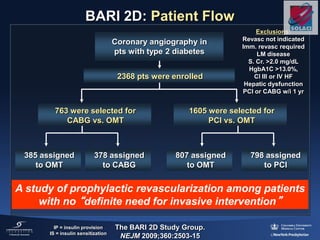
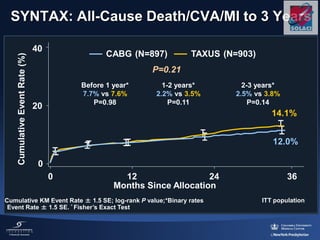
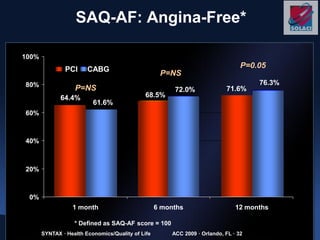
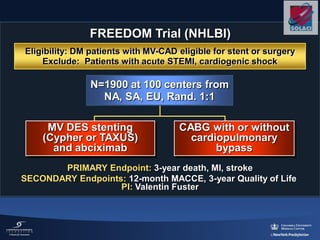
![5-year D/MI/CVA PCI vs. CABG
16.7% vs. 16.9%, P=0.69
HR [95%CI] = 0.96 [0.79-1.16]
Days
FreedomfromDeath,
StrokeandMI(%)
100
90
80
70
60
50
0 365 730 1095 1460 1825
Daemen J et al. Circulation 2008;118:1146-1154
Bare Metal Stents vs. CABG
CABG 83.1%
PCI 83.3%
4 randomized trials, 3,051 randomized pts,
5-year follow-up (patient level pooled analysis)
PLR = 0.64](https://image.slidesharecdn.com/ajay-kirtane-130514185342-phpapp01/85/Drug-Eluting-Stents-for-Multivessel-PCI-13-320.jpg)
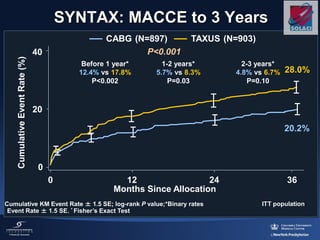
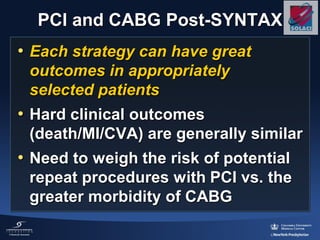
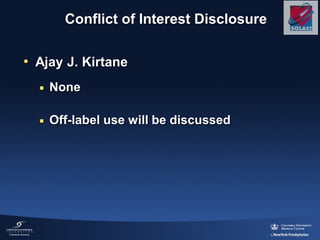
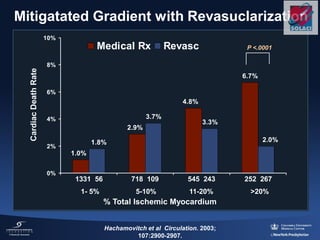
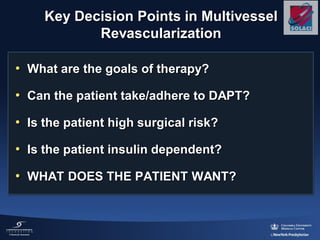
![SPIRIT II, III, IV and COMPARE trials
Pooled database analysis (n=6,789)
Ischemic TLR
P<0.001
HR: 0.60 [0.48, 0.75]
EES (n=4,247)
PES (n=2,542)
4247 4143 4004 3363
2542 2416 2328 2018
Number at risk
XIENCE
TAXUS
6.6%
IschemicTLR(%)
0
10
Time in Months
0 3 6 9 12 15 18 21 24
3891
2260
4.1%
5 4.7%
2.3%](https://image.slidesharecdn.com/ajay-kirtane-130514185342-phpapp01/85/Drug-Eluting-Stents-for-Multivessel-PCI-37-320.jpg)
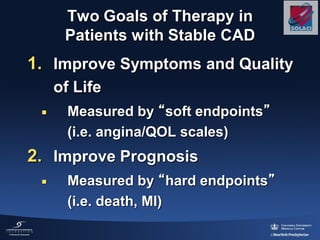
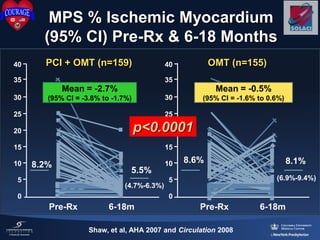
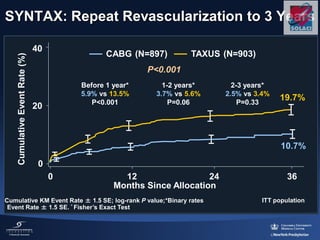
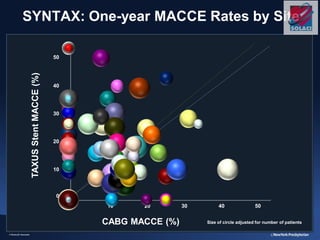
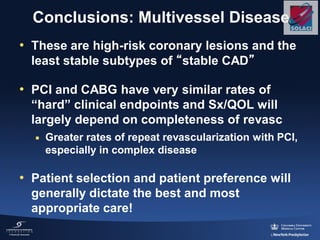
![SPIRIT II, III, IV and COMPARE trials
Pooled database analysis (n=6,789)
Stent thrombosis (ARC definite/probable)
4247 4177 4082 3479
2542 2463 2408 2110
Number at risk
XIENCE
TAXUS
2.3%
Stentthrombosis
ARCdeforprob(%)
0
1
2
3
Time in Months
0 3 6 9 12 15 18 21 24
3998
2350
0.7%
p<0.001
HR: 0.30 [0.19, 0.47]EES (n=4,247)
PES (n=2,542)](https://image.slidesharecdn.com/ajay-kirtane-130514185342-phpapp01/85/Drug-Eluting-Stents-for-Multivessel-PCI-38-320.jpg)
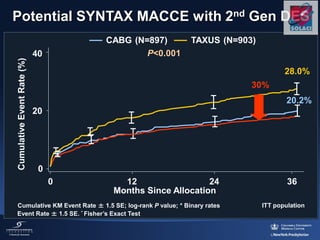
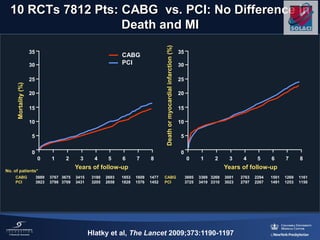
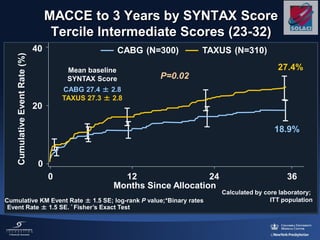
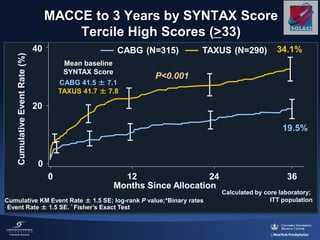
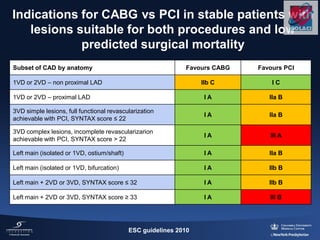
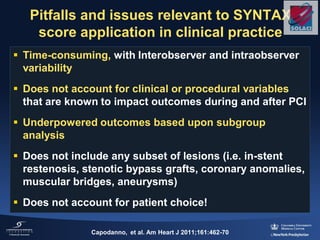
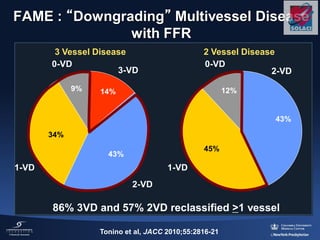
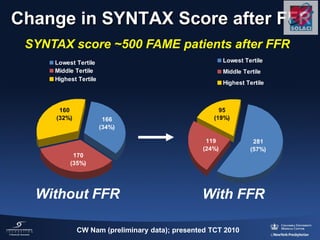
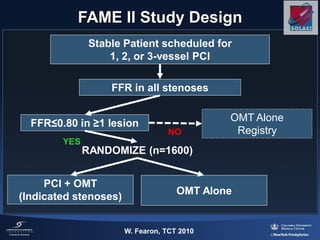
The document discusses the indications and outcomes of drug-eluting stents for multivessel PCI in patients with stable coronary artery disease (CAD), emphasizing both symptom relief and prognosis improvement. It presents data from various studies comparing revascularization methods, such as CABG and PCI, highlighting outcomes related to mortality and morbidity. The conclusions suggest careful consideration of treatment options based on patient-specific factors, including ischemia extent and overall disease complexity.


