If it can go wrong – it will
If something looks odd – it is
Apparent safe systems can fail
Issues include
Metal dusting
Methanol or hydrogen fires
Intent changes
Methanation
“Safe Systems”
If it can go wrong – it will
If something looks odd – it is
Apparent safe systems can fail
Issues include
Metal dusting
Methanol or hydrogen fires
Intent changes
Methanation
“Safe Systems”
Pre-reforming
Flow-schemes
Feed-stocks
Catalyst handling, loading & start-up
Benefits of a pre-reformer
Case studies
Effects upon primary reformer
Data analysis
Reactor temperature profiles
Catalyst management
Summary
This presentation covers frequent and costly incidents related to catalysts mal-operation with the focus of providing the plant operator with recommendations to avoid plant outages and catalyst losses.
Capacity Enhancement of Ammonia Production By The Revamping of Ammonia.
In this project, we find conversion and temperature profile of a two catalyst bed with one interbed heat exchanger ammonia converter and a three catalyst bed with two interbed heat exchanger ammonia converter both have radial flow by using a pseudo homogeneous two dimensional mathematical model on the basis of principle of conservation of mass and energy balance with the help of MATLAB pde solver.We conclude that a three catalyst bed ammonia converter give a higher conversion and lower pressure drop compare to the two catalyst bed ammonia converter for the same volume of catalyst bed and same amount of feed stock.
Reformer Tube design principles
- Larsen Miller Plot
- Larsen Miller & Tube Design
- Design Margins - Stress Data Used
- Max Allowable & Design Temperature
- Tube Life
- Effect of Temperature on Life
- Material Types
HK40: 25 Cr / 20 Ni
HP Modified: 25 Cr / 35 Ni + Nb
Microalloy: 25 Cr / 35 Ni + Nb + Ti
- Alloy Developments
- Comparison of Alloys
Manufacturing Technology
- Welds
Failure mechanisms
- Failure Mechanisms - Creep
- Creep Propagation
- Common Failure Modes
- Uncommon Failure Modes
- Failure by Creep
- Creep Rupture - Cross Section
- Failure at Weld
Actions to Take if Tube Fails
- Pigtail Nipping
Inspection techniques
Classification of Problems
- Visual Examination
- Girth Measurement
- Ultrasonic Attenuation
- Radiography
Eddy Current Measurement
LOTIS Tube Inspection
LOTIS Compared to External Inspection
Steam Reformer Surveys - Techniques for Optimization of Primary Reformer Oper...Gerard B. Hawkins
Introduction
Background Radiation and Temperature Measurement
Reformer Survey Inputs
Other Troubleshooting Tools
Safety
Preparation
Onsite Data Collection
TWT Survey
Observation/Troubleshooting
Modelling and Analysis
Results/Outputs
Case Studies
Conclusions
Case Study 1
Case Study 2
Case Study 3
Conclusions
The value of selecting the right catalyst
Selecting the key performance criteria
Sources of data:
Plant data
Laboratory reactor data
Catalyst characterization
Recommendations
Look at two main types
Explain mechanisms
Explain prevention of cracking
Three main types
1 Carbon cracking
2 Boudouard carbon formation
3 CO reduction
Purpose
Key to good performance
Problem Areas
Catalysts, heat shields and plant up-rates
Burner Guns
Development of High Intensity Ring Burner
Case Studies
Conclusions
Le samedi 23 avril, à 14h, au Dernier Bar avant la fin du monde à Paris, il y a une nouvelle Session de Rattrapage Geek par l’association The Geek Side.
Vous avez souvent entendu parler de manga mais n’avez qu’une vague idée de ce que c’est ? Genma, élevé avec Youpi L’école est finie et le Club Dorothée, vous présentera ce qu’est un manga, vous fera découvrir quelques références et auteurs classiques du genre des années 70 à 90. Des moments de nostalgie "Ah oui je m’en rappelle" 100 garanti ! Eric, lui, viendra compléter tout ça en abordant les auteurs et oeuvres plus contemporaines.
Deux générations de geek - otaku seront donc là pour vous faire passer un super moment duquel vous ressortirez en se disant qu’on aura jamais assez de cette vie et des suivantes pour profiter de la richesse de la culture geek !
This article describes a project on which Koch Modular Process Systems designed and supplied a distillation system to recover ethylene from an olefins plant purge stream.
Thermal plant instrumentation and controlShilpa Shukla
Detail working description of each components used in A Thermal or Coal based Plant for generation of electricity. Controlling and automation is described.
Key Process Considerations for Pipeline Design BasisVijay Sarathy
Prior to venturing into an oil & gas pipeline project, the project team would require a design basis, based on which the project is to proceed. Oil & Gas Pipeline design begins with a route survey including engineering & environmental assessments. The following document provides a few key considerations for process engineers to keep in mind, the factors that matter when preparing a pipeline design basis from a process standpoint.
2. 2015 AIChE Spring Meeting __________________________________________________________
Quick and Easy Troubleshooting of a Packed Tower:
Thermal Imaging as a Novel Method
J. H. Barnard
(Corresponding Author)
Sasol Ltd, Secunda Synfuels Operations
PdP Kruger Street, Secunda, 2302
hendri.barnard@sasol.com
E. P. Du Toit
Sasol Ltd, Secunda Synfuels Operations
PdP Kruger Street, Secunda, 2302
Keywords: thermal imaging, packed distillation tower, maldistribution, troubleshooting
Abstract
This paper presents thermal imaging as a successful troubleshooting method for packed
distillation towers. A distillation tower showed poor performance in the top section, indicated by
an unstable top temperature. The methodology of investigation combined surveys drawn from
the equipment’s available instrumentation on temperature, pressure and flow, together with
taking thermal scans to identify possible root causes of the poor performance. The thermal scans
explicitly uncovered severe maldistribution throughout the tower, ranging from the top packed
bed and pump around system all the way down the bottom of the tower. The thermal scans
clearly show the vapour channeling up one side of the tower with the liquid channeling down the
other side; there were no indications of flooding.
A damaged bed limiter, pump around liquid distributor and random packing were identified as
the main possible root causes of the poor performance prior to entering the tower. The tower
internals were inspected and it was found that the random packing in the top bed was fouled,
conglomerated and severely crushed. A support grid was installed as a bed limiter and some of
the random packing conglomerates were stuck in the grid, contributing to the maldistribution.
The maldistribution was completely rectified with the installation of a new bed limiter together
with new random packing. This study shows that thermal imaging can effectively be used to
troubleshoot packed towers on an industrial scale.
3. 2015 AIChE Spring Meeting __________________________________________________________
1. Introduction
The effects of maldistribution in packed towers are well understood in industry. It is however
difficult to determine the extent of the maldistribution within a packed bed while the tower is still
in operation. Even though traditional troubleshooting methods like pressure surveys and
studying the temperature profiles can partly reveal where the problem originates, these methods
require a high level of experience and is often time consuming. The interpretation of gathered
data by various analysts will also differ, and any theory can only be confirmed by
decommissioning the tower, leading to downtime and production loss.
This paper presents an alternative method of troubleshooting industrial scale packed towers.
An acid gas scrubber, operating with an unstable top section temperature profile, was the test
subject of this novel method. Traditional troubleshooting methods were applied with no
conclusive results. The tower was decommissioned; the top section was inspected and no major
defects were found. After commissioning the top temperature remained unstable.
For the investigation presented in this paper, an infra-red (IR) camera was used for further
troubleshooting and the images clearly revealed fluid channeling in the packed section of the
tower. If this was known beforehand, it would have been clear that an inspection of the top tray
section would be unnecessary.
Thermal imaging offers the opportunity to visually inspect the inside of an uninsulated packed
tower while it is still in operation. This eliminates unnecessary downtime and production losses.
It also allows for detecting the origin of the problem and a limited level of skill is involved for
capturing images for troubleshooting and interpretation.
2. Process Description
The purpose of the acid gas scrubber is to remove all the water and carbon dioxide from
ammonia, yielding ammonia of a higher concentration. In the tower the ammonium carbonation
reaction is used to ensure that all the carbon dioxide is removed from the ammonia before
sending the ammonia for further purification. The ammonia would be in excess and this causes
the carbon dioxide to reacts till completion. The excess ammonia is removed at the top of the
tower.
Two sections of packing are used to enlarge the contact area for the reaction to take place. The
reaction is an exothermic reaction where excess heat must be removed and this is done by middle
and top pump around systems. Figure 1 shows a simplified process flow diagram of the acid gas
scrubber and supporting equipment.
4. 2015 AIChE Spring Meeting __________________________________________________________
Distilate
Reflux
Top Pump
Around Pump
Top Pump
Around Cooler
Middle Pump
Around Pump
Middle Pump
Around Cooler
Bottoms
Feed
Bottom Pump
Around Pump
Bottoms
Pump
Bottom Pump
Around Cooler
Acid Gas Scrubber
Packing
Section1
PackingSection2
Trap Out Tray 2
Trap Out Tray 1
Trap Out
Tray 3
CWS
CWR
CWS
CWR
CWS
CWR
Inspected
Section
Side
Draw
Figure 1: Simplified process flow diagram of the acid gas scrubber tower.
The overheads product from a preceding tower enters the tower below the first tray. Steam in the
feed to the tower needs to be condensed which is done by a bottom pump around system. The
bottoms pump around and cooler configuration is used for temperature control of the bottom
section.
The middle and top pump around systems are utilized to address the temperature dependency of
the formation reaction for ammonium carbonate; temperature is controlled to favor the formation
reaction. A stream from the Trap Out Tray 2 in the middle section is pumped through the middle
pump around cooler to attain the required temperature after which it is then reintroduced above
Packing Section 1.
5. 2015 AIChE Spring Meeting __________________________________________________________
The vapour leaving the middle pump around passes through a chimney tray into the upper
middle section of the tower. The top pump around system also aids in the formation of
ammonium carbonate. A stream from Trap Out Tray 3 is drawn off and pumped through the top
pump around cooler and reintroduced above the second section of random packing in the upper
middle section of the tower. A stream with a high purity of ammonia is used as a reflux and is
introduced right at the top of the tower. This stream also controls the temperature at the top of
the tower and washes down any the ammonium carbonate present. The ammonium carbonate is
removed from the tower at Trap Out Tray 1 by the side draw.
3. Problem Definition
The factory consists of two phases that operate in parallel. One of the acid gas scrubber towers
was experiencing an unstable top temperature. The top temperature of this tower was swinging
10 °C higher and 10 °C lower than the set point and this posed a risk contamination of the
overheads product to the downstream units. The top temperature is usually very stable and any
upset in this temperature can cause the overhead stream to be contaminated with the unwanted
acid gases. The tower was decommissioned, and no major defects were found.
4. Conventional Troubleshooting
The following steps were taken to try and alleviate the problem:
• It was found that the temperature transmitter used for the control of the top temperature
was operated outside its specified range. The range was corrected but this did not lead to
any improvement in the temperature control;
• The top temperature control loop was investigated. The control loop was found to be
functioning as intended. It had the same tuning parameters as for the acid gas scrubber
towers on the other phases;
• The temperature at the bottom of the top section was determined to be much higher than
on the other phases, indicating that the problem might actually be in the middle section of
the tower;
• The top reflux, fed to the top of the tower which plays an integral part in controlling the
top temperature, was investigated and it was found to be different when compared to the
other phases. This could also be detected by visual inspection as this was the only reflux
line that indicated ice formation on the outside of the line. The tower operation was
adjusted to allow for similar compositions of the reflux when compared to the other
phases. This resolved the ice formation on the line and did influence the temperature,
however the temperature at the bottom of the top section remained higher than normal;
• The performance of the tower was investigated, all pump around temperatures and tower
pressures were within normal operating limits; and
• Finally thermal scans of the tower were taken to determine if the packing inside the
middle section of the tower was still intact.
6. 2015 AIChE Spring Meeting __________________________________________________________
5. Thermal Imaging Results and Discussion
The following thermal scans were captured of two acid gas scrubber towers. Pictures of the
unstable tower (Tower 1) were compared to a tower showing stable operation (Tower 2).
Figure 2 shows the IR scans of the top section of the acid gas scrubber (Western side of the
tower), while Figure 3 is a simplified general arrangement drawing of the top section of the acid
gas scrubber.
Figure 2: Thermal scans taken of the top section of the acid gas scrubber towers. Tower 1 (on the Left)
is the tower showing the deviations from normal operations. Tower 2 (on the right) shows stable
operation.
Trays
Distillate Outlet
Top Pump
Around ReturnLiquid
Distributor
Man Hole
Vent
Reflux
Distributor
Figure 3: A simplified internals schematic drawing of the top section of the acid gas scrubber tower.
7. 2015 AIChE Spring Meeting __________________________________________________________
From Figure 2 it can be seen that there is a different temperature distribution in Tower 1 when
compared to Tower 2. The average operating temperature of the section just above the liquid
distributor is 45 °C (the temperature seen in Tower 2), Tower 1 shows a maximum temperature
of 52.5 °C. Towards the top of the tower the same temperature differences can be seen with
Tower 1 operating 6.9 °C higher than Tower 2. The bottom right side of Tower 1 in Figure 2
also shows a cold spot which is the first sign of liquid/vapour maldistribution.
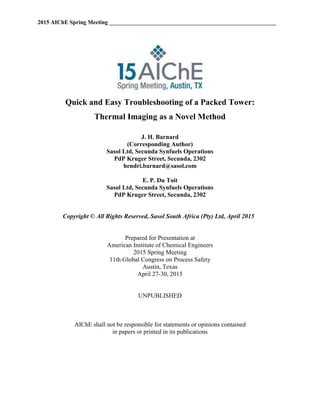
Figure 4 below shows the IR scans of the top pump around return section of the acid gas
scrubber (Western side of the tower), while Figure 5 is a simplified general arrangement drawing
of the middle pump around return section of the acid gas scrubber.
Figure 4: Thermal scans taken of the top pump around return section of the acid gas scrubber towers.
Tower 1 (on the Left) is the tower showing the deviations from normal operations. Tower 2 (on the
Right) shows stable operation.
8. 2015 AIChE Spring Meeting __________________________________________________________
Top Pump
Around ReturnLiquid
Distributor
Packing Section 2
Man Hole
Man Hole
Figure 5: A simplified internals schematic drawing of the top pump around return section of the acid gas
scrubber tower.
From Figure 4 it can be seen that there is a large temperature gradient in the cross-section view
of Tower 1 with a maximum cross-sectional temperature difference of 27 °C. When this is
compared to the same section of Tower 2 the maximum cross-sectional temperature is only
2.1 °C indicating a more uniform radial temperature distribution. Visual inspection of the
thermal scans clearly indicates that the liquid and vapour is unevenly spread through the packing
in Tower 1.
The position of the cold spot when compared to the general arrangement drawing of this section
(Figure 5) shows that the liquid/vapour maldistribution originates from the top pump around
return line. The preliminary conclusion was made that this was due to the liquid distributor
being damaged or fouled, causing the liquid/vapour maldistribution starting from this section or
channeling of liquid and vapour through the random packing section. Packed towers are very
sensitive to distribution and maldistribution is detrimental to packing efficiency (Kister; 1990:
35).
In order to investigate the temperature effect the maldistribution has on the entire tower, thermal
scans were taken from a distance away, allowing for visual inspection of both the top section of
the tower as well as the entire middle pump around. Figure 6 shows the IR scans of the top
section as well as the entire middle pump around section of the acid gas scrubber (South-Eastern
side of the tower). Figure 7 is a simplified general arrangement drawing of the top and middle
pump around section of the acid gas scrubbers.
9. 2015 AIChE Spring Meeting __________________________________________________________
Figure 6: Thermal scans taken of the top as well as the top pump around section of the acid gas scrubber
towers. Tower 1 (on the Left) is the tower showing the deviations from normal operations. Tower 2 (on
the Right) shows stable operation.
From Figure 6 it can be seen that there is a definite maldistribution when comparing Tower 1
with Tower 2 can be seen. The South-Eastern side of Tower 1 is much colder than the same side
of Tower 2. This maldistribution propagates through the entire middle pump around of Tower 1.
Tower 2 also shows a much better temperature distribution through-out tower.
This indicates that there is a maldistribution of the liquid and vapour throughout the entire top
packing (Packing Section 2) of the tower – the cause of the temperature instabilities seen in the
top section.
10. 2015 AIChE Spring Meeting __________________________________________________________
Trays
Distillate Outlet
Top Pump
Around ReturnLiquid
Distributor
Man Hole
Vent
Reflux
Distributor
Packing Section 2
Packing Section 1
Man Hole
Chimney Stand Pipe
Top Pump
Around Outlet
Trap Out Tray 3
Figure 7: A simplified internals schematic drawing of the top and top pump around section of the acid
gas scrubber tower.
It was decided to take more scans from different angles around the towers to try and match what
was seen on Figure 6. Figure 8 and Figure 9 were taken from different angles and the
maldistribution can be seen on all of these scans.
11. 2015 AIChE Spring Meeting __________________________________________________________
Figure 8: Thermal scans taken of the top as well as the middle section of the acid gas scrubber towers.
Tower 1 (on the right) is the tower showing the deviations from normal operations. Tower 2 (on the left)
shows stable operation.
Figure 9: Thermal scans taken of the top as well as the middle pump around section of the acid gas
scrubber towers. Tower 1 (on the right) is the tower showing the deviations from normal operations.
Tower 2 (on the left) shows stable operation.
The vapour liquid maldistribution can be seen on both Figure 8 and Figure 9. Figure 8 shows the
hotter side of Tower 1 while Figure 9 shows the colder side of Tower 1. In both these pictures
Tower 2 shows an evenly distributed temperature through-out the entire tower.
From the thermal scans the three main deviations possibly contributing to the observed vapour
liquid maldistribution were identified as:
Uneven or damaged top pump around liquid distributor.
Blocked or damaged random packing.
Blocked or damaged bed limiter.
12. 2015 AIChE Spring Meeting __________________________________________________________
6. Internal Inspections and Findings
Tower 1 was opened during the routine statutory maintenance turnaround. The top pump around
liquid distributer was inspected and no deviations were found.
Figure 10 and Figure 11 below show findings from the inspection of the packing as well as the
hold down grid.
Figure 10: Damaged random packing removed from the packing sections.
Figure 11: Support grid installed as a bed limiter and damaged packing and fouling causing blockages in
the support grid.
Figure 10 shows the damaged and fouled random packing which was found in packing section 2.
The maintenance team struggled to remove the packing due to the packing being crushed and
sticking together. Fouled and damaged random packing leads to liquid and vapour
maldistribution through packing sections and can cause the severe temperature gradient observed
in the packing section. Liquid distribution plays a vital role in the effective operation of a
packed tower. Poor distribution reduces the effective wetted packing and promotes liquid
channeling (Xu, 2000). The random packing was replaced with new packing.
13. 2015 AIChE Spring Meeting __________________________________________________________
Figure 11 shows the random packing being stuck in the support grid, installed as a bed limiter,
contributing to the maldistribution seen on the IR images. Upon further investigation it was
found that support grid was installed when the original hold down grid was unavailable. A hold
down grid should not be used with plastic packing. Since the hold down grid rests directly on
packing it can lead to the plastic packing being compressed (Kister; 1990: 223). The support
grid was removed and replaced with a new bed limiter seen in Figure 12.
Figure 12: New bed limiter before it was installed.
7. Conclusion
From the case study presented it is clear that thermal imaging proves to be a viable option in
packed tower troubleshooting. The benefit of being able to visually inspect the flow pattern
inside a packed tower while it is in operation cannot be overstated. Regular visual inspections of
this kind even allows for identifying problems even before it has any major effect on production.
These thermal scans can be used to identify problems with equipment before they are
decommissioned for statutory maintenance. Thus proving to be a significant aid in planning
ahead and procurement of spares to ensure that downtime is minimized.
Furthermore, troubleshooting packed towers in the traditional way, using pressure and
temperature surveys, are time consuming and more regular than not requires a great deal of
expertise. However, thermal imaging offers the opportunity to perform a temperature-based
visual inspection on the flow patterns inside the tower. Very little expertise is required for
capturing the images and defects can easily be identified by anyone that regularly inspects the
thermal scans for a specific tower. The thermal scans can also aid in improving the
understanding of flow patterns within a tower.
One major drawback for the use of thermal imaging is that the tower’s lagging/insulation would
need to be removed before the thermal image can be taken. However, depending on the type of
lagging/insulation and the size of the column, the costs of removal and replacement of
lagging/insulation to understand what the current operation in the tower is can be insignificant
when compared to product loss or increased utility usage.
14. 2015 AIChE Spring Meeting __________________________________________________________
8. Acknowledgements
We gratefully acknowledge the support and input of our supervisor Carla Cronje, without which
this study could not have been completed. We thank Jakes van der Walt for his help and reliance
on us regarding the use and availability of the infrared camera. Furthermore we would also like
to thank the various anonymous reviewers for their feedback.
9. References
[1] Kister, HZ (1990) Distillation Operation, McGraw-Hill, New York
[2] Xu, SX (2000) “Quantitatively Measure and Assess Maldistribution in Industrial
Packed Towers”