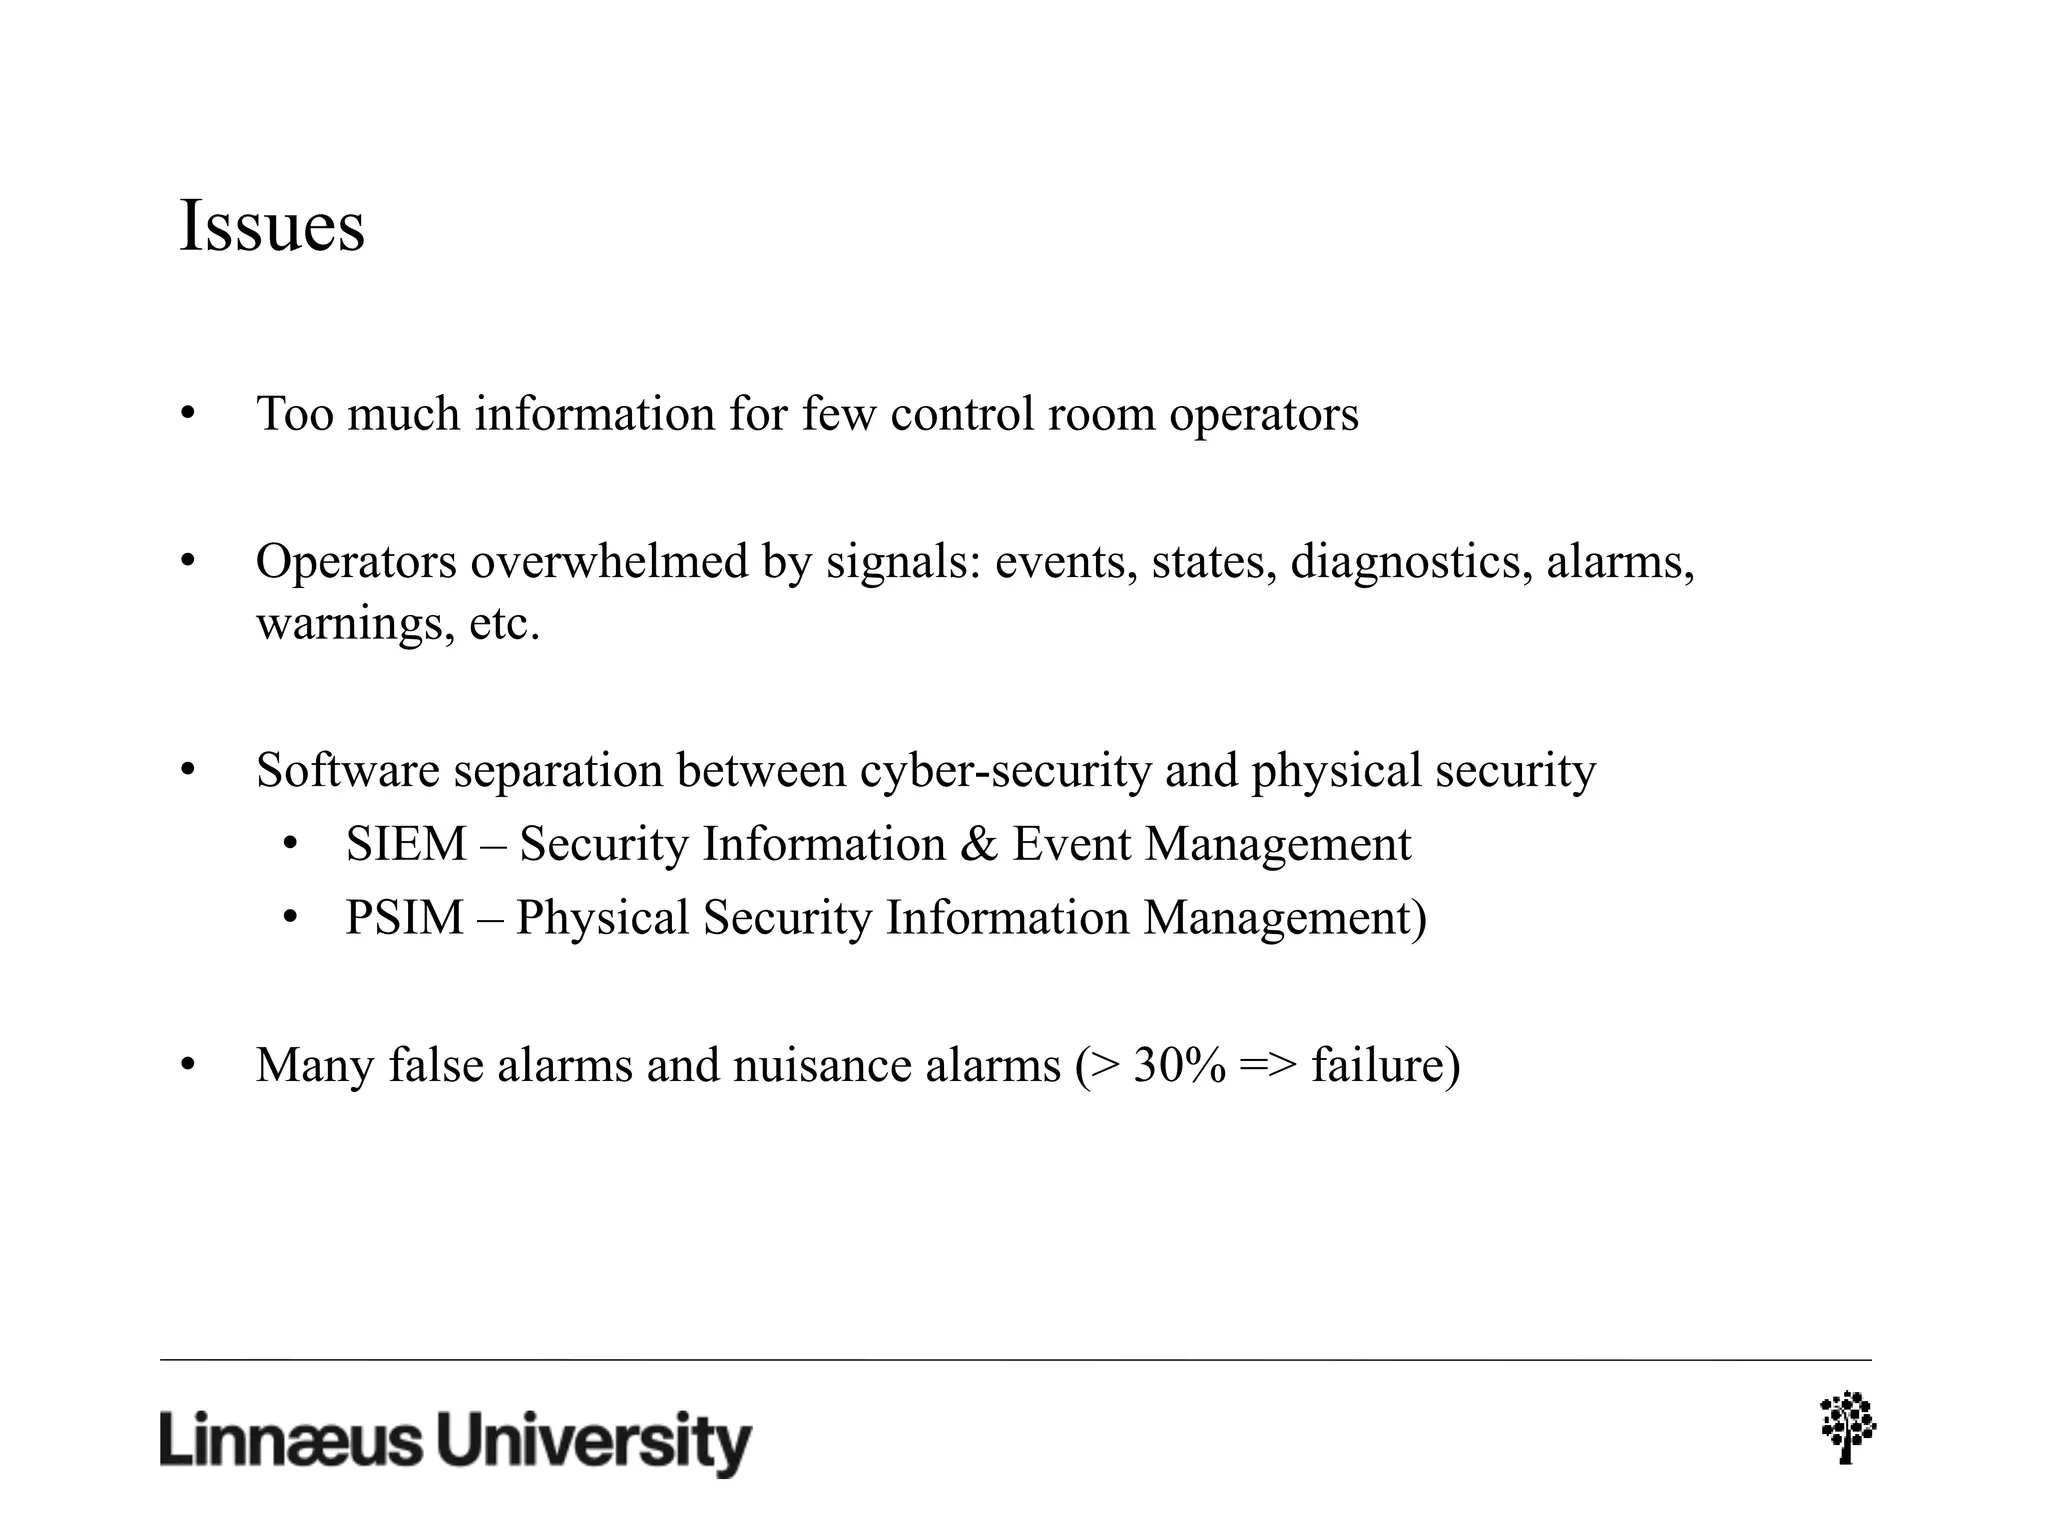
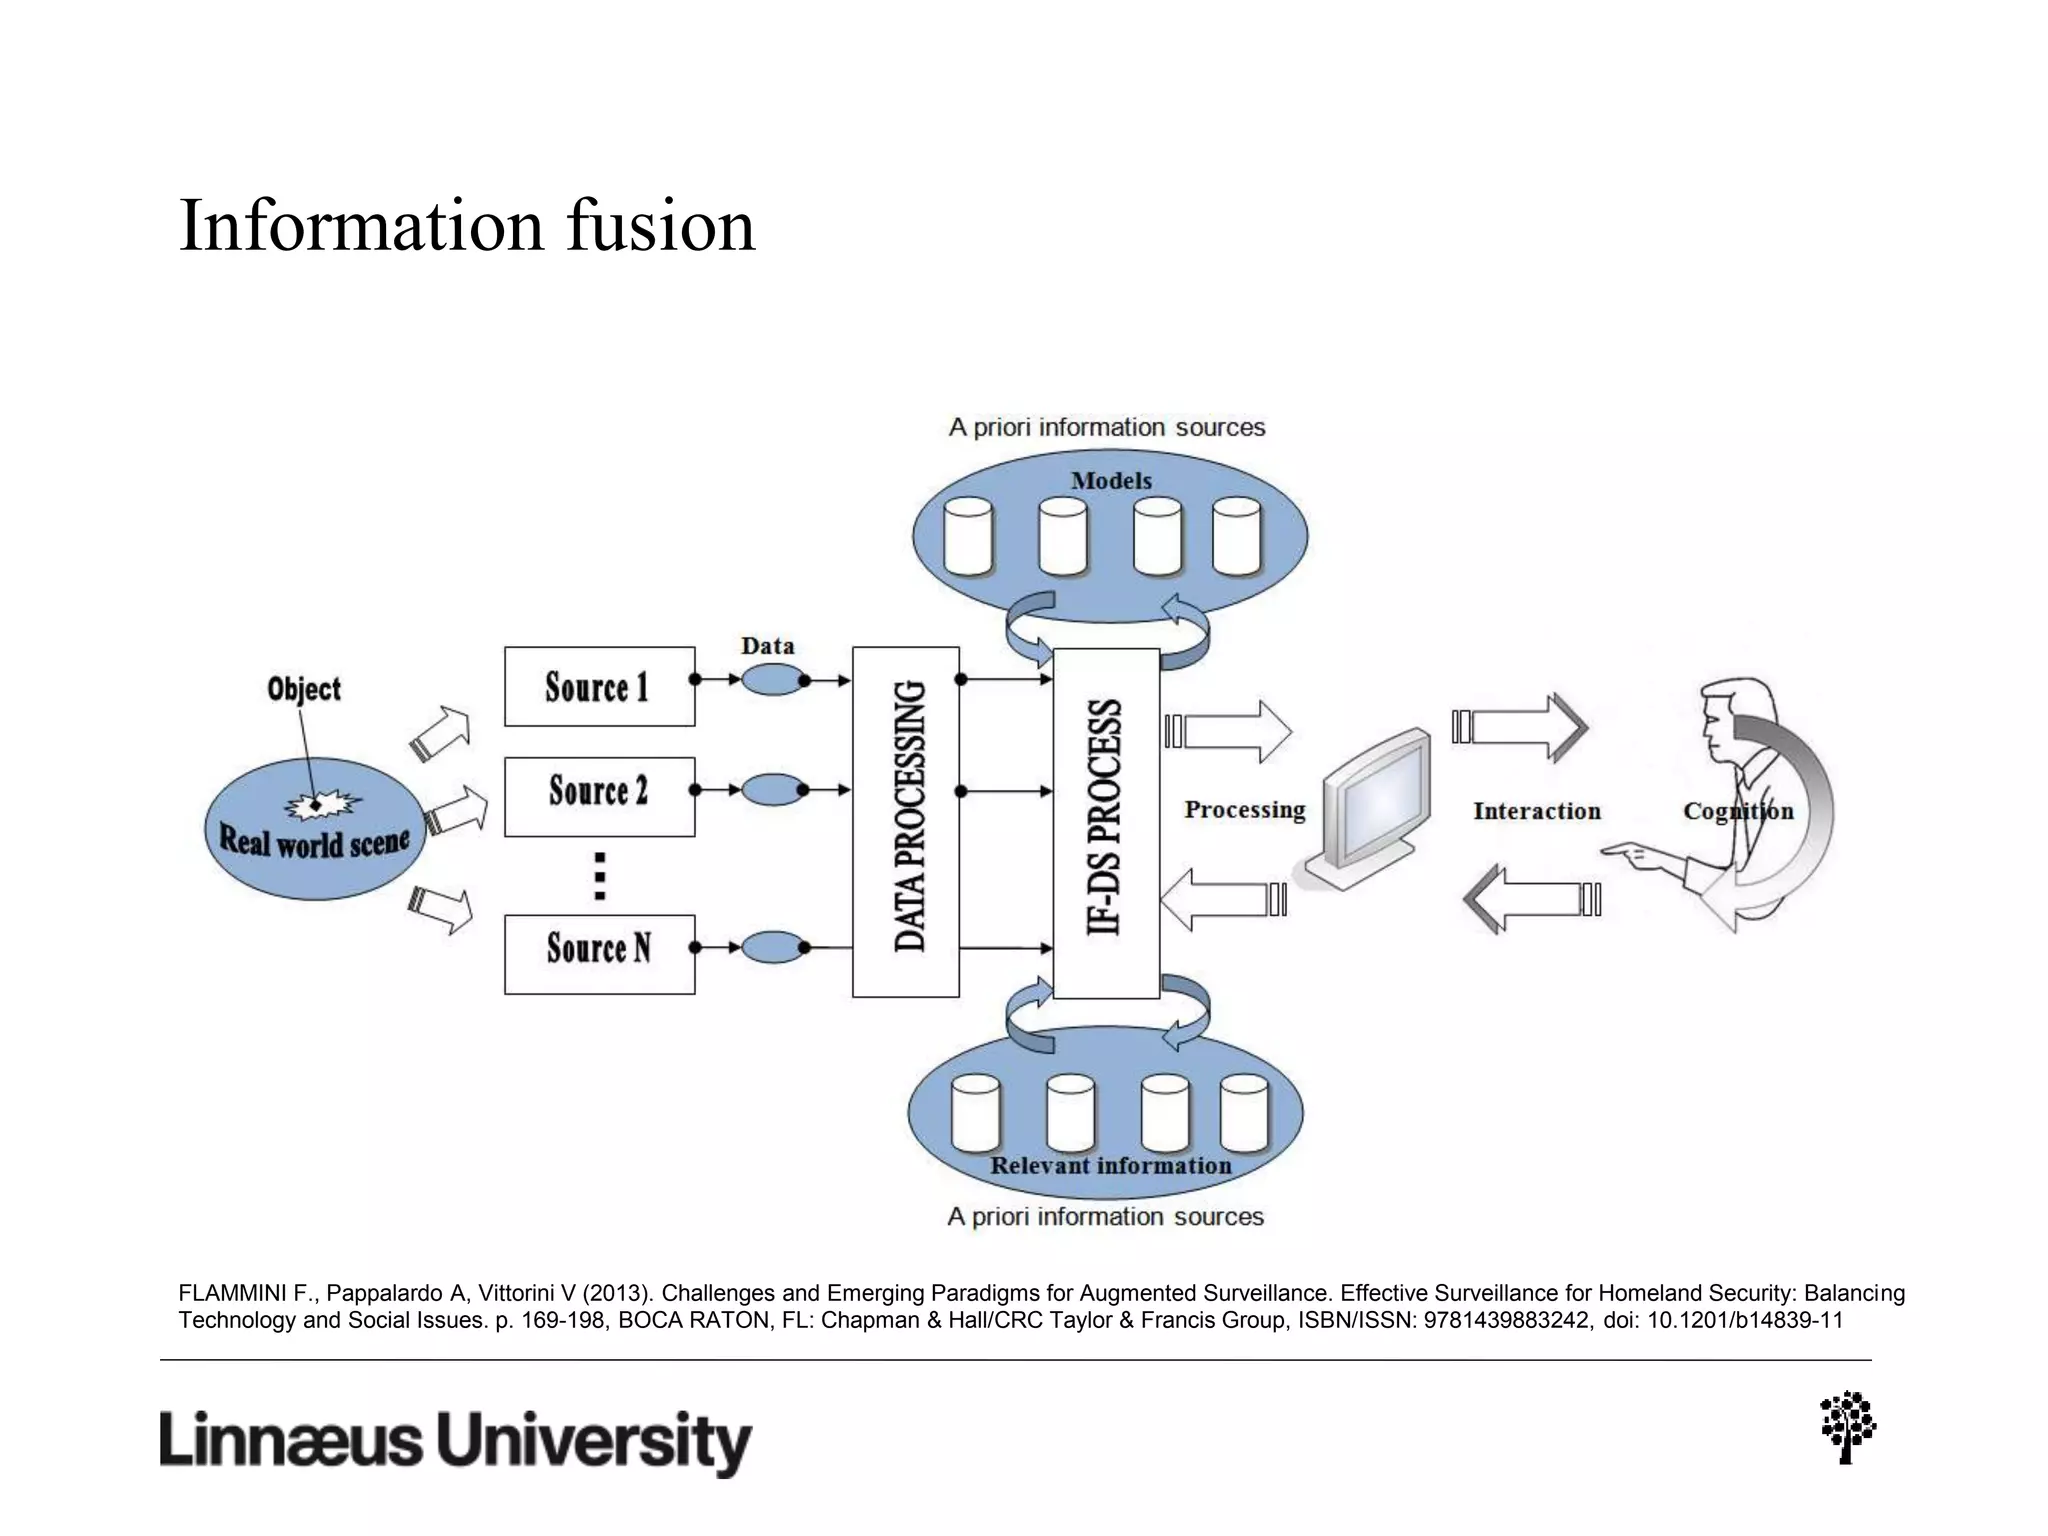
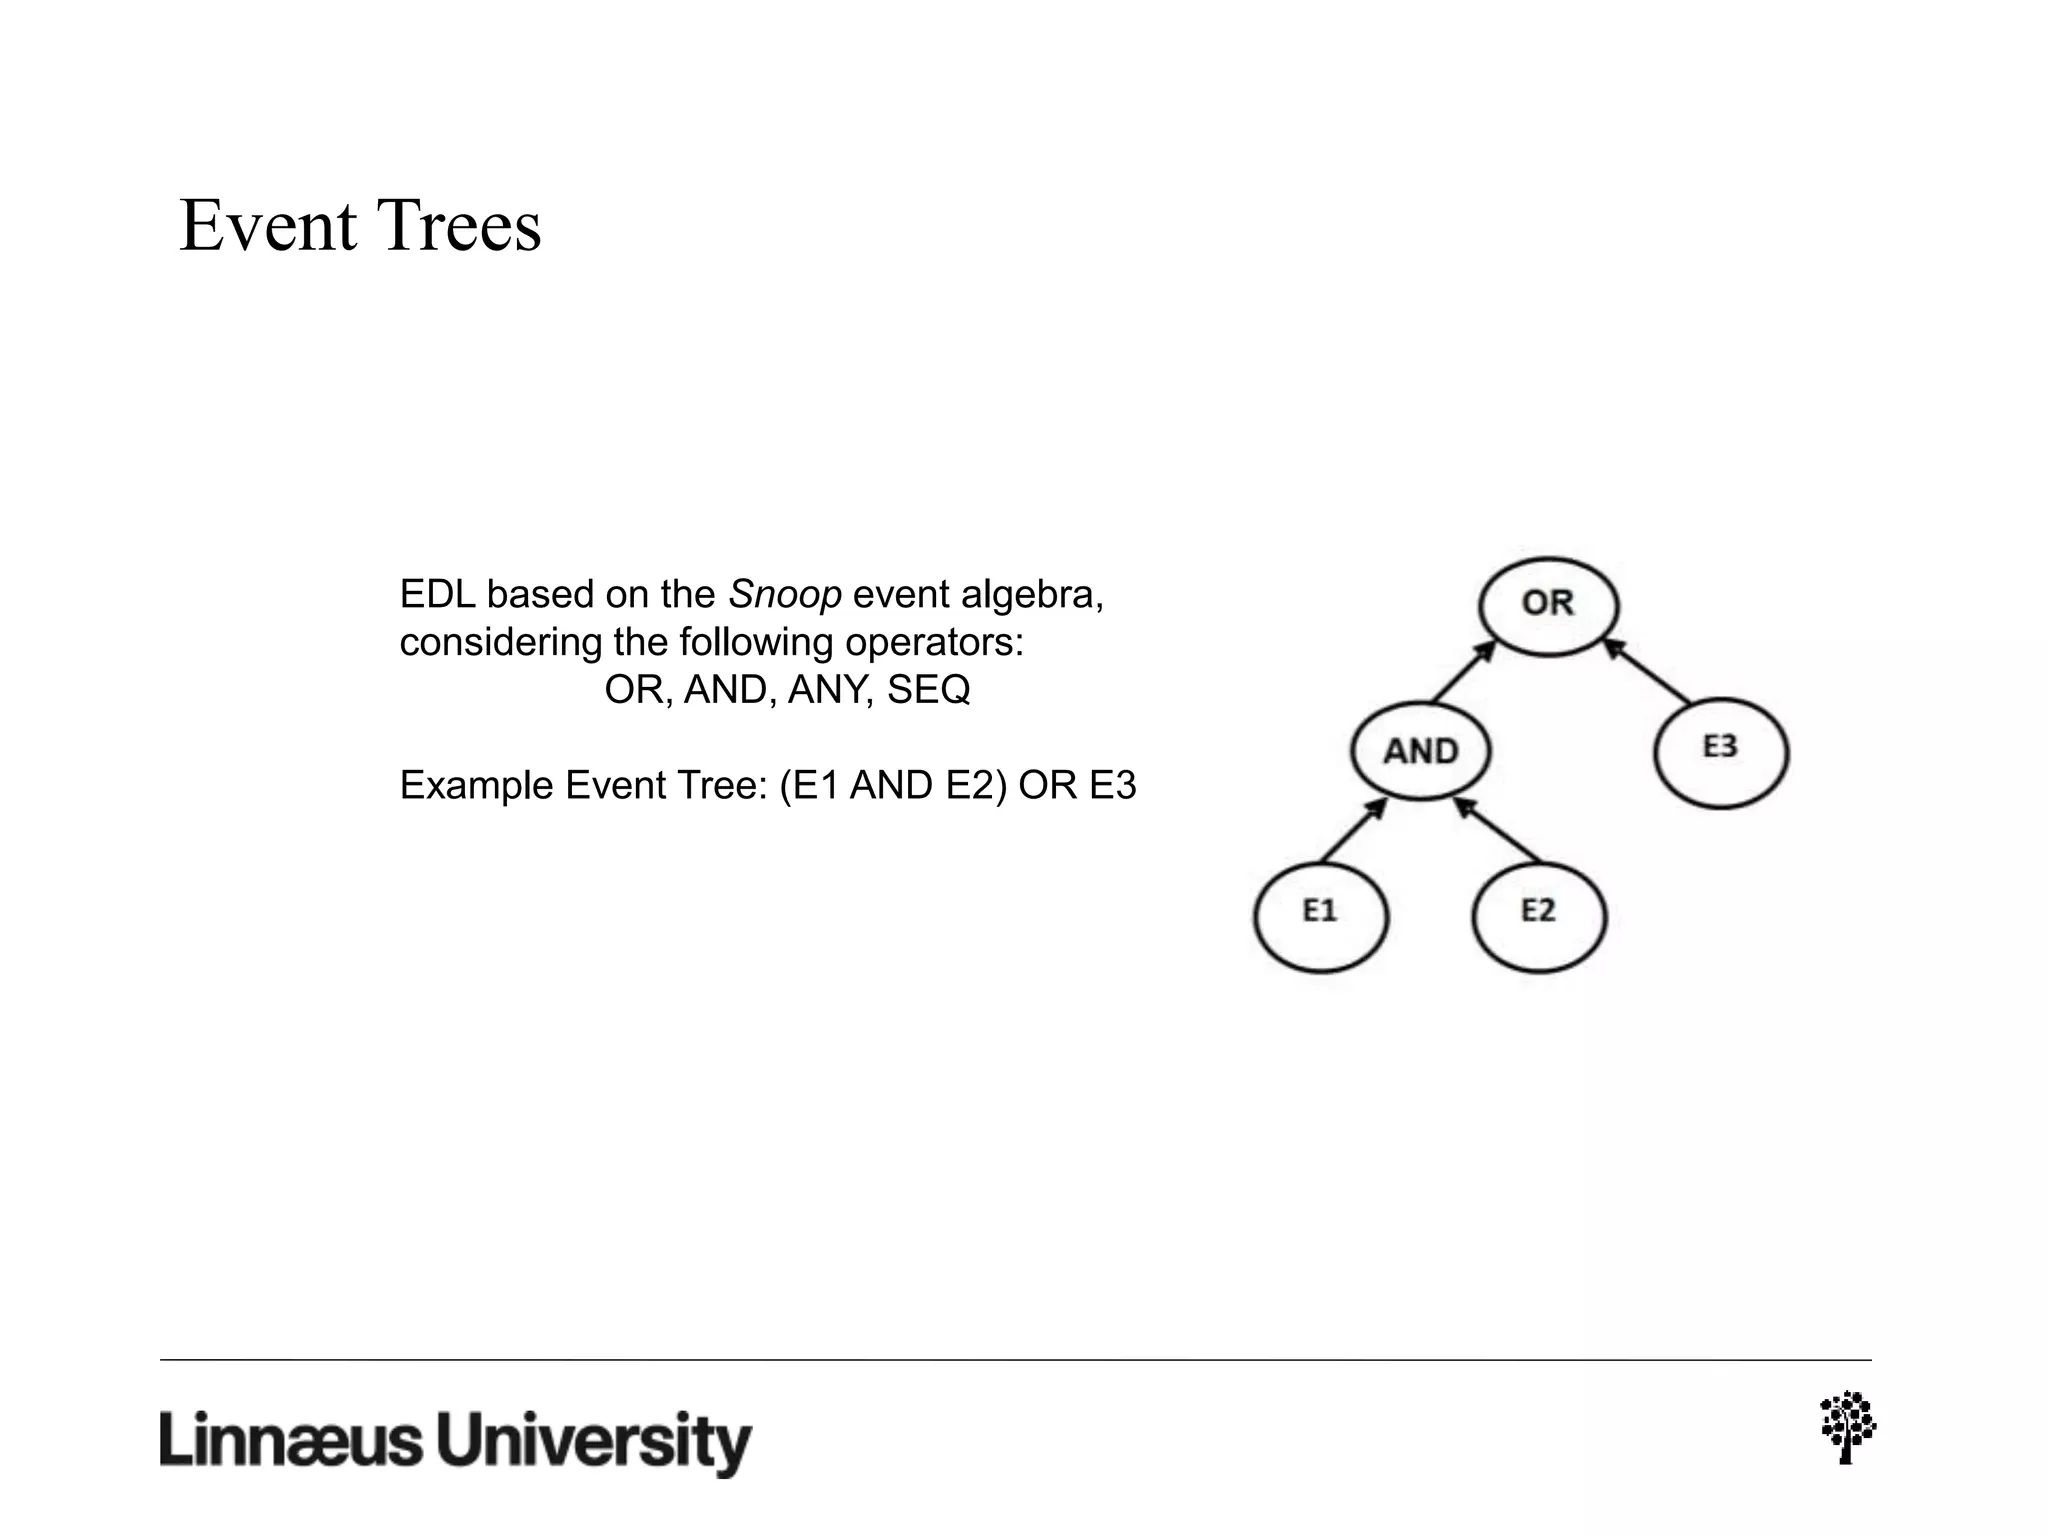
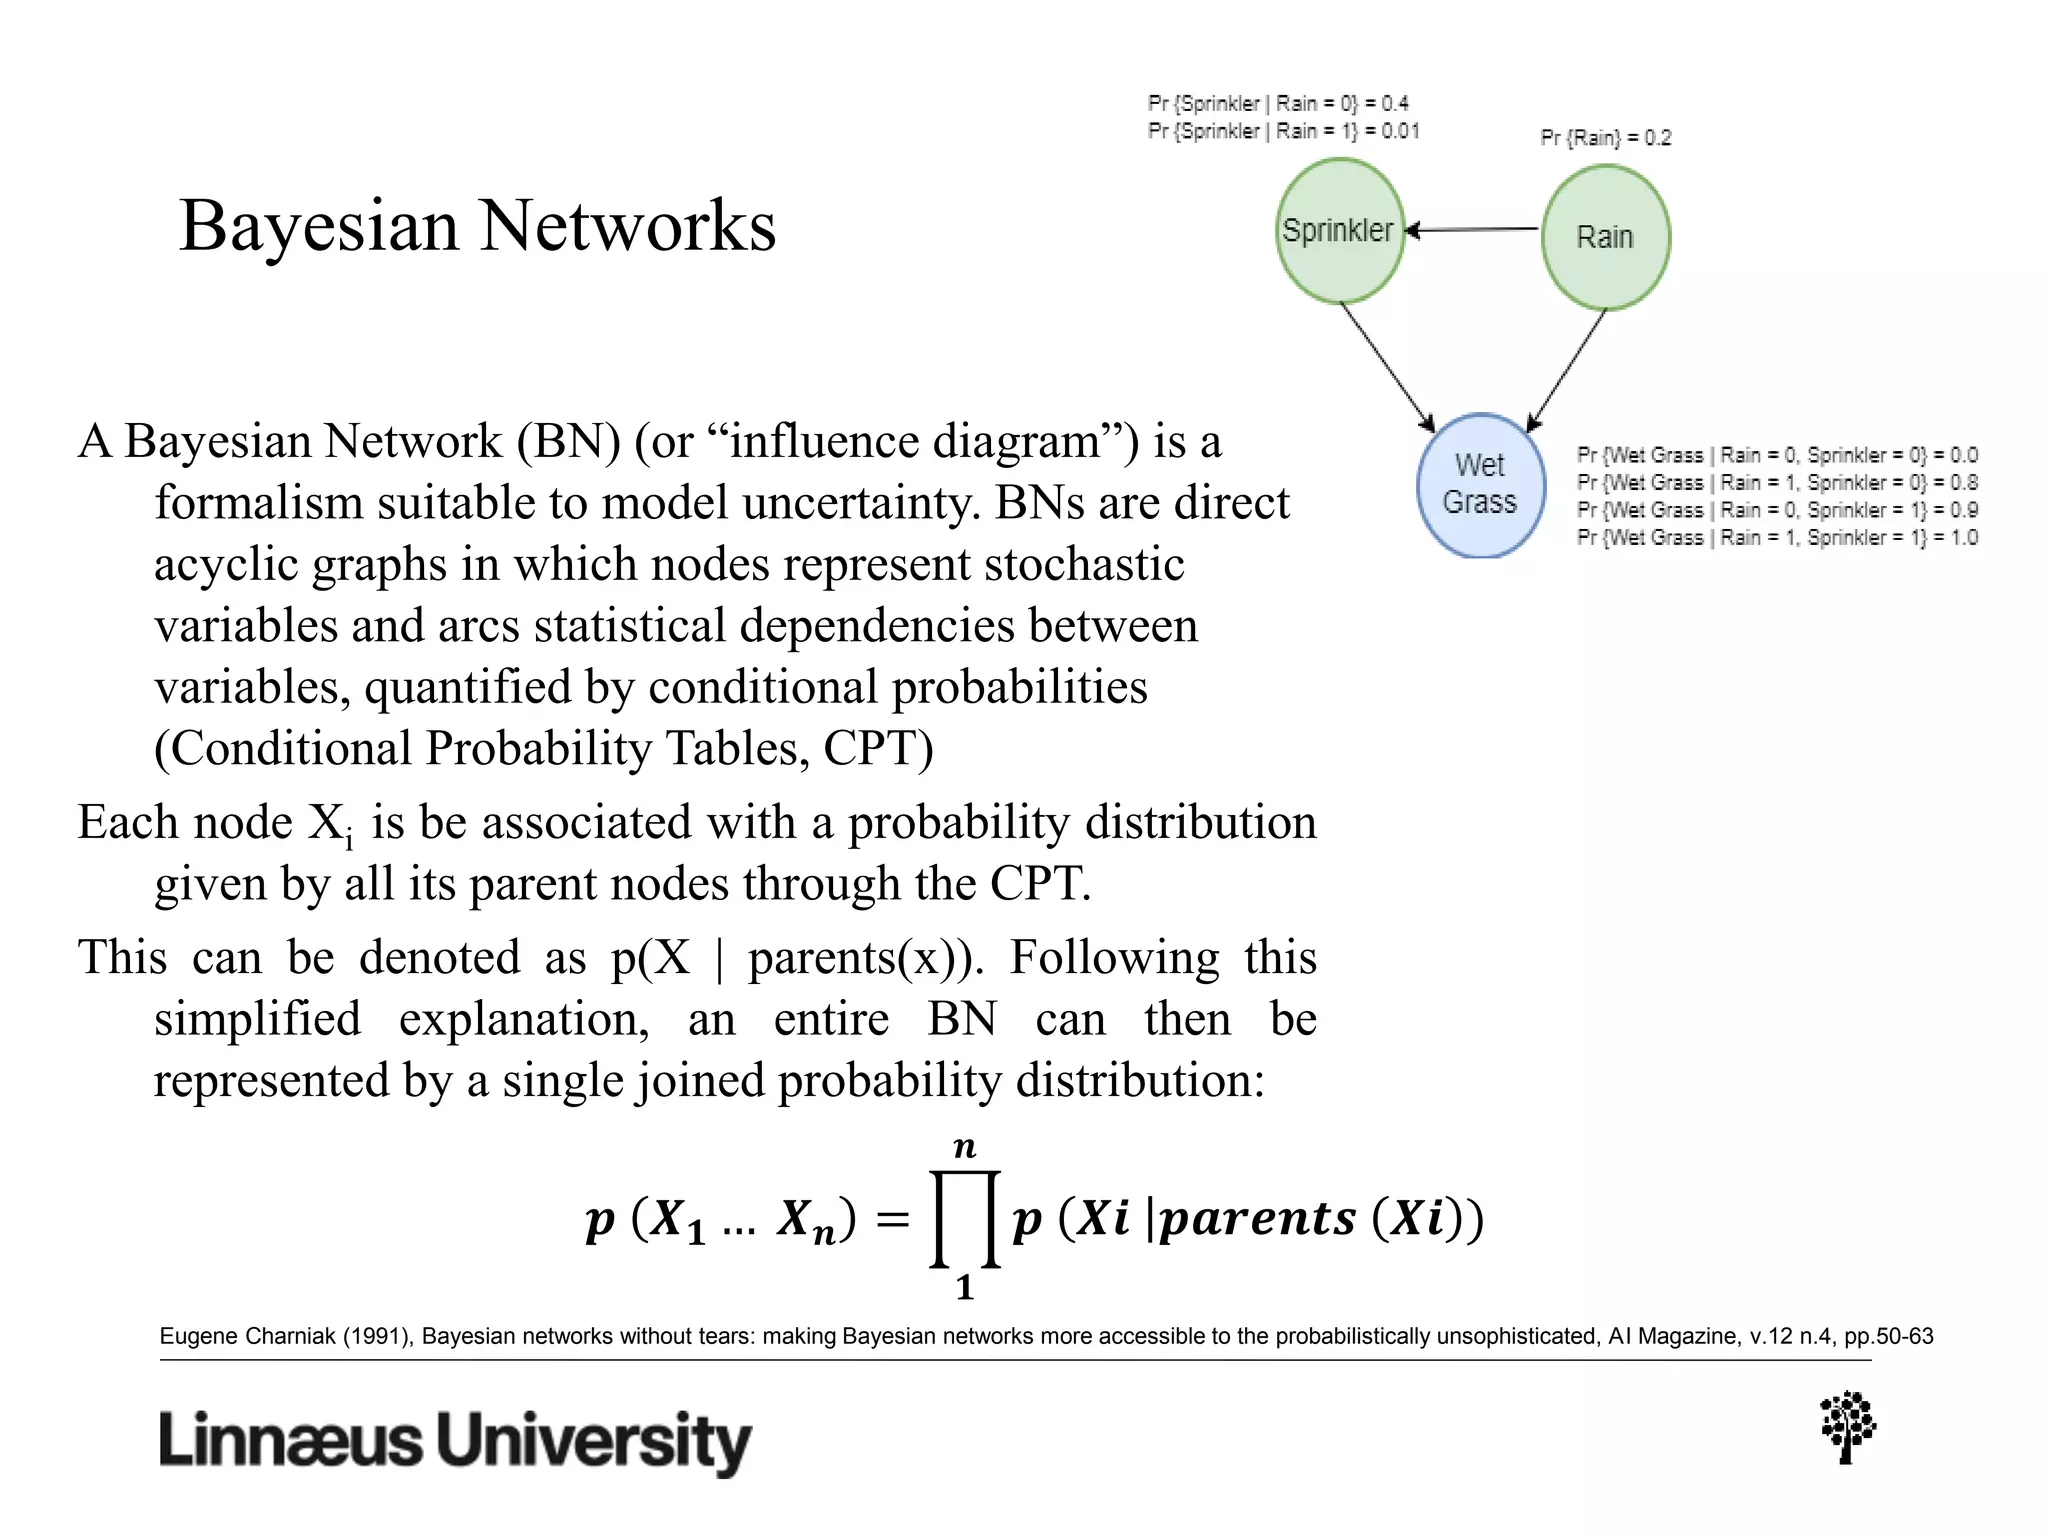
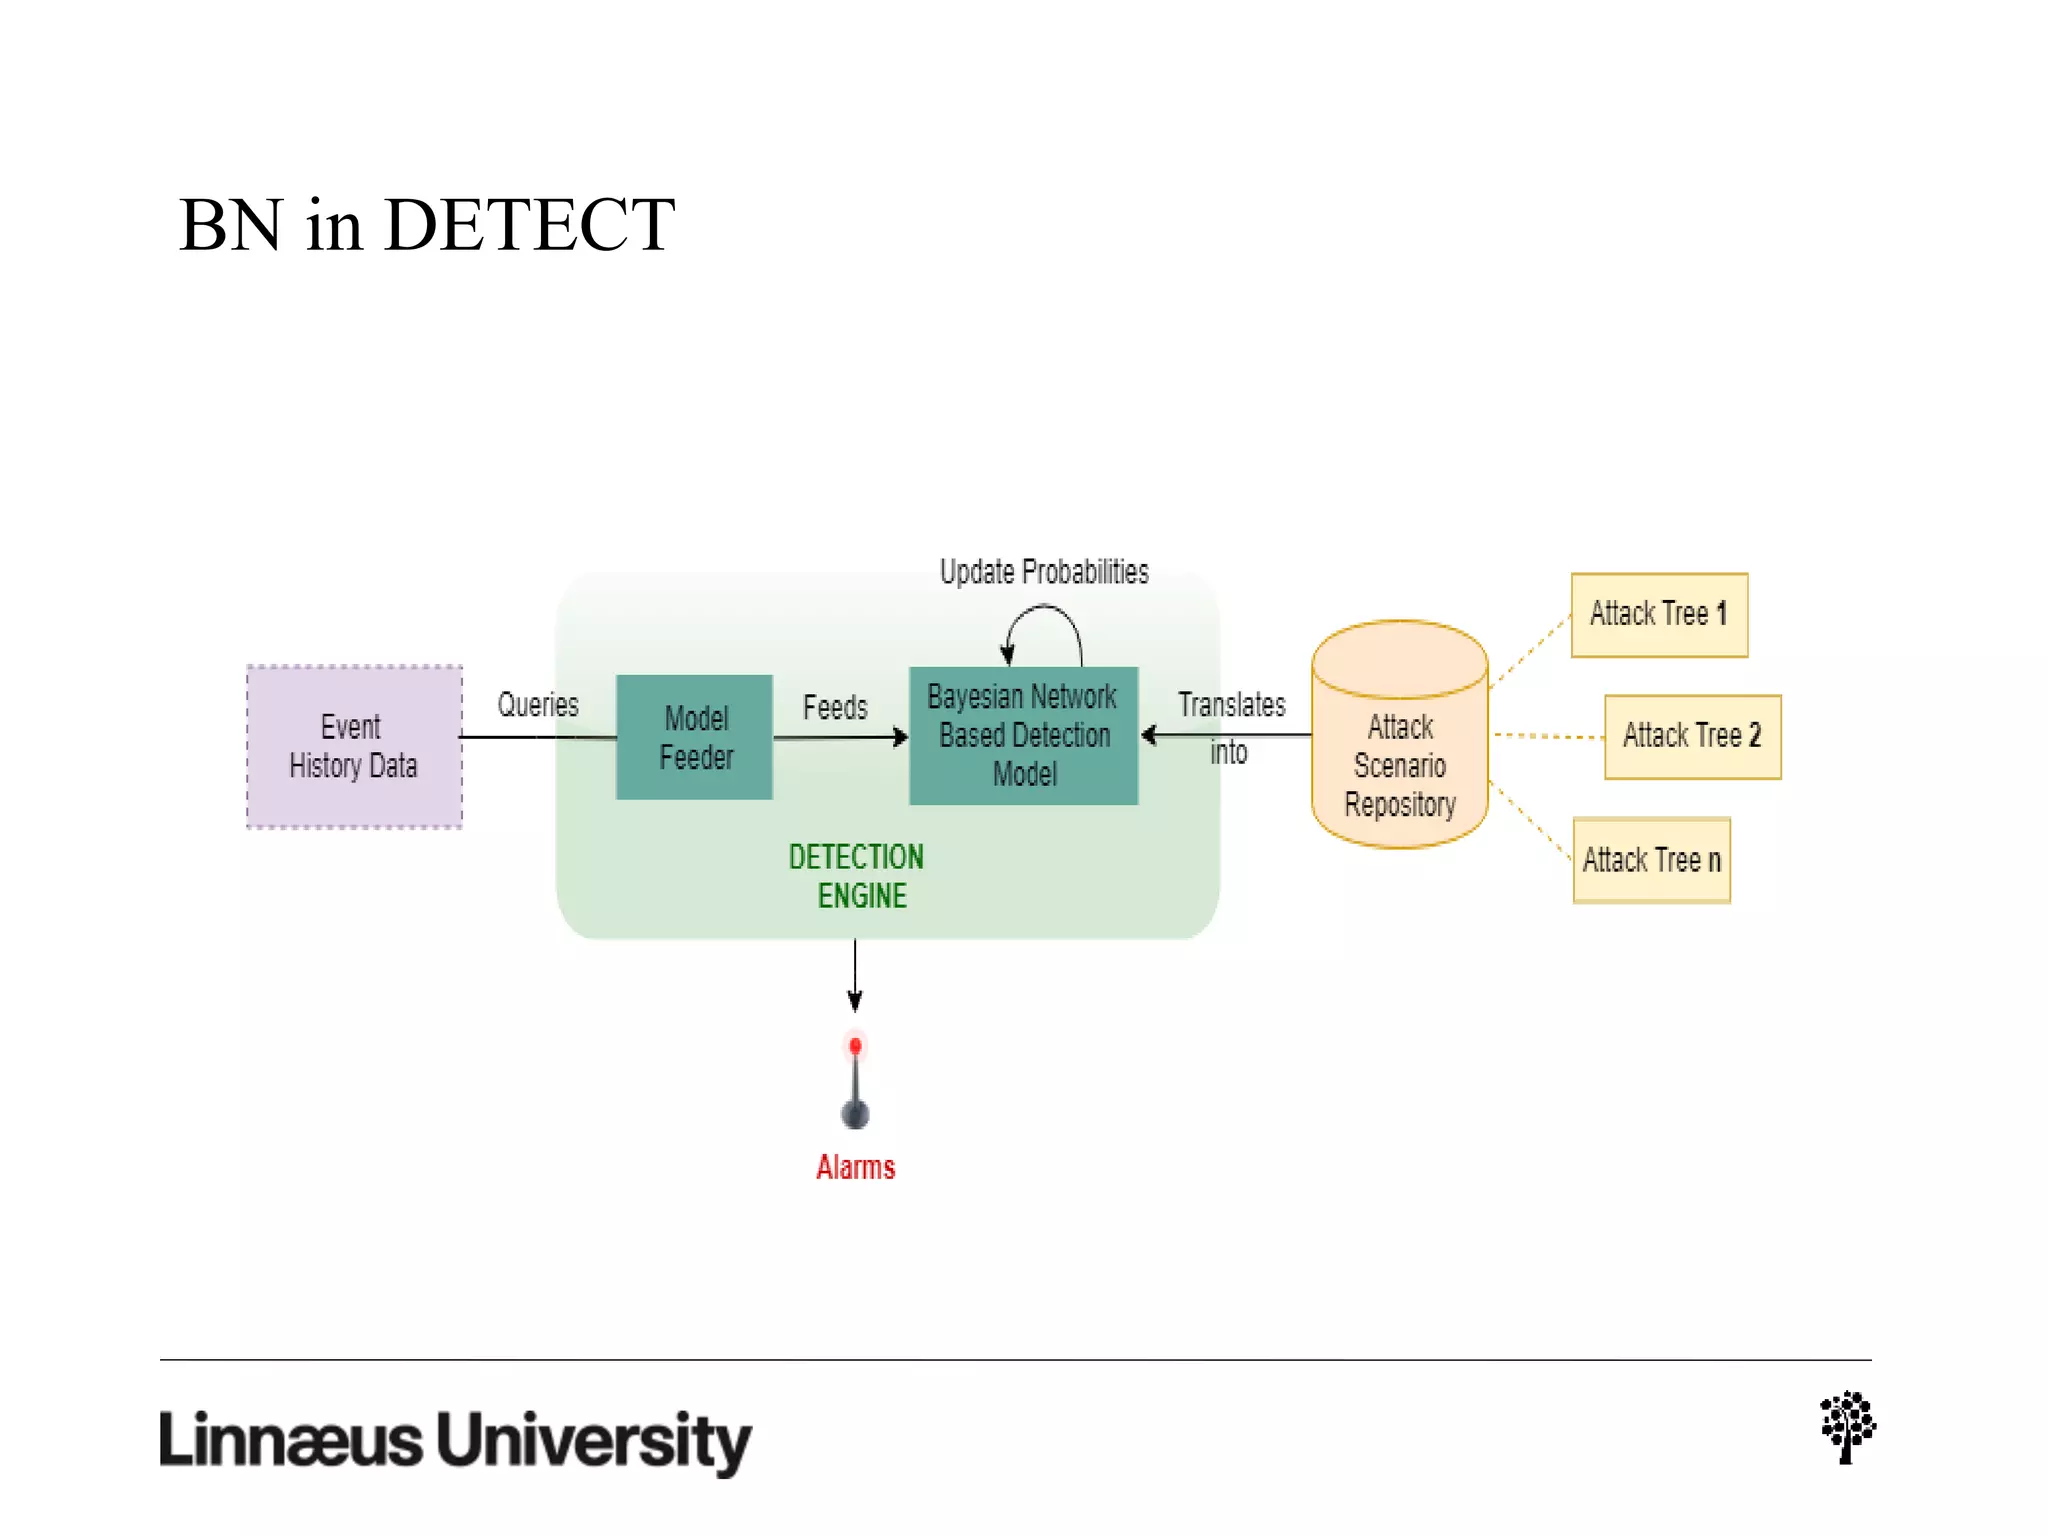
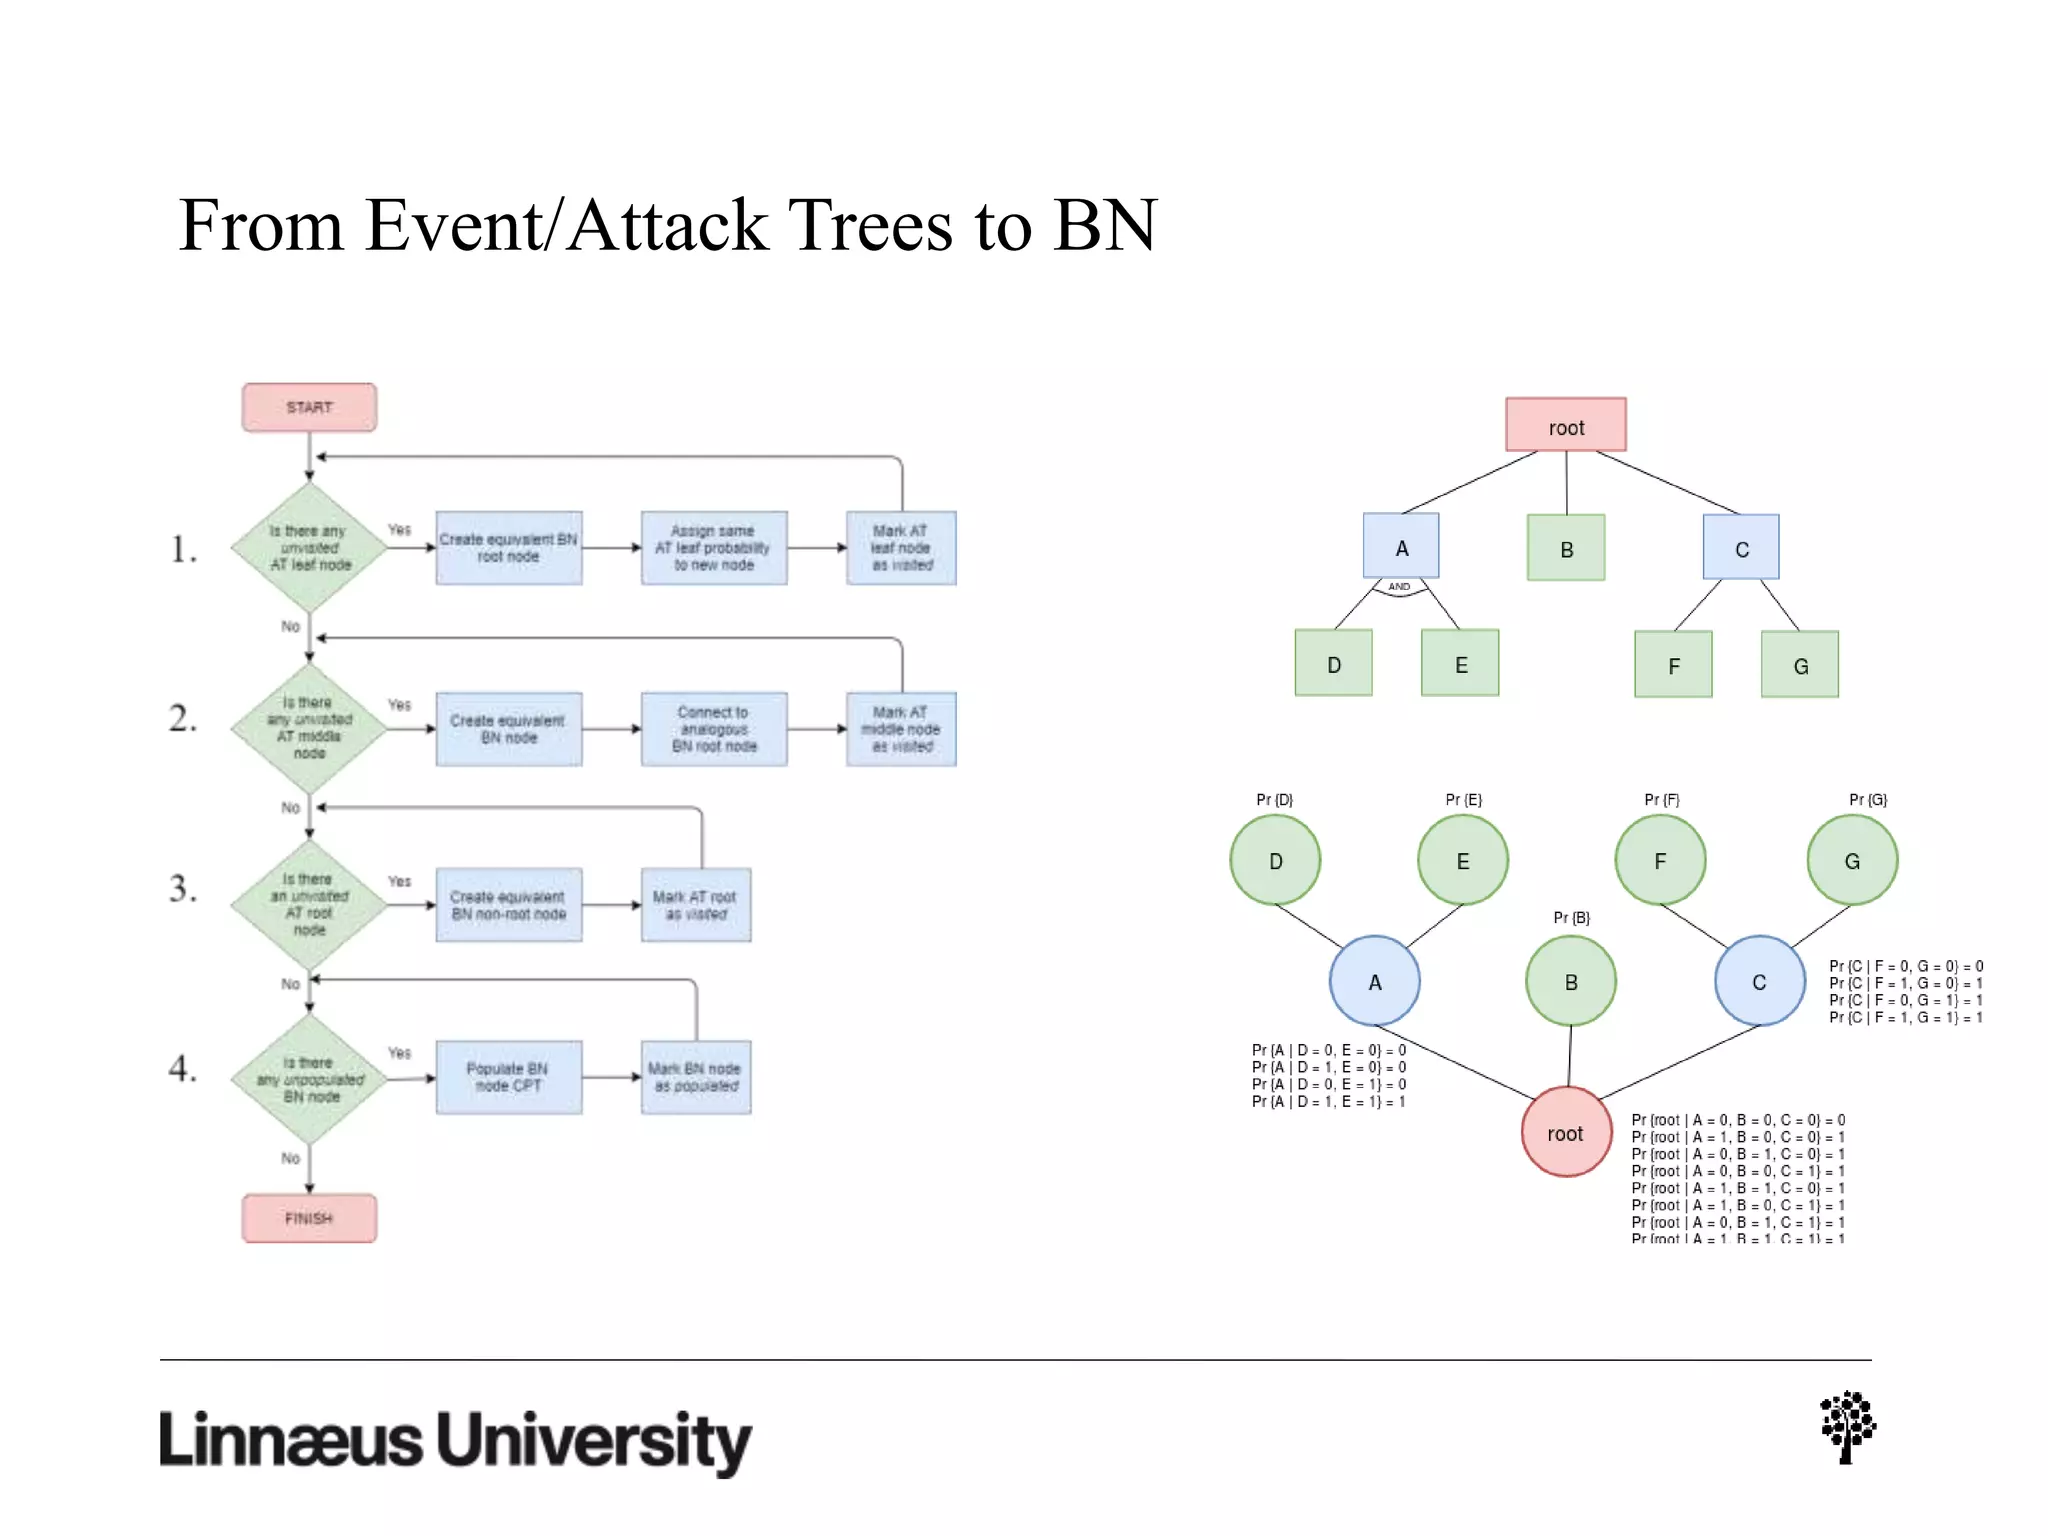
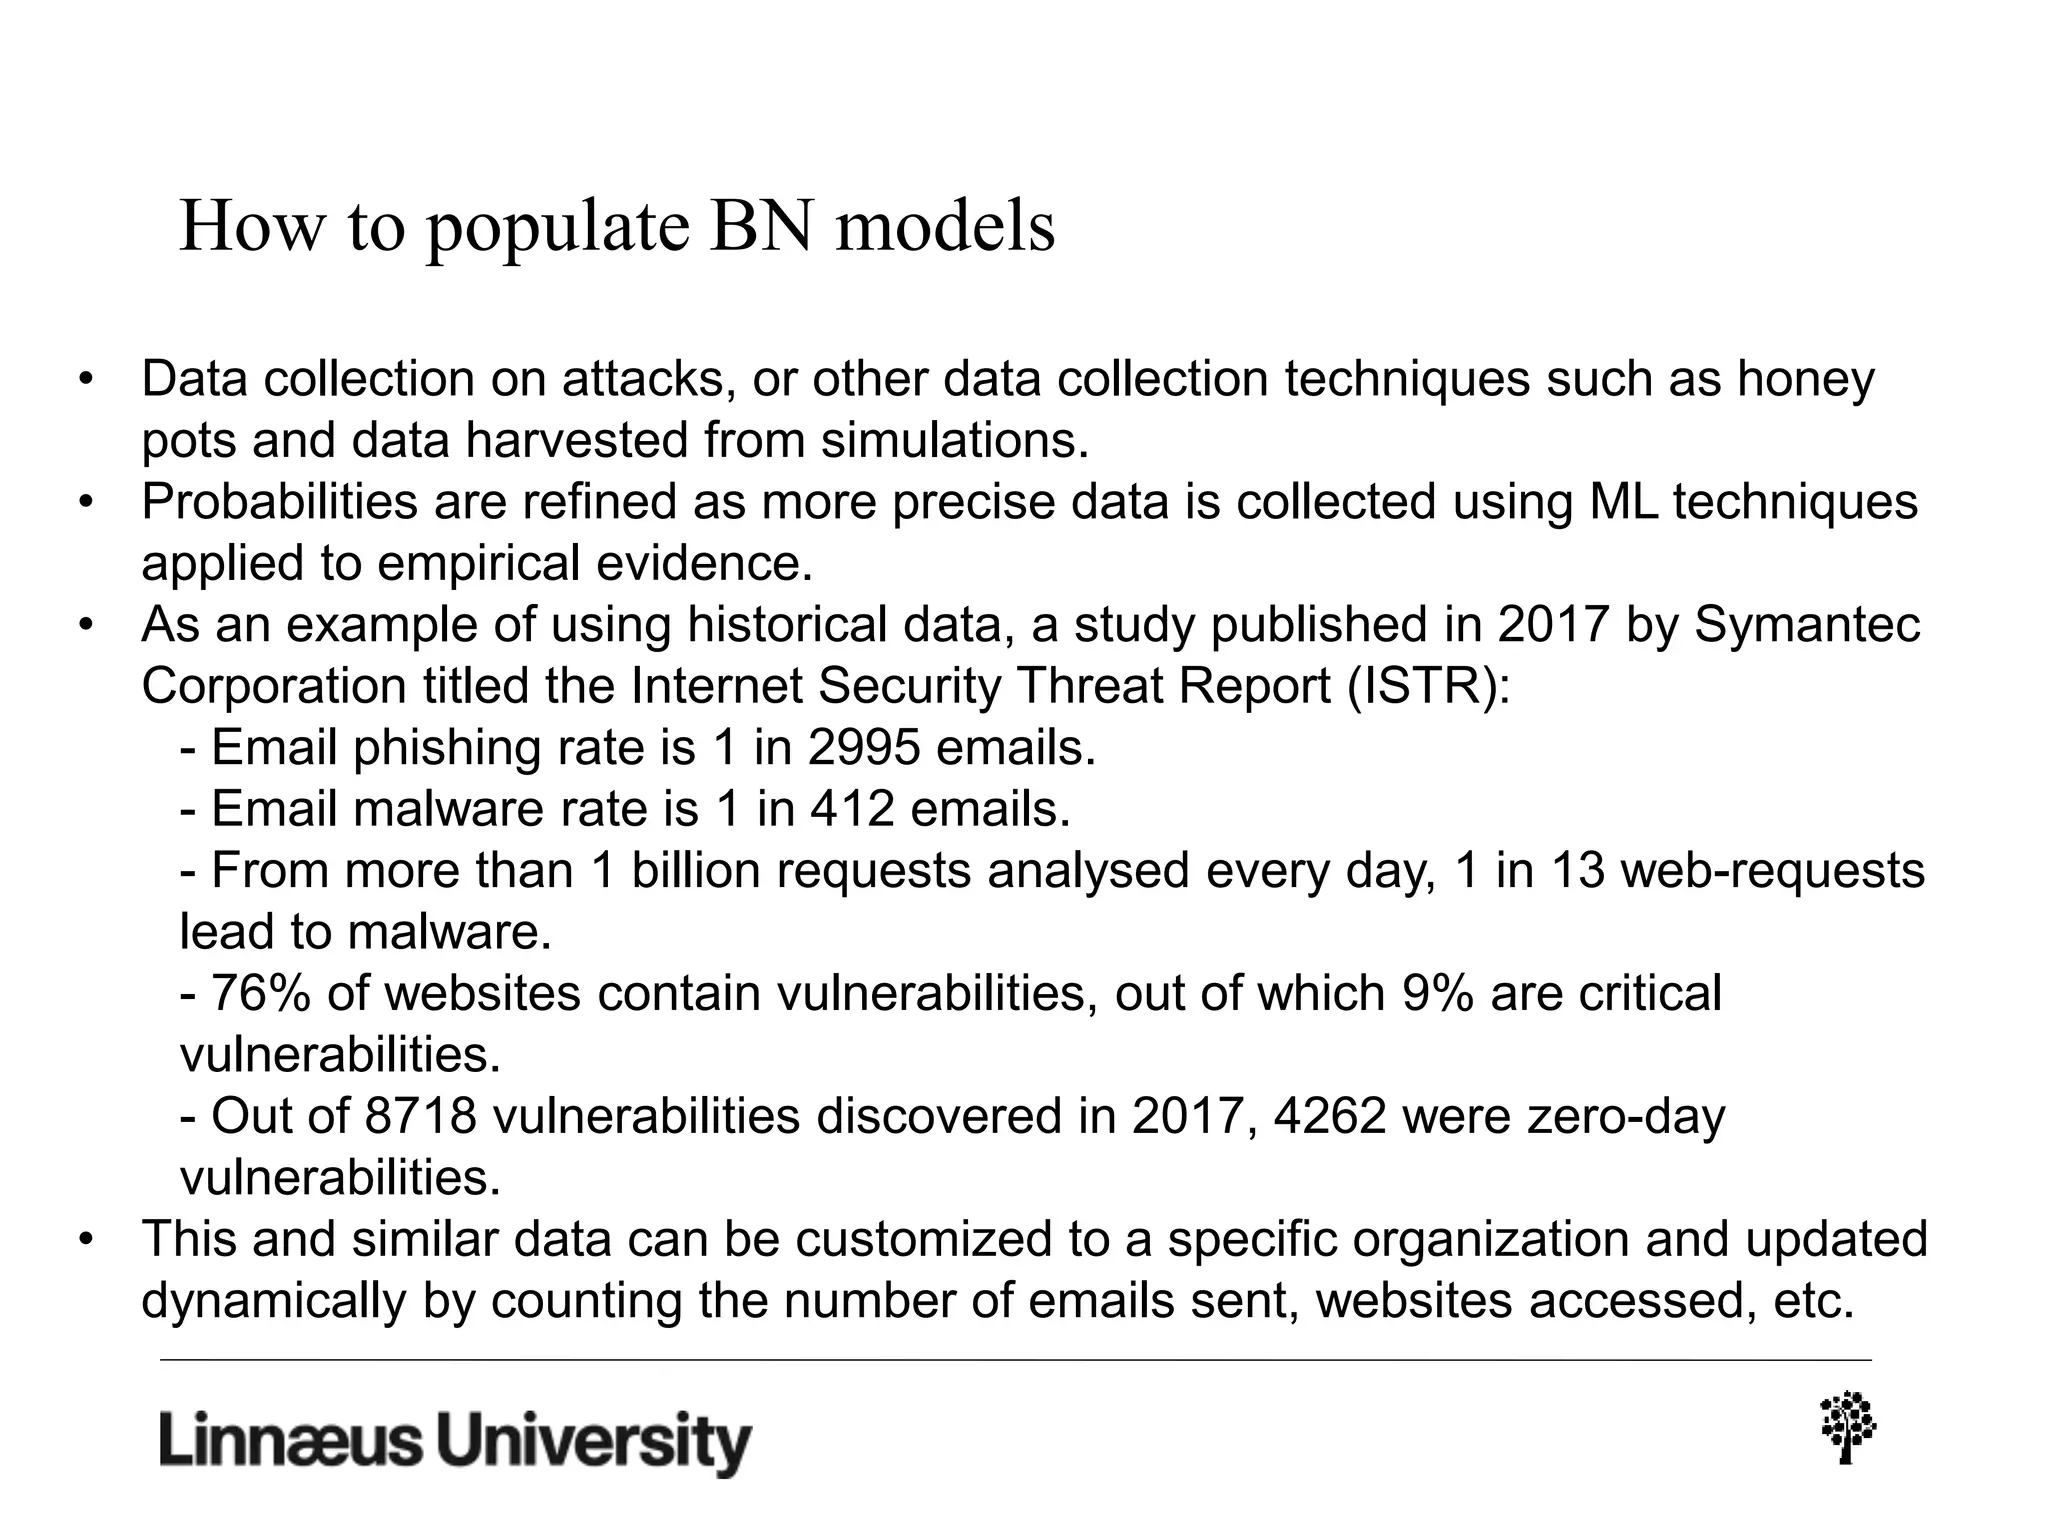
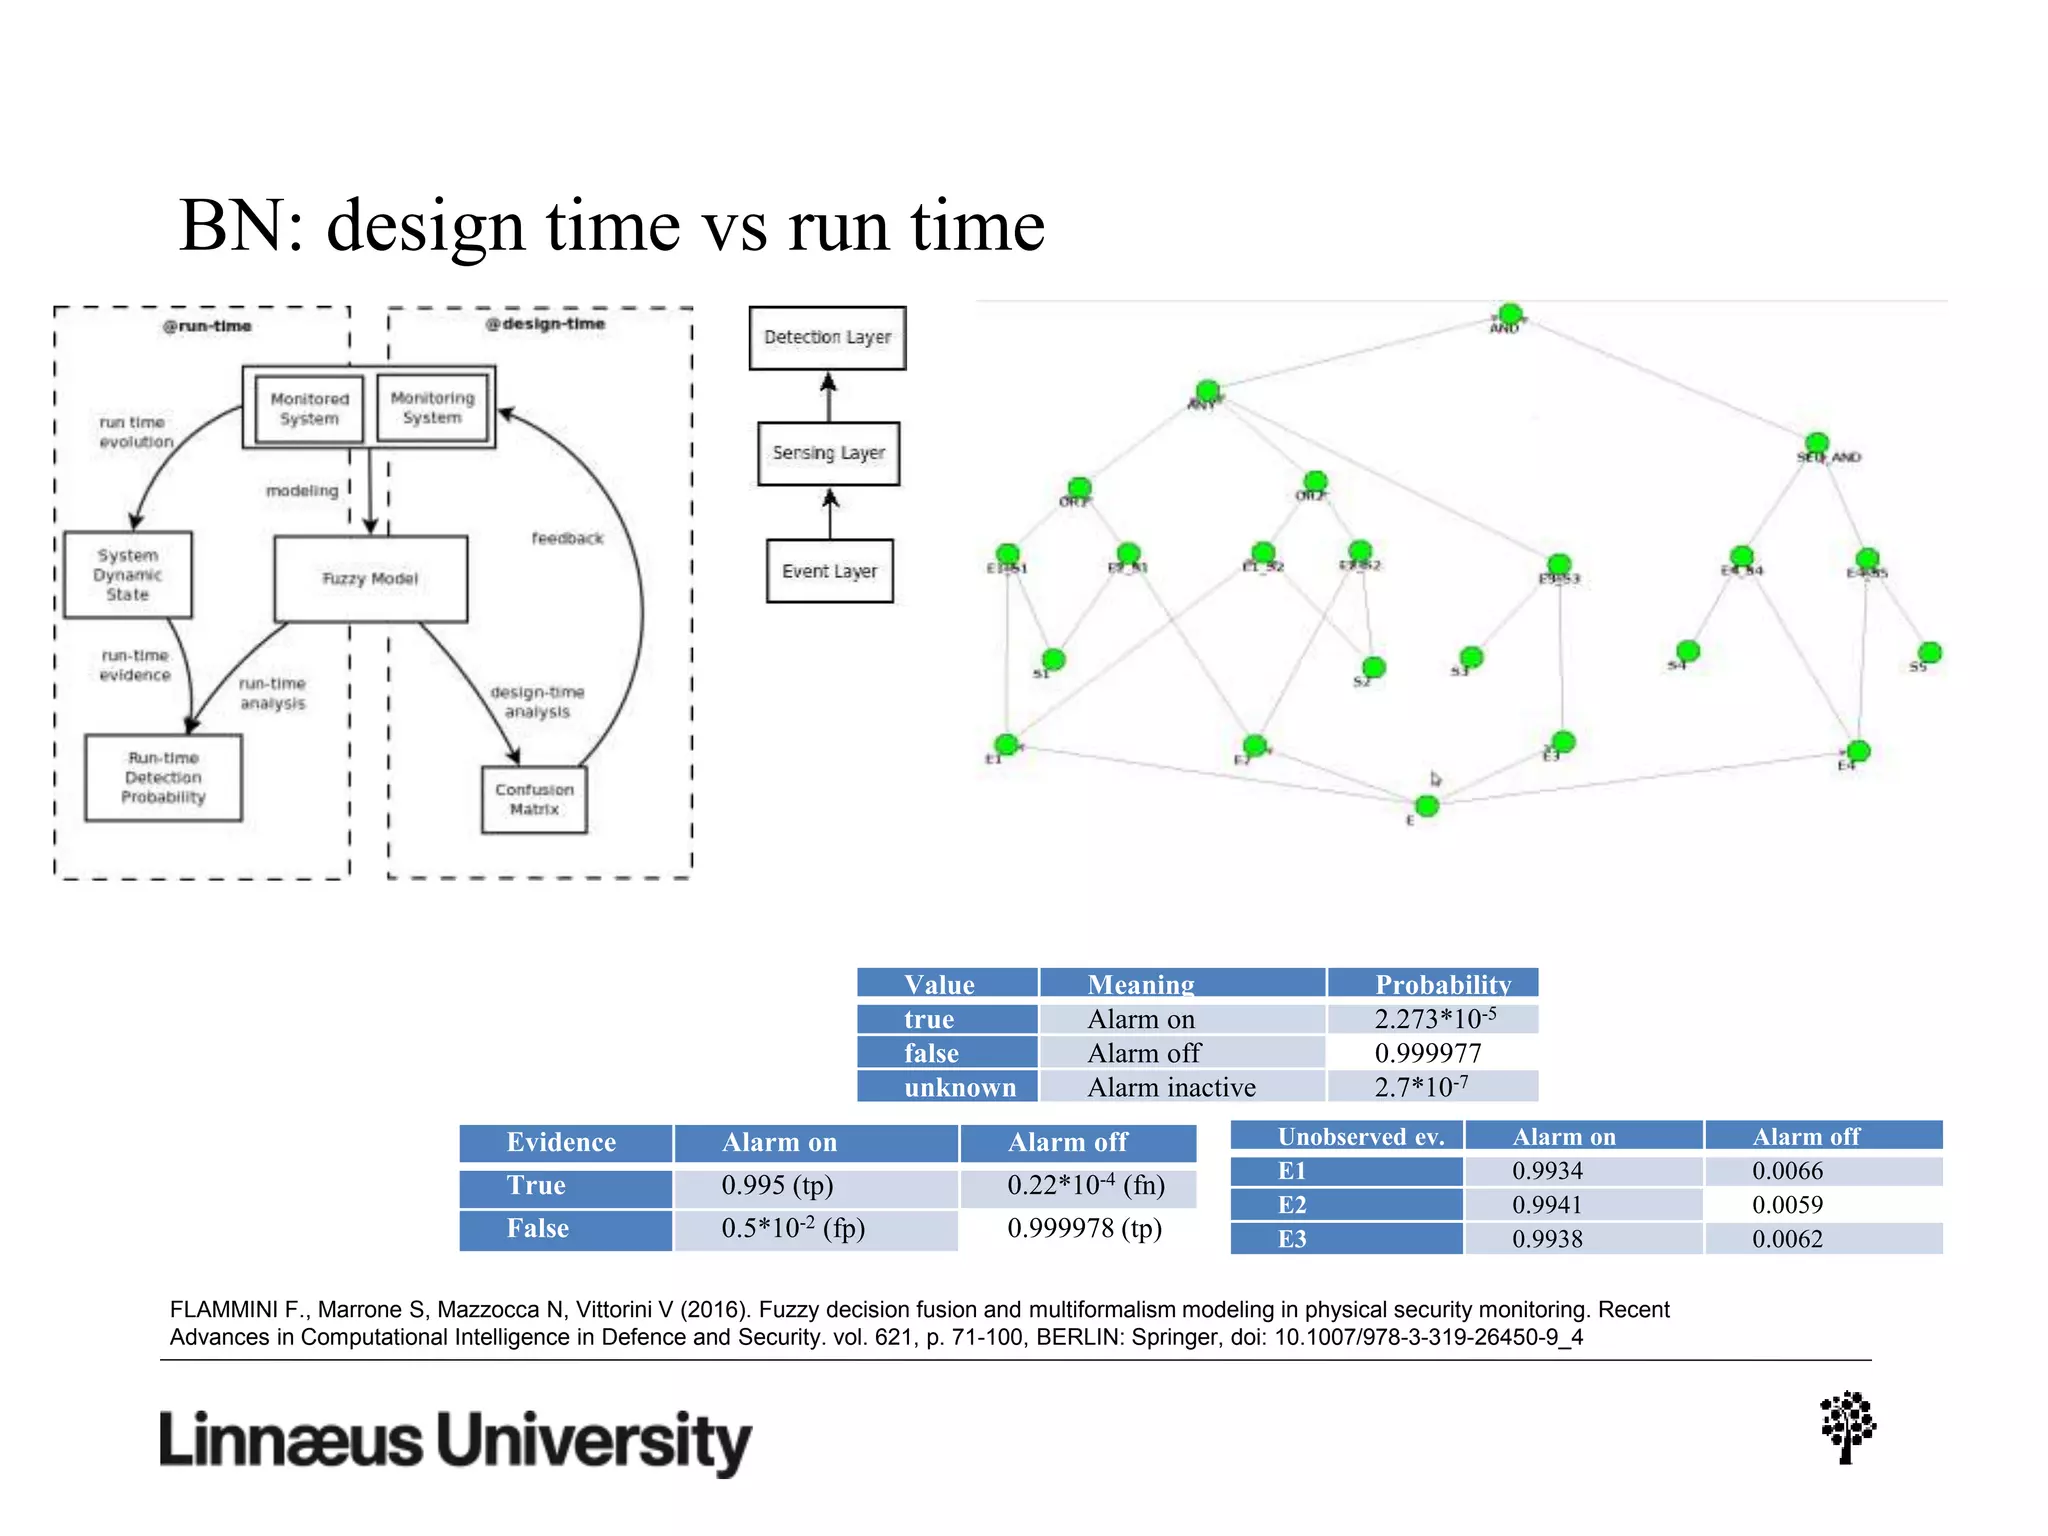
Artificial Intelligence Techniques
in Cyber-Security Applications
SUNET Days – SUSEC – Track 03 Security
April 1-4 2019, Växjö
Francesco Flammini
francesco.flammini@lnu.se
Modern Connected Society
The digital ecosystem is getting increasingly
ubiquitous and pervasive
Growing complexity due to size,
distribution, and heterogeneity
Growing criticality due to safety-related
functionalities (e-health, transport, etc.)
and evolving cyber-security threats
Security Operations Centers
Issues
• Too much information for few control room operators
• Operators overwhelmed by signals: events, states, diagnostics, alarms,
warnings, etc.
• Software separation between cyber-security and physical security
• SIEM – Security Information & Event Management
• PSIM – Physical Security Information Management)
• Many false alarms and nuisance alarms (> 30% => failure)
Information fusion
FLAMMINI F., Pappalardo A, Vittorini V (2013). Challenges and Emerging Paradigms for Augmented Surveillance. Effective Surveillance for Homeland Security: Balancing
Technology and Social Issues. p. 169-198, BOCA RATON, FL: Chapman & Hall/CRC Taylor & Francis Group, ISBN/ISSN: 9781439883242, doi: 10.1201/b14839-11
From smart-systems to autonomous systems
S1 ... Si A1 ... Aj
Data Fusion
Information
Fusion
Decision Fusion
Decision Makers
(reasoning)
Field Operations
Action Strategy
Workflow
Specification
Commands
Command &
Control
Smart-Sensing
Smart-Actuation
Sensors Actuators
AS1 ... ASk
Supervisors
Command &
Control
Autonomous Systems with
Embedded Intelligence
(smart cyber-physical systems)
AI hierarchy
Local Autonomous
Operations Control Center
- 1 -
Local Autonomous
Operations Control Center
- M -
AI-based Cognitive Engine AI-based Cognitive Engine
Sensors Actuators
Augmented
Humans
Vehicles Facilities Weapons
Sensors Actuators
Augmented
Humans
Vehicles Facilities Weapons
... ...
...
Regional Autonomous
Operations Control Center
- 1 -
Global Autonomous
Operations Control Center
- 1 -
AI-based Cognitive Engine
...
Regional Autonomous
Operations Control Center
- N -
AI-based Cognitive Engine
Informaton Flow
Events, States,
Alarms, Data
Commands
...
Interface
Adapter
Cyber-Physical Threat Detection
Flammini F, Marrone S, Rodríguez R J, Nardone R, Vittorini V (2015). On synergies of cyber and physical security modelling in vulnerability assessment of railway systems.
COMPUTERS & ELECTRICAL ENGINEERING, p. 275-285, ISSN: 0045-7906, doi: doi:10.1016/j.compeleceng.2015.07.011
Example scenario (1/2)
Example scenario (2/2)
Delli Priscoli F, Di Giorgio A, Esposito M, Fiaschetti A, Flammini F, Mignanti S, Pragliola C
(2017). Ensuring Cyber-Security in Smart Railway Surveillance with SHIELD. INTERNATIONAL
JOURNAL OF CRITICAL COMPUTER-BASED SYSTEMS, p. 138-170, ISSN: 1757-8779
DETECT
Decision Triggering Event Composer & Tracker
FLAMMINI F., Mazzocca N, Pappalardo A, Pragliola C, Vittorini V (2011). Augmenting surveillance system capabilities by exploiting event correlation and
distributed attack detection. In: Availability, Reliability and Security for Business, Enterprise and Health Information Systems. Vienna, Austria, 22-26 August
2011, BERLIN HEIDELBERG: Springer-Verlag, vol. 6908, p. 191-204, ISBN/ISSN: 978-364223299-2, doi: 10.1007/978-3-642-23300-5_15
The DETECT framework architecture
Event Trees
EDL based on the Snoop event algebra,
considering the following operators:
OR, AND, ANY, SEQ
Example Event Tree: (E1 AND E2) OR E3
Problem:
non determinism
First solution:
distance metrics
ABABBABABA DSODSLTWTWTDTDTNTND 
TN: total number of nodes
TD: tree depth, that is the number of levels from leaves to the top node
TW: tree width, that is the max number of operators at the same level
SL: set of leaf nodes SO: set of operator nodes
)()( BABAAB SLSLcardSLSLcardDSL 
)()( BABAAB SOSOcardSOSOcardDSO 
Flammini, F., Mazzocca, N., Pappalardo, A., Pragliola, C., Vittorini, V. Improving the dependability of distributed surveillance systems using diverse redundant detectors
(2015) Advances in Intelligent Systems and Computing, 307, pp. 35-53
Example (1/3)
Intelligent Camera (S1) :: Fall of person (E1)
Intelligent Camera (S1) :: Abnormal running (E2)
Intelligent Camera (S2) :: Fall of person (E1)
Intelligent Camera (S2) :: Abnormal running (E2)
Audio sensor (S3) :: Scream (E3)
IMS/SAW detector (S4) :: CWA detection (E4)
IR detector (S5) :: CWA detection (E4)
TN 12
TD 3
TW 2
SL E1-S1, E2-S1, E1-S2, E2-S2, E3-S3, E4-S4, E4-S5 cardinality=7
SO AND, ANY, SEQ, OR cardinality=4
TN 10
TD 3
TW 1
SL E1-S1, E2-S1, E1-S2, E2-S2, E3-S3, E4-S4, E4-S5 cardinality=7
SO SEQ, AND, ANY cardinality=3
D = |12−10| + |3−3| + |2−1| + 0 + 1 = 4
Scenario A Scenario B
Example (2/3)
TN 8
TD 2
TW 1
SL E1-S1, E2-S1, E1-S2, E2-S2, E3-S3, E5-S6 cardinality=6
SO SEQ, ANY cardinality=2
A-B A-C B-C
∆TN 2 4 2
∆SL 0 3 3
∆TD 0 1 1
∆SO 1 2 1
∆TW 1 1 0
D 4 11 7
Scenario C (aggression)
Off-line distance computation (all trees available)
TN 8
TD 2
SL E1-S1, E2-S1, E1-S2, E2-S2, E3-S3 cardinality=5
SO ANY, OR cardinality=2
On-line distance computation (only ANY subtree available)
ANY-A ANY-B ANY-C
∆TN 4 2 0
∆SL 2 2 1
∆TD 1 1 0
∆SO 2 3 1
D 9 8 2
Example (3/3)
Detector ID Detector Description Event ID Event Description FAR
S1
Intelligent Camera
E1 Fall of person 0.25
E2 Abnormal running 0.20
S2
Intelligent Camera
E1 Fall of person 0.25
E2 Abnormal running 0.20
S3 Audio Sensor E3 Scream 0.15
S4 IMS/SAW detector E4 CWA detection 0.30
S5 IR detector E4 CWA detection 0.27
Date Time Event ID Detector ID Occurrence Nr
01/04/2012 09:11:11 E4 S4 1
01/04/2012 09:14:18 E1 S2 2
01/04/2012 09:15:51 E3 S3 3
01/04/2012 09:16:00 E2 S2 4
01/04/2012 09:17:07 E4 S5 5
Bayesian Networks
A Bayesian Network (BN) (or “influence diagram”) is a
formalism suitable to model uncertainty. BNs are direct
acyclic graphs in which nodes represent stochastic
variables and arcs statistical dependencies between
variables, quantified by conditional probabilities
(Conditional Probability Tables, CPT)
Each node Xi is be associated with a probability distribution
given by all its parent nodes through the CPT.
This can be denoted as p(X | parents(x)). Following this
simplified explanation, an entire BN can then be
represented by a single joined probability distribution:
𝒑 𝑿 𝟏 … 𝑿 𝒏 =
𝟏
𝒏
𝒑 𝑿𝒊 𝒑𝒂𝒓𝒆𝒏𝒕𝒔 𝑿𝒊 )
Eugene Charniak (1991), Bayesian networks without tears: making Bayesian networks more accessible to the probabilistically unsophisticated, AI Magazine, v.12 n.4, pp.50-63
BN in DETECT
From Event/Attack Trees to BN
How to populate BN models
• Data collection on attacks, or other data collection techniques such as honey
pots and data harvested from simulations.
• Probabilities are refined as more precise data is collected using ML techniques
applied to empirical evidence.
• As an example of using historical data, a study published in 2017 by Symantec
Corporation titled the Internet Security Threat Report (ISTR):
- Email phishing rate is 1 in 2995 emails.
- Email malware rate is 1 in 412 emails.
- From more than 1 billion requests analysed every day, 1 in 13 web-requests
lead to malware.
- 76% of websites contain vulnerabilities, out of which 9% are critical
vulnerabilities.
- Out of 8718 vulnerabilities discovered in 2017, 4262 were zero-day
vulnerabilities.
• This and similar data can be customized to a specific organization and updated
dynamically by counting the number of emails sent, websites accessed, etc.
Example data
For instance, if you trust the above statement “Email phishing rate is 1 in 2995 emails”,
and in your organization you have 1200 emails sent at a certain time, then you can get
your custom value for the email phishing probability as:
In this formula (1-1/2995) would be the probability of not having phishing in a single
email, whereas the production refers to the probability of not having phishing in any of
the 1200 emails (assuming they are not correlated). One minus the production is then
the probability of having phishing after 1200 emails.
In other words, it is possible to update in real-time that probability by counting the
number of emails received in the organization at any time. The same holds for the other
parameters like website access. The SIEM system can be configured to monitor those
parameters and provide updates to DETECT and hence to the BN detection model.
1 −
1
1200
1 −
1
2995
Example model
Data for the example model
Leaf node Identifyin
g
Acronym
Estimated
probabilit
y
Possible Detection
Sensors
Exploitation
of Zero-Day
Vulnerability
ZDV 0.03
-Anomaly detection
based IDS
-User Level Endpoint
Monitoring
User Connects
to Untrusted
Network UN 0.24
-IDS
-SSL Certificate
missing/rejected
-Netflow Analysis
-Firewall
User Accesses
Malicious
Website MW 0.08
-IDS
-SSL Certificate
missing/rejected
-Unexpected flow of
data
User Connects
Infected
Removable
Media to the
System
IM 0.02
-IDS
-Antivirus
-System Event Logs
User Accesses
Website
Infected with
Malware
IW 0.09
-IDS
-Web Browser Plugin
User Opens
Spear
Phishing
Email
SPE 0.03
-Human
-User Level Endpoint
Monitoring
Middle Node Identifying
Acronym
Estimated
Probability
Exploitation of
unpatched
vulnerability
EUV 0.60
Attacker installs
backdoor on target
system
BD 0.85
Attacker gets
access to internal
system
AIC 0.90
Perturbation tests
Node IM IW SPE
Perturbance
Percentage
Value Results Value Results Value Results
-50% 1 19.6 4.5 18.6 1.5 19.5
-25% 1.5 19.8 6.75 19.2 2.25 19.7
-20% 1.6 19.8 7.2 19.4 2.4 19.7
-10% 1.8 19.8 8.1 19.6 2.7 19.8
0% 2 19.9 9 19.9 3 19.9
10% 2.2 19.9 9.9 20.2 3.3 20
20% 2.4 20 10.8 20.4 3.6 20.1
25% 2.5 20 11.25 20.6 3.75 20.1
50% 3 20.2 13.5 21.2 4.5 20.3
BN: design time vs run time
FLAMMINI F., Marrone S, Mazzocca N, Vittorini V (2016). Fuzzy decision fusion and multiformalism modeling in physical security monitoring. Recent
Advances in Computational Intelligence in Defence and Security. vol. 621, p. 71-100, BERLIN: Springer, doi: 10.1007/978-3-319-26450-9_4
Evidence Alarm on Alarm off
True 0.995 (tp) 0.22*10-4 (fn)
False 0.5*10-2 (fp) 0.999978 (tp)
Value Meaning Probability
true Alarm on 2.273*10-5
false Alarm off 0.999977
unknown Alarm inactive 2.7*10-7
Unobserved ev. Alarm on Alarm off
E1 0.9934 0.0066
E2 0.9941 0.0059
E3 0.9938 0.0062
Follow us on…
Thank you for your kind attention!

“AI techniques in cyber-security applications”. Flammini lnu susec19

  • 1.
    Artificial Intelligence Techniques inCyber-Security Applications SUNET Days – SUSEC – Track 03 Security April 1-4 2019, Växjö Francesco Flammini francesco.flammini@lnu.se
  • 2.
    Modern Connected Society Thedigital ecosystem is getting increasingly ubiquitous and pervasive Growing complexity due to size, distribution, and heterogeneity Growing criticality due to safety-related functionalities (e-health, transport, etc.) and evolving cyber-security threats
  • 3.
  • 4.
    Issues • Too muchinformation for few control room operators • Operators overwhelmed by signals: events, states, diagnostics, alarms, warnings, etc. • Software separation between cyber-security and physical security • SIEM – Security Information & Event Management • PSIM – Physical Security Information Management) • Many false alarms and nuisance alarms (> 30% => failure)
  • 5.
    Information fusion FLAMMINI F.,Pappalardo A, Vittorini V (2013). Challenges and Emerging Paradigms for Augmented Surveillance. Effective Surveillance for Homeland Security: Balancing Technology and Social Issues. p. 169-198, BOCA RATON, FL: Chapman & Hall/CRC Taylor & Francis Group, ISBN/ISSN: 9781439883242, doi: 10.1201/b14839-11
  • 6.
    From smart-systems toautonomous systems S1 ... Si A1 ... Aj Data Fusion Information Fusion Decision Fusion Decision Makers (reasoning) Field Operations Action Strategy Workflow Specification Commands Command & Control Smart-Sensing Smart-Actuation Sensors Actuators AS1 ... ASk Supervisors Command & Control Autonomous Systems with Embedded Intelligence (smart cyber-physical systems)
  • 7.
    AI hierarchy Local Autonomous OperationsControl Center - 1 - Local Autonomous Operations Control Center - M - AI-based Cognitive Engine AI-based Cognitive Engine Sensors Actuators Augmented Humans Vehicles Facilities Weapons Sensors Actuators Augmented Humans Vehicles Facilities Weapons ... ... ... Regional Autonomous Operations Control Center - 1 - Global Autonomous Operations Control Center - 1 - AI-based Cognitive Engine AI-based Cognitive Engine ... Regional Autonomous Operations Control Center - N - AI-based Cognitive Engine Informaton Flow Events, States, Alarms, Data Commands ... Interface Adapter
  • 8.
    Cyber-Physical Threat Detection FlamminiF, Marrone S, Rodríguez R J, Nardone R, Vittorini V (2015). On synergies of cyber and physical security modelling in vulnerability assessment of railway systems. COMPUTERS & ELECTRICAL ENGINEERING, p. 275-285, ISSN: 0045-7906, doi: doi:10.1016/j.compeleceng.2015.07.011
  • 9.
  • 10.
    Example scenario (2/2) DelliPriscoli F, Di Giorgio A, Esposito M, Fiaschetti A, Flammini F, Mignanti S, Pragliola C (2017). Ensuring Cyber-Security in Smart Railway Surveillance with SHIELD. INTERNATIONAL JOURNAL OF CRITICAL COMPUTER-BASED SYSTEMS, p. 138-170, ISSN: 1757-8779
  • 11.
    DETECT Decision Triggering EventComposer & Tracker FLAMMINI F., Mazzocca N, Pappalardo A, Pragliola C, Vittorini V (2011). Augmenting surveillance system capabilities by exploiting event correlation and distributed attack detection. In: Availability, Reliability and Security for Business, Enterprise and Health Information Systems. Vienna, Austria, 22-26 August 2011, BERLIN HEIDELBERG: Springer-Verlag, vol. 6908, p. 191-204, ISBN/ISSN: 978-364223299-2, doi: 10.1007/978-3-642-23300-5_15
  • 12.
  • 13.
    Event Trees EDL basedon the Snoop event algebra, considering the following operators: OR, AND, ANY, SEQ Example Event Tree: (E1 AND E2) OR E3
  • 14.
    Problem: non determinism First solution: distancemetrics ABABBABABA DSODSLTWTWTDTDTNTND  TN: total number of nodes TD: tree depth, that is the number of levels from leaves to the top node TW: tree width, that is the max number of operators at the same level SL: set of leaf nodes SO: set of operator nodes )()( BABAAB SLSLcardSLSLcardDSL  )()( BABAAB SOSOcardSOSOcardDSO  Flammini, F., Mazzocca, N., Pappalardo, A., Pragliola, C., Vittorini, V. Improving the dependability of distributed surveillance systems using diverse redundant detectors (2015) Advances in Intelligent Systems and Computing, 307, pp. 35-53
  • 15.
    Example (1/3) Intelligent Camera(S1) :: Fall of person (E1) Intelligent Camera (S1) :: Abnormal running (E2) Intelligent Camera (S2) :: Fall of person (E1) Intelligent Camera (S2) :: Abnormal running (E2) Audio sensor (S3) :: Scream (E3) IMS/SAW detector (S4) :: CWA detection (E4) IR detector (S5) :: CWA detection (E4) TN 12 TD 3 TW 2 SL E1-S1, E2-S1, E1-S2, E2-S2, E3-S3, E4-S4, E4-S5 cardinality=7 SO AND, ANY, SEQ, OR cardinality=4 TN 10 TD 3 TW 1 SL E1-S1, E2-S1, E1-S2, E2-S2, E3-S3, E4-S4, E4-S5 cardinality=7 SO SEQ, AND, ANY cardinality=3 D = |12−10| + |3−3| + |2−1| + 0 + 1 = 4 Scenario A Scenario B
  • 16.
    Example (2/3) TN 8 TD2 TW 1 SL E1-S1, E2-S1, E1-S2, E2-S2, E3-S3, E5-S6 cardinality=6 SO SEQ, ANY cardinality=2 A-B A-C B-C ∆TN 2 4 2 ∆SL 0 3 3 ∆TD 0 1 1 ∆SO 1 2 1 ∆TW 1 1 0 D 4 11 7 Scenario C (aggression) Off-line distance computation (all trees available) TN 8 TD 2 SL E1-S1, E2-S1, E1-S2, E2-S2, E3-S3 cardinality=5 SO ANY, OR cardinality=2 On-line distance computation (only ANY subtree available) ANY-A ANY-B ANY-C ∆TN 4 2 0 ∆SL 2 2 1 ∆TD 1 1 0 ∆SO 2 3 1 D 9 8 2
  • 17.
    Example (3/3) Detector IDDetector Description Event ID Event Description FAR S1 Intelligent Camera E1 Fall of person 0.25 E2 Abnormal running 0.20 S2 Intelligent Camera E1 Fall of person 0.25 E2 Abnormal running 0.20 S3 Audio Sensor E3 Scream 0.15 S4 IMS/SAW detector E4 CWA detection 0.30 S5 IR detector E4 CWA detection 0.27 Date Time Event ID Detector ID Occurrence Nr 01/04/2012 09:11:11 E4 S4 1 01/04/2012 09:14:18 E1 S2 2 01/04/2012 09:15:51 E3 S3 3 01/04/2012 09:16:00 E2 S2 4 01/04/2012 09:17:07 E4 S5 5
  • 18.
    Bayesian Networks A BayesianNetwork (BN) (or “influence diagram”) is a formalism suitable to model uncertainty. BNs are direct acyclic graphs in which nodes represent stochastic variables and arcs statistical dependencies between variables, quantified by conditional probabilities (Conditional Probability Tables, CPT) Each node Xi is be associated with a probability distribution given by all its parent nodes through the CPT. This can be denoted as p(X | parents(x)). Following this simplified explanation, an entire BN can then be represented by a single joined probability distribution: 𝒑 𝑿 𝟏 … 𝑿 𝒏 = 𝟏 𝒏 𝒑 𝑿𝒊 𝒑𝒂𝒓𝒆𝒏𝒕𝒔 𝑿𝒊 ) Eugene Charniak (1991), Bayesian networks without tears: making Bayesian networks more accessible to the probabilistically unsophisticated, AI Magazine, v.12 n.4, pp.50-63
  • 19.
  • 20.
  • 21.
    How to populateBN models • Data collection on attacks, or other data collection techniques such as honey pots and data harvested from simulations. • Probabilities are refined as more precise data is collected using ML techniques applied to empirical evidence. • As an example of using historical data, a study published in 2017 by Symantec Corporation titled the Internet Security Threat Report (ISTR): - Email phishing rate is 1 in 2995 emails. - Email malware rate is 1 in 412 emails. - From more than 1 billion requests analysed every day, 1 in 13 web-requests lead to malware. - 76% of websites contain vulnerabilities, out of which 9% are critical vulnerabilities. - Out of 8718 vulnerabilities discovered in 2017, 4262 were zero-day vulnerabilities. • This and similar data can be customized to a specific organization and updated dynamically by counting the number of emails sent, websites accessed, etc.
  • 22.
    Example data For instance,if you trust the above statement “Email phishing rate is 1 in 2995 emails”, and in your organization you have 1200 emails sent at a certain time, then you can get your custom value for the email phishing probability as: In this formula (1-1/2995) would be the probability of not having phishing in a single email, whereas the production refers to the probability of not having phishing in any of the 1200 emails (assuming they are not correlated). One minus the production is then the probability of having phishing after 1200 emails. In other words, it is possible to update in real-time that probability by counting the number of emails received in the organization at any time. The same holds for the other parameters like website access. The SIEM system can be configured to monitor those parameters and provide updates to DETECT and hence to the BN detection model. 1 − 1 1200 1 − 1 2995
  • 23.
  • 24.
    Data for theexample model Leaf node Identifyin g Acronym Estimated probabilit y Possible Detection Sensors Exploitation of Zero-Day Vulnerability ZDV 0.03 -Anomaly detection based IDS -User Level Endpoint Monitoring User Connects to Untrusted Network UN 0.24 -IDS -SSL Certificate missing/rejected -Netflow Analysis -Firewall User Accesses Malicious Website MW 0.08 -IDS -SSL Certificate missing/rejected -Unexpected flow of data User Connects Infected Removable Media to the System IM 0.02 -IDS -Antivirus -System Event Logs User Accesses Website Infected with Malware IW 0.09 -IDS -Web Browser Plugin User Opens Spear Phishing Email SPE 0.03 -Human -User Level Endpoint Monitoring Middle Node Identifying Acronym Estimated Probability Exploitation of unpatched vulnerability EUV 0.60 Attacker installs backdoor on target system BD 0.85 Attacker gets access to internal system AIC 0.90
  • 25.
    Perturbation tests Node IMIW SPE Perturbance Percentage Value Results Value Results Value Results -50% 1 19.6 4.5 18.6 1.5 19.5 -25% 1.5 19.8 6.75 19.2 2.25 19.7 -20% 1.6 19.8 7.2 19.4 2.4 19.7 -10% 1.8 19.8 8.1 19.6 2.7 19.8 0% 2 19.9 9 19.9 3 19.9 10% 2.2 19.9 9.9 20.2 3.3 20 20% 2.4 20 10.8 20.4 3.6 20.1 25% 2.5 20 11.25 20.6 3.75 20.1 50% 3 20.2 13.5 21.2 4.5 20.3
  • 26.
    BN: design timevs run time FLAMMINI F., Marrone S, Mazzocca N, Vittorini V (2016). Fuzzy decision fusion and multiformalism modeling in physical security monitoring. Recent Advances in Computational Intelligence in Defence and Security. vol. 621, p. 71-100, BERLIN: Springer, doi: 10.1007/978-3-319-26450-9_4 Evidence Alarm on Alarm off True 0.995 (tp) 0.22*10-4 (fn) False 0.5*10-2 (fp) 0.999978 (tp) Value Meaning Probability true Alarm on 2.273*10-5 false Alarm off 0.999977 unknown Alarm inactive 2.7*10-7 Unobserved ev. Alarm on Alarm off E1 0.9934 0.0066 E2 0.9941 0.0059 E3 0.9938 0.0062
  • 27.
  • 28.
    Thank you foryour kind attention!