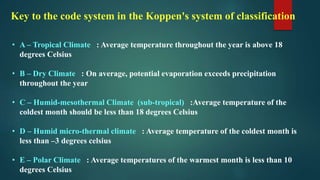
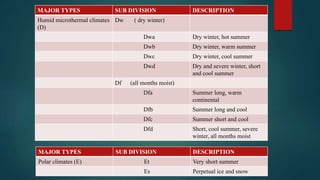
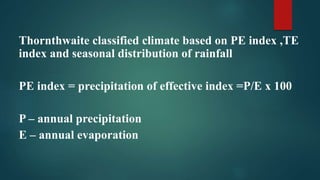
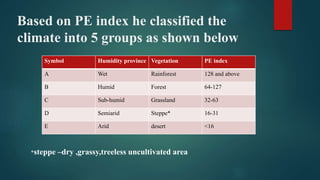
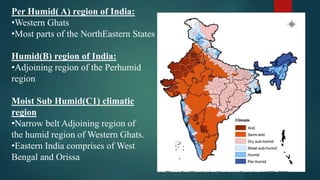
This document discusses various climatological classification systems, focusing on Koppen's and Thornthwaite's classifications. Koppen's system classifies climates into 5 main groups (A through E) based on temperature and precipitation averages. Thornthwaite's system uses potential evapotranspiration and temperature effective indices to classify climates into humidity and temperature provinces. The document also briefly outlines Troll's classification system which differentiates tropical climates based on the number of humid months.


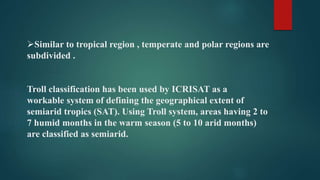


![Koppen classification and land area characteristics [autosaved]](https://cdn.slidesharecdn.com/ss_thumbnails/koppenclassificationandlandareacharacteristicsautosaved-210129205232-thumbnail.jpg?width=640&height=640&fit=bounds)
![Koppen classification and land area characteristics [autosaved]](https://cdn.slidesharecdn.com/ss_thumbnails/koppenclassificationandlandareacharacteristicsautosaved-200217040035-thumbnail.jpg?width=640&height=640&fit=bounds)


