Utilization of active canopy sensors for nitrogen fertilizer mana
1. Graduate Theses and Dissertations Graduate College
2011
Utilization of active canopy sensors for nitrogen
fertilizer management in corn
Daniel W. Barker
Iowa State University
Follow this and additional works at: http://lib.dr.iastate.edu/etd
Part of the Agronomy and Crop Sciences Commons
This Dissertation is brought to you for free and open access by the Graduate College at Digital Repository @ Iowa State University. It has been accepted
for inclusion in Graduate Theses and Dissertations by an authorized administrator of Digital Repository @ Iowa State University. For more
information, please contact digirep@iastate.edu.
Recommended Citation
Barker, Daniel W., "Utilization of active canopy sensors for nitrogen fertilizer management in corn" (2011). Graduate Theses and
Dissertations. Paper 10057.
3. ii
TABLE OF CONTENTS
LIST OF FIGURES ................................................................................................................. iv
LIST OF TABLES................................................................................................................... vi
CHAPTER 1. GENERAL INTRODUCTION ..........................................................................1
DISSERTATION ORGANIZATION................................................................................4
CHAPTER 2. FACTORS AFFECTING ACTIVE CANOPY SENSOR
PERFORMANCE AND REFLECTANCE MEASUREMENTS......................................5
ABSTRACT .......................................................................................................................5
INTRODUCTION..............................................................................................................7
MATERIALS AND METHODS .......................................................................................9
Active Canopy Sensor Equipment.................................................................................9
Lighting Source Study .................................................................................................11
Lighting Penetration Study ..........................................................................................11
Multiple Sensor Study..................................................................................................12
Statistics.......................................................................................................................13
RESULTS AND DISCUSSION.......................................................................................13
Effects of Lighting Source...........................................................................................13
Canopy Light Penetration ............................................................................................15
Single vs. Multiple Sensor Values...............................................................................17
CONCLUSIONS ..............................................................................................................19
REFERENCES .................................................................................................................20
CHAPTER 3. USING ACTIVE CANOPY SENSORS TO QUANTIFY CORN
NITROGEN STRESS AND NITROGEN APPLICATION RATE.................................35
ABSTRACT .....................................................................................................................35
INTRODUCTION............................................................................................................37
MATERIALS AND METHODS .....................................................................................41
Study Design................................................................................................................41
Sensor Measurements and Weather Data ....................................................................42
Calculations and Statistics ...........................................................................................44
RESULTS AND DISCUSSION.......................................................................................45
Description of Sensing and Canopy Conditions..........................................................45
Sensor Indices Relationship to Nitrogen Rate .............................................................47
Prescribed N Rate Variability of N Rate Algorithms ..................................................49
CONCLUSIONS ..............................................................................................................51
REFERENCES .................................................................................................................52
4. iii
CHAPTER 4. USING ACTIVE CANOPY SENSING TO ADJUST NITROGEN
APPLICATION RATE IN CORN...................................................................................64
ABSTRACT .....................................................................................................................64
INTRODUCTION............................................................................................................66
MATERIALS AND METHODS .....................................................................................68
RESULTS.........................................................................................................................71
Rainfall and Corn Response to Sensor-Based Applied Nitrogen ................................71
2009..............................................................................................................................72
2010..............................................................................................................................75
DISCUSSION...................................................................................................................77
CONCLUSIONS ..............................................................................................................80
REFERENCES .................................................................................................................81
CHAPTER 5. GENERAL CONCLUSIONS...........................................................................98
ACKNOWLEDGEMENTS...................................................................................................102
VITA OF AUTHOR ..............................................................................................................103
APPENDIX. ADDITIONAL DATA TABLE FROM CHAPTER 4 ....................................107
5. iv
LIST OF FIGURES
CHAPTER 2. FACTORS AFFECTING ACTIVE CANOPY SENSOR
PERFORMANCE AND REFLECTANCE MEASUREMENTS
Figure 1. Box and whisker plot of near-infrared (NIR) and visible (VIS)
measurements from three Crop Circle ACS-210 (CC-210) active canopy sensor
units when the modulated light source is blocked from the photo detectors. Lower
and upper limits of each box indicates the 25th
and 75th
percentile; horizontal solid
line in the box indicates the median; horizontal dashed line in the box indicates
the mean; the lower and upper limits of the whiskers indicate the 10th
and 90th
percentile; dots indicate the minimum and maximum reflectance observations.........28
CHAPTER 3. USING ACTIVE CANOPY SENSORS TO QUANTIFY CORN
NITROGEN STRESS AND NITROGEN APPLICATION RATE
Figure 1. Relative canopy index values as related to the differential from the
economic optimum N rate (dEONR) from relative SPAD (rSPAD) from the
SPAD chlorophyll meter (SPAD-502); relative green difference vegetative index
(rGDVI), relative modified simple ratio index (rMSRI), relative simple ratio index
(rSRI) from the GreenSeeker Green 506 active canopy sensor (GS-506); and
rGDVI, rMSRI, rSRI, and relative green normalized difference vegetative index
(rGNDVI) from the Crop Circle ACS-210 active canopy sensor (CC-210).
Canopy indices and quadratic-plateau (QP) regression models were chosen from
the highest goodness of fit statistic (adjR2
) in Table 3. The LCL and UCL
represent the 95% lower and upper confidence limits, respectively, of the QP
regression models.........................................................................................................62
Figure 2. Sensor prescribed N rate variability across the range of differential
economic optimum N rates (dEONR) less than zero for relative indices from the
SPAD chlorophyll meter (SPAD-502), GreenSeeker Green 506 active canopy
sensor (GS-506), and Crop Circle ACS-210 active canopy sensor (CC-210):
relative SPAD (rSPAD), relative simple ratio index (rSRI), relative modified
simple ratio index (rMSRI), relative green difference vegetative index (rGDVI),
relative green normalized difference vegetative index (rGNDVI) ..............................63
CHAPTER 4. ACTIVE CANOPY SENSING TO ADJUST NITROGEN
APPLICATION RATE IN CORN
Figure 1. Precipitation as rainfall recorded at the Iowa State University Research and
Demonstration Sorenson Farm in June and July, 2009 and 2010 (Arritt and
Herzmann, 2010). Arrows and dates indicate the time of canopy sensing and in-
season N application at the V10 growth stage.............................................................88
6. v
Figure 2. Relative green normalized difference vegetative index (rGNDVI) from the
0 kg N ha-1
rate for the pre-plant applied N (PP-N) and pre-plant + sensor applied
N (PP+S-N) in 2009 and 2010. Sensor readings were collected at the V7, V10,
and V13 corn growth stages. In-season fertilizer N was sensor applied at the V10
stage in the PP+S-N. Average application rates to the PP+S-N 0 kg N ha-1
were
87 and 209 kg N ha-1
in 2009 and 2010, respectively..................................................89
Figure 3. Corn grain yield comparisons between pre-plant applied N (PP-N) and pre-
plant + sensor applied N (PP+S-N) in 2009. The Fisher’s least significant
difference (FLSD) was used to compare grain yield differences between PP-N and
PP+S-N strategies. Grain yield means at each pre-plant applied N rate with
different letters are statistically different at the P < 0.05 level....................................94
Figure 4. Relationship between total applied N and corn grain yield for pre-plant
applied N (PP-N) and pre-plant + sensor applied N (PP+S-N) in 2009. The
quadratic plateau (QP) regression model parameters were used to calculate
economic optimum N rate (EONR) and nitrogen use efficiency (NUE) for each N
strategy given in Table 3..............................................................................................95
Figure 5. Corn grain yield comparisons between pre-plant applied N (PP-N) and pre-
plant + sensor applied N (PP+S-N) in 2010. The Fisher’s least significant
difference (FLSD) was used to compare grain yield differences between PP-N and
PP+S-N strategies. Grain yield means at each pre-plant applied N rate with
different letters are statistically different at the P < 0.05 level....................................96
Figure 6. Relationship between total applied N and corn grain yield for pre-plant
applied N (PP-N) and pre-plant + sensor applied N (PP+S-N) in 2010. The
quadratic plateau (QP) regression model parameters were used to calculate
economic optimum N rate (EONR) and nitrogen use efficiency (NUE) for each N
strategy given in Table 4..............................................................................................97
7. vi
LIST OF TABLES
CHAPTER 2. FACTORS AFFECTING ACTIVE CANOPY SENSOR
PERFORMANCE AND REFLECTANCE MEASUREMENTS
Table 1. Soil series and classification from each of the study areas, 2008 ......................23
Table 2. Effect of lighting treatment on near-infrared (NIR) reflectance from a corn
canopy within and across corn hybrid and applied N rates, 2008 ...............................24
Table 3. Effect of lighting treatment on visible (VIS) reflectance from a corn canopy
within and across corn hybrid and applied N rates, 2008............................................25
Table 4. Effect of leaf removal on near-infrared (NIR) reflectance from a V10 corn
canopy using the Crop Circle ACS-210 (CC-210) and GreenSeeker Model 506
(GS-506), 2008 ............................................................................................................26
Table 5. Effect of leaf removal on visible (VIS) reflectance from a V10 corn canopy
using the Crop Circle ACS-210 (CC-210) and GreenSeeker Model 506 (GS-506),
2008..............................................................................................................................27
Table 6. Differences in near-infrared (NIR) and visible (VIS) reflectance from a V10
corn canopy between individual Crop Circle ACS-210 (CC-210) active canopy
sensors (sensors 1, 2, and 3). Measurements were collected from four hybrids and
five N rates at the Ames-M site, 2008 .........................................................................29
Table 7. Differences in near-infrared (NIR) and visible (VIS) reflectance from a V10
corn canopy between individual Crop Circle ACS-210 (CC-210) active canopy
sensors (sensors 1, 2, and 3). Measurements were collected from three hybrids
and five N rates at the Ames-D site, 2008 ...................................................................30
Table 8. Differences in near-infrared (NIR) and visible (VIS) reflectance from a V10
corn canopy between individual Crop Circle ACS-210 (CC-210) active canopy
sensors (sensors 1, 2, and 3). Measurements were collected from two crop
rotations and seven N rates at the Atlantic, Chariton, Kanawha, and Sutherland
sites, 2008 ....................................................................................................................31
Table 9. Effects of sensor combination (sensor 2, sensor 1 + 3, sensor 1 + 2 + 3) on
near-infrared (NIR) and visible (VIS) reflectance from a V10 corn canopy.
Measurements were collected from four hybrids and five N rates at the Ames-M
site, 2008......................................................................................................................32
Table 10. Effects of sensor combination (sensor 2, sensor 1 + 3, sensor 1 + 2 + 3) on
near-infrared (NIR) and visible (VIS) reflectance from a V10 corn canopy.
8. vii
Measurements were collected from three hybrids and five N rates at the Ames-D
site, 2008......................................................................................................................33
Table 11. Effects of sensor combination (sensor 2, sensor 1 + 3, sensor 1 + 2 + 3) on
near-infrared (NIR) and visible (VIS) reflectance from a V10 corn canopy.
Measurements were collected from two crop rotations and seven N rates at the
Atlantic, Chariton, Kanawha, and Sutherland sites, 2008 ...........................................34
CHAPTER 3. USING ACTIVE CANOPY SENSORS TO QUANTIFY CORN
NITROGEN STRESS AND NITROGEN APPLICATION RATE
Table 1. Equations used to calculate active canopy sensor indices for the
GreenSeeker Green 506 (GS-506) and Crop Circle ACS-210 (CC-210)....................57
Table 2. Timing for corn planting, N fertilizer application, and N stress sensing at 62
site-years across Iowa, 2006 – 2008 ............................................................................58
Table 3. The goodness of fit statistics (adjR2
) for the quadratic-plateau (QP)
regression models relating canopy indices and differential from the economic
optimum N rate (dEONR) for the SPAD chlorophyll meter (SPAD-502),
GreenSeeker Green 506 (GS-506), and Crop Circle ACS-210 (CC-210)...................59
Table 4. Quadratic-plateau (QP) regression models and parameters for several
relative canopy indices with the SPAD chlorophyll meter (SPAD-502),
GreenSeeker Green 506 (GS-506), and Crop Circle ACS-210 (CC-210).
Regression models presented for the relative indices with the highest goodness of
fit statistic (adjR2
) from Table 3...................................................................................60
CHAPTER 4. ACTIVE CANOPY SENSING TO ADJUST NITROGEN
APPLICATION RATE IN CORN
Table 1. Soil characterization for the two study sites, 2009 and 2010.............................84
Table 2. Corn grain price and N fertilizer costs during the study, 2009 and 2010 ..........85
Table 3. Quadratic-plateau (QP) regression model and parameters describing the
relationship with corn grain yield and pre-plant applied N (PP-N) and pre-plant +
sensor applied N (PP+S-N) in 2009. The QP model regression parameters are
used to calculate economic optimum N rate (EONR), yield at EONR, and nitrogen
use efficiency (NUE) ...................................................................................................86
Table 4. Quadratic-plateau (QP) regression model and parameters describing the
relationship with corn grain yield and pre-plant applied N (PP-N) and pre-plant +
sensor applied N (PP+S-N) in 2010. The QP model regression parameters are
9. viii
used to calculate economic optimum N rate (EONR), yield at EONR, and nitrogen
use efficiency (NUE) ...................................................................................................87
Table 5. Effects of pre-plant applied N (PP-N) on green normalized difference
vegetative index (GNDVI), relative GNDVI (rGNDVI), and grain yield, 2009 and
2010..............................................................................................................................90
Table 6. Effects of pre-plant applied N plus sensor applied N (PP+S-N) on total
applied N, green normalized difference vegetative index (GNDVI), relative
GNDVI (rGNDVI), and grain yield, 2009 and 2010...................................................91
Table 7. The differential economic optimum N rate (dEONR) for the total N applied
with the pre-plant + sensor applied N (PP+S-N) at the V10 growth stage, 2009
and 2010.......................................................................................................................93
APPENDIX. ADDITIONAL DATA TABLE FROM CHAPTER 4
Table 1. Individual plot means of sensor applied N, total applied N, green
normalized difference vegetative index (GNDVI), relative GNDVI (rGNDVI),
and grain yield from the pre-plant applied N plus sensor applied N (PP+S-N),
2009 and 2010............................................................................................................107
10. 1
CHAPTER 1. GENERAL INTRODUCTION
The state of Iowa ranks among the top U.S. producers of corn (Zea mays L.), planting
13.3 million acres of the crop in 2010. The demand for corn in the U.S. and around the world
is high and likely to grow as human populations grow in the future. The development and
expansion of civilization is leading to increasing needs for crops as human food, livestock
feed, and automotive fuel as ethanol. Evolving corn hybrids and management practices are
elevating the potential for greater corn yields each year. A critical component for corn
production is the efficient management of nitrogen (N) fertilizer. Although, Iowa soils are
fertile and well suited to growing corn, farmers typically must apply fertilizer or other N
containing materials each year to maximize corn yields.
Precision agriculture technologies are becoming part of many farming operations and
can play a key role in sustainable N fertilizer management. Addressing spatially variable corn
fertilizer N requirements with variable rate management strategies can increase profitability
and promotes equitable land stewardship. Active canopy sensors are undergoing continual
development as a method to determine plant N stress deficiency in corn and provide on-the-
go decisions for directing variable rate N application. As a major corn growing region in the
U.S. Corn Belt, active canopy sensor research in Iowa is needed to evaluate their potential
benefit to N fertilizer management.
The research in this dissertation includes field experiments and fertilizer N rate trials
designed to evaluate factors that can alter active sensor measurements, assess the ability of
active sensors to measure N stress, establish useful canopy indices that can serve as N rate
algorithms, and utilize active sensor strategies to direct in-season N applications. The scope
11. 2
of the research investigates the hand-held chlorophyll meter (Minolta SPAD-502 meter) and
two active canopy sensors (Holland Scientific Crop Circle ACS-210 and NTech Industries
GreenSeeker 506) using small plot field studies at seven Iowa State University Research and
Demonstration Farms from 2006 to 2010.
Several field studies were implemented to evaluate factors and canopy conditions that
can influence active sensor measurements. One study collected active sensor readings during
different natural lighting conditions (with and without sunlight during the day and at night)
and artificial lighting conditions (with and without a white halogen light). This will give
insight on active sensor performance under variable light conditions. Another study utilized a
small field experiment that measured active canopy reflectance after the bottom leaves of
corn plants were removed. The information from that experiment can improve our
knowledge on how light from active sensors interact with the corn canopy. A multiple sensor
study was conducted to establish the benefits of using a single sensor, a combination of two
sensors, or a combination of three sensors. This study aides in the understanding of multiple
sensors functioning on field application equipment.
Nitrogen rate trials were conducted over a three year period (2006 – 2008) to
establish relationships between active canopy indices and optimum N rates at the V10 corn
growth stage. Statistically significant regression models defined the relationship between
sensor indices and optimum N. Regression model equations and associated parameters can
serve as N rate algorithms to direct variable rate in-season N fertilizer applications in Iowa
and similar corn production regions. This study also provided an estimate of N application
variability associated with N rate algorithms. The calibration of active sensor indices to
12. 3
applied N rates in corn is a necessary step for implementation as a N fertilizer management
tool in production agriculture.
An in-season N application study was conducted in 2009 and 2010 that utilized active
sensor N application strategies (relative green difference vegetative index N rate algorithm
with the Crop Circle ACS-210 active canopy sensor). Sensing was done at the V10 corn
growth stage and N fertilizer was applied based on active sensor measurements. This study
was designed to test pre-plant plus sensor directed N application, and compare applied N,
yield response to fertilizer N, and corn grain yield with pre-plant applied N. In the future, N
management that includes sensor directed N may increase yields compared to single N
applications prior to planting by providing needed fertilizer N when N losses occur or when
corn N need is uncertain.
The overall research has provided much needed information about active canopy
sensors and their usefulness as an emerging technology in precision agriculture. The canopy
sensor measurements require calibration to applied N rate need in corn for Iowa and regions
that have similar soils and climatic conditions during the growing season. Farmers and
agribusiness can utilize the research to become more comfortable with sensor-based N
management systems. The research also provides answers to critical questions about using
active sensors, and provides data to agribusiness professionals who implement active sensors
in corn production systems. Published results from this active sensor research can also be
helpful to agricultural scientists who collect plant canopy measurements for scientific
research studies and projects for university teaching and extension purposes.
13. 4
DISSERTATION ORGANIZATION
This Ph.D. dissertation is presented as a series of five chapters. The first chapter is an
overview of the dissertation research. The second chapter is entitled “Factors Affecting
Active Canopy Sensor Performance and Reflectance Measurements”. The third chapter is
entitled “Using Active Canopy Sensors to Quantify Corn Nitrogen Stress and Nitrogen
Application Rate”. This chapter was published in Agronomy Journal, Volume 102, Issue 3,
2010, pages 964-971. The fourth chapter is entitled “Active Canopy Sensing to Adjust
Nitrogen Application Rate in Corn”. The fifth and final chapter provides the overall
conclusions of the dissertation research. Chapters two and four are manuscripts that are
intended to be submitted for publication in a journal from the American Society of
Agronomy. This dissertation also includes sections for the author’s vita and an appendix. The
vita describes the author’s biographical information. The appendix shows additional data
from chapter four.
14. 5
CHAPTER 2. FACTORS AFFECTING ACTIVE CANOPY SENSOR
PERFORMANCE AND REFLECTANCE MEASUREMENTS
A paper to be submitted to a journal from the American Society of Agronomy
Daniel W. Barker and John E. Sawyer
Abstract
Identifying factors that can significantly affect optical sensor performance is
important if active canopy remote sensing technology is to be used in production agriculture.
The objectives of this research were to determine the effects of different lighting conditions
on active sensor values, vertical depth penetration of active sensor light into a corn (Zea mays
L.) canopy, and differences between canopy reflectance values from single vs. multiple
active sensors units. Corn was sensed at the V10 growth stage with the GreenSeeker Green
model 506 (GS-506) and Crop Circle ACS-210 (CC-210) active canopy sensors. Canopy
sensing was conducted during the day and at night, and with and without artificial light. The
bottom 2, 4, 6, 8, and 10 leaves of corn plants were removed and canopy sensing was
conducted after each leaf removal treatment. A three-sensor CC-210 unit was used to
determine differences between individual sensors and to compare means when sensor
reflectance values were combined. Near-infrared (NIR) and visible (VIS) reflectance values
from the CC-210 were not affected by different lighting conditions. The GS-506 generated
greater reflectance values during the day, indicating the sensor measured some passive
reflectance via sunlight. The GS-506 had greater vertical light penetration into the corn
canopy compared to the CC-210, likely due to a more concentrated field of view. Different
NIR reflectance values were found with each of the CC-210 active sensor units and with
15. 6
different sensor combinations (Sensors 2, 1 + 3, 1 + 2 + 3). Differences in measured canopy
reflectance between single and multiple CC-210 units were due to individual sensor
variation. Results from this study will be useful for improved operation of active sensors in
production corn fields.
Abbreviations: CC-210, Crop Circle ACS-210 active canopy sensor; FLSD, Fisher’s
Protected Least Significant Difference; GS-506, GreenSeeker Model 506; NDVI, normalized
difference vegetative index; NIR, near-infrared; VIS, visible
16. 7
Introduction
Active canopy sensors have typically been employed by following the manufacturer’s
general use guidelines. But general guidelines may need to be tailored to specific agricultural
crops and production field conditions. If active sensors are to be utilized for N management
in production corn fields by producers, identifying factors that significantly affect canopy
reflectance measurements is warranted.
Sensor prescribed in-season N application in corn could be conducted day and night,
benefitting farmers by providing flexibility to accomplish field operations. This would
provide more time for applications within the sensing window during the mid-vegetative corn
growth stages and therefore help deal with potential rainfall events and wet soil conditions.
Active canopy sensors use a modulated light source to differentiate between natural
background light and the sensor’s emitted light. Silicon photodiodes are designed to capture
only the modulated light reflected from the canopy. Despite the manufacturer claims that the
Ntech GreenSeeker and Holland Scientific Crop Circle sensors work equally well in all
lighting conditions (day or night) (Holland Scientific, 2004; Ntech Industries, 2007),
currently there is little or no supporting published work. Research conducted with airborne
sensors that measure passive light reflectance has shown such factors as zenith angle of the
sun to the canopy, canopy shading effects, and amount of cloud cover significantly alter
canopy reflectance values (Hendrickson et al., 2002; Heege et al., 2008). This passive light
may also influence measured reflectance by active sensors.
Corn planted in 76 cm rows and the canopy architecture during mid-vegetative
growth stages can allow significant amounts of light into the vertical canopy profile. It would
17. 8
be important to know how far modulated light source from active sensors penetrate into the
canopy and how much of the plant from the top down is reflecting light. Corn N deficiency
symptoms are most prevalent in the older, lower leaves and progress up the corn plant
(Sawyer, 2004), but N deficiency also affects the overall plant vegetation. It is unknown how
much of the lower portion of the plant contributes to canopy reflectance measurements.
Another factor shown to significantly affect sensor measurement is reflectance from the soil
background (Daughtry et al., 2000; Asner, 2004). This is of most concern when the canopy
has a low leaf area index (LAI) during early vegetative stages (< V6 growth stage)
(Abendroth et al., 2011). Studies have been conducted on the vertical portion of corn canopy
that possesses the greatest LAI. Regardless of growth stage, the function that best describes
vertical corn canopy LAI is a bell shape, reduced in the top and bottom, and peak in the
middle (Boedhram et al., 2001; Valentinuz and Tollenaar, 2006; Ciganda et al., 2008).
Pena-Yewtukhiw et al. (2008) conducted research using eight NTech GreenSeeker
sensors and found that each sensor typically generated statistically different normalized
difference vegetative index (NDVI) values. Some individual sensors produced consistently
low NDVI values, while other individual sensors produced consistently higher NDVI values.
Roberts et al. (2009) measured optimal sensor placement in corn across a boom width of 18
m. The greatest reduction in mean square error was found when two or three sensors were
averaged across the entire boom width. Also, observed chlorophyll indices across three
neighboring corn rows showed a notable range of variability in chlorophyll index values. A
study conducted in Oklahoma with the GreenSeeker Model 505 sensor found covariance of
NDVI across four corn rows to be approximately 25% at the V10 growth stage (Martin et al.,
18. 9
2007). Several studies have attempted to determine the optimal spatial scale of active sensors
for application of variable rate N fertilizer by altering the number of sensors or distance
between sensors (Solie et al., 1996; Solie et al., 1999; Raun et al., 2002; Phillips et al., 2004;
and Pena-Yewtukhiw et al., 2008). Reported optimal spatial scales, measured grid sizes
based on sensor footprint width and applicator speed, from these studies range from < 1 m2
to
5 m2
.
The objectives of this research were to determine effects of natural and artificial light
sources on active sensor values, vertical depth of active sensor light penetration into a corn
canopy, and differences between mean canopy reflectance values from single vs. multiple
active sensors units.
Materials and Methods
Active Canopy Sensor Equipment
The active sensors used were the CC-210 (Holland Scientific, Lincoln, NE) and GS-
506 (NTech Industries, Ukiah, CA). The CC-210 uses a series of single light emitting diodes
that emit light at the VIS 590 nm and NIR 880 nm wavelengths. Reflected light from the
canopy is captured by two silicon photodiodes on the sensor of varying spectral ranges (400 -
680 nm and 800 - 1100 nm). The sensor projects a rapidly pulsed light beam on the canopy
52 cm wide, depending on the sensor to canopy distance. Data from the sensor were captured
on a handheld computer (HP iPAQ Pocket PC) equipped with HGIS Professional (Star Pal,
Ft. Collins, CO) software. Reflectance data were collected at a sample output rate of 6 Hz
(Holland Scientific, 2004).
The GS-506 (hardware rev. G-K, software ver. 1.6.10) emits light at the VIS 560 nm
19. 10
and NIR 774 nm wavelengths. The GS-506 sensor required periodic maintenance and
calibration for optimum performance, which was performed by NTech Industries, Ukiah, CA
prior to field use each year. The GS-506 sensor projects a relatively constant light beam
width of 37 cm, regardless of sensor to canopy distance. Data from the sensor were captured
on a HP iPAQ Pocket PC equipped with NTech Capture software 2003 ver. 2.0.0.
Reflectance data were collected at a sample output rate of 100 Hz (NTech Industries, 2007).
The mean VIS and NIR reflectance variables were calculated for each sensor in all plots.
Each single sensor unit was mounted on a hand held sensing mast and carried at a
constant speed (1.3 m s–1
) and distance above the canopy (60 - 90 cm) while collecting
reflectance data. The active sensors were positioned perpendicular to the row in the nadir
position (0o
angle) between the middle two rows of each plot. Sensing was conducted when
the corn growth stage across treatments averaged approximately the V10 growth stage.
A sensing mast consisting of three Crop Circle ACS-210 active canopy sensors was also
constructed similar to the hand held single sensor mast unit. When collecting sensor readings,
the mast was centered between the middle two rows of each plot. The spacing between each
sensor was 76 cm. The effective canopy footprint was 52 cm for sensor 2 (0.3 m2
grid size);
105 cm for sensors 1 and 3 combined (0.15 m2
grid size); and 156 cm for sensors 1, 2, and 3
combined (0.1 m2
grid size). The grid sizes were calculated using 6 Hz at 1.3 m s-1
. Data was
collected with the Holland Scientific GeoScout GLS-420 data logger (Holland Scientific,
2006).
Lighting Source Study
This study utilized a fertilizer N rate by corn hybrid study conducted at the Iowa State
20. 11
University Research and Demonstration New Dairy Farm near Ames, IA in 2008. Fertilizer
N treatments were urea broadcast applied and incorporated prior to corn planting. The trial
(Ames-M) was continuous corn with a split-block design and two factors (N fertilizer rate
and corn hybrid), replicated four times. Only two of the replications were utilized in this
study. The N rates were 0, 67, 135, 202, and 270 kg N ha–1
. Corn hybrids were Dekalb 61-72,
61-69, 63-42, and 63-46. Plot sizes were 6 m in width (8 rows) by 15 m in length. Row
spacing was 76 cm. Sensor measurements were collected under day-time (day), night-time
(night), day-time plus light (day + light), and night-time plus light (night + light) conditions
on July 14, 2008. Natural light conditions were established during the daytime (1700 hrs) and
nighttime (2200 hrs) hours. No water (dew) was present on corn leaves at any time during
sensing. To simulate the headlights of a high clearance spray boom, an artificial light
independent from the active sensors was introduced during both timings using a white
halogen light source mounted on the mass just below the active sensors. Sensing was
performed with the GS-506 and CC-210 active canopy sensors.
Light Penetration Study
On July 22, 2008, a uniform stand of corn was selected to perform the experiment at
the Iowa State University Research and Demonstration Sorenson Farm near Ames, IA
(Ames-S site). The study design was a randomized complete block replicated three times.
The corn was at the V10 growth stage. Each plot was 3 m in length. Row spacing was 76 cm.
The corn hybrid planted was Dekalb 61-69. Soybean [Glycine max (L.) Merrill] was grown
during the prior growing season in 2007. A uniform N rate of 134 kg N ha-1
was applied prior
to planting as incorporated urea. The treatments were the removal of bottom corn leaves from
21. 12
the inter-row directly below the sensor (middle), inter-row directly below and the inter-rows
adjacent to the sensor (middle + adjacent), and no leaves removed (control). The corn leaves
removed were the bottom 2, 4, 6, 8, and 10 leaves from the ground. Sensing was performed
with the GS-506 and CC-210 active canopy sensors immediately after leaf removal. The
position of the sensor was directly above the inter-row (centered between the planted corn
rows).
Multiple Sensor Study
This study utilized three fertilizer N rate trials. One trial was conducted at four Iowa
State University Research and Demonstration Farms in 2008. Fertilizer N treatments were
urea broadcast applied and incorporated in spring prior to planting. Four sites located near
Atlantic, Chariton, Kanawha, and Sutherland, IA had N rates in a split-plot randomized
complete block design with four replicates. Corn following soybean and continuous corn
rotations represented the main plots and seven N fertilizer rates of 0, 45, 90, 135, 180, 225,
270 kg N ha–1
as the split plots. Other trials included the Ames-M site and Ames-D site
(another N rate by hybrid trial) located at the Iowa State University Research and
Demonstration New Dairy Farm near Ames, IA. The Ames-D trial was continuous corn in a
split-block design with two factors (N fertilizer rate and corn hybrid), replicated four times.
The N rates at Ames-D were 0, 90, 180, 225, and 270 kg N ha-1
, and hybrids were Mycogen
2T780, 2T785, and 2T787. Plot sizes for all trials were 4.5 m or 6 m in width (6 or 8 rows)
by 15 m or 20 m in length. Corn row spacing was 76 cm at each site.
A sensing mast with three CC-210 active canopy sensors and the GLS-420 data-
logger was utilized to measure canopy light reflectance in this study. In addition to the
22. 13
canopy sensing, a calibration of the sensing equipment was performed by blocking the
modulated light source of the sensors, and gathering NIR and VIS reflectance values. This
was performed in the field just prior to collecting measurements, with the sensors in the same
orientation and position to the canopy. The values were then compared to no NIR (0.0) and
VIS (0.0) reflectance.
Statistics
Mean NIR and VIS reflectance measurements were analyzed using PROC GLM in
SAS (SAS Institute, 2009) for statistical differences between lighting treatment, leaf removal
treatment, individual sensors, and sensor combinations. The Fisher’s Protected Least
Significant Difference (FLSD) method was also used for mean separation of the measured
NIR and VIS differences between lighting, leaf removal, individual sensor, and sensor
combination. The FLSD significance level was 0.05 (treatment means indicated by different
letters are statistically different).
Results and Discussion
Effect of Lighting Source
The different light conditions had no statistically significant effect on NIR reflectance
from the CC-210 across all corn hybrids and N rates (Table 2). Within N rates, there were
greater NIR values during the day and day + light treatments compared to nighttime values in
one of the N rates (202 kg N ha-1
). Differences were also measured in the 67 and 135 kg N
ha-1
rates, but the NIR value with the 67 kg N ha-1
rate was increased with the additional light
at night, but in the day at the 134 kg N ha-1
rate the NIR value was increased with the
additional light. The GS-506 sensor showed significant differences in NIR reflectance
23. 14
measured in the 67 and 202 kg N ha-1
rates. With that sensor, across all hybrids and N rates,
NIR values were statistically different between the day and day + light vs. night and night +
light treatments.
The VIS reflectance measured with CC-210 had a similar trend as with NIR
reflectance, including significant interaction between N rate and lighting (Table 3), but no
overall effect from different lighting conditions. In the 202 kg N ha-1
rate, the CC-210 VIS
values were greater during the day and day + light treatments. Visible reflectance measured
with the GS-506 showed consistent lighting condition effects between and across hybrids and
N rates. The greatest VIS reflectance was measured in the day + light treatment, and the day
measurements were greater than at night.
Overall, lighting conditions (day, night, or plus additional light) did not affect NIR or
VIS reflectance with the CC-210. However, natural light condition (day or night either with
or without additional light) did influence both NIR and VIS reflectance measurements with
the GS-506.
Canopy lighting conditions in a field environment were shown to have an effect on
canopy reflectance measurements from the GS-506. This does not support the claim made by
the manufacturer of the GS-506 that the sensor works equally well in all lighting conditions
(Ntech Industries, 2007). The GS-506 sensor measured less light reflectance during the night-
time (night and night + light treatments) when compared to the day-time (day and day + light
treatments). This will result in an increased calculated canopy reflectance index such as
NDVI when the sensor is used during periods of lower light. For example, a calculated NDVI
value from the night is (0.114 - 0.012 / 0.114 + 0.012) = 0.809 vs. day treatment (0.128 -
24. 15
0.019) / (0.128 + 0.019) = 0.741 (data from Tables 2 and 3). Some examples of lighting
periods that can change canopy index values are during the day-time (morning, mid-day, or
late-day sunlight) and when clouds are present (clear sky, partly cloudy sky, or cloudy sky).
These are similar to conditions, where, measurements from passive sensing instruments are
influenced (Hendrickson et al., 2002; Heege et al., 2008).
The CC-210 sensor reflectance values were unaffected with any of the lighting
conditions. This result supports the manufacturer assertion that the sensor can perform in all
lighting conditions, day or night (Holland Scientific, 2004). The CC-210 can measure canopy
reflectance with greater temporal consistency (time of day and from day to day) compared to
the GS-506 sensor. A benefit of using active sensors for remote canopy sensing is they can
be used to measure canopy reflectance regardless of the lighting conditions, given they
produce their own sources of NIR and VIS light. This allows for greater speed and flexibility
than passive remote sensing methods in how and when they can be utilized in production
agriculture. Overall, the CC-210 measured NIR and VIS reflectance with no interference
across a range of lighting conditions when compared to the GS-506.
Canopy Light Penetration
Tables 4 and 5 show the NIR and VIS reflectance values for the CC-210 and GS-506
sensors when no leaves were removed (control), the bottom corn leaves removed below the
sensor (middle inter-row), and the bottom leaves removed below and adjacent to the sensor
(middle + adjacent inter-rows). The differences between the means of corn inter-row position
with leaves removed, number of leaves removed per plant, and the corn inter-row position by
number of leaves removed interaction were statistically different. The CC-210 NIR and VIS
25. 16
reflectance values in the middle inter-row and middle + adjacent inter-row treatments were
not significantly different from the control until the bottom eight corn leaves were removed.
The GS-506 NIR and VIS reflectance values were significantly affected when four or more
leaves were removed from the bottom of the plant.
The CC-210 and GS-506 sensors differed in the extent to which the active sensor
modulated light reflected from adequate leaf area (control) to reduced leaf area (leaves
removed) in the corn canopy. The sensor field of view for the CC-210 is a pattern of circular
light beams perpendicular to the corn row, which gradually increases in width across the
target area with distance from the sensor (Holland Scientific, 2004). The GS-506 field of
view has a lateral pattern of a single light beam (intensity more focused in the center), which
remains relatively constant across the target area with greater distance (Ntech Industries,
2007). Light from the CC-210 is intercepted by more leaves at the top of the canopy, whereas
the GS-506 field of view results in more light penetrating to lower canopy leaves. There are
advantages and disadvantages related to sensor performance with regard to vertical light
penetration into the canopy. Daughtry et al. (2000) and Asner (2004) reported soil
background is a significant factor affecting sensor readings, especially when canopies have a
low LAI (for example, prior to the V6 growth stage). Stressed corn plants due to nutrient
deficiencies are also an example of canopies with low LAI. The effects of soil color or
surface residue on canopy reflectance measurements would be minimized if the top of the
canopy intercepted more of the sensor’s modulated light, as with the CC-210 sensor.
Nitrogen stress in corn is more pronounced in older, lower plant leaves (Sawyer,
2004), therefore sensors such as the GS-506 that have greater modulated light reaching lower
26. 17
leaves may be more sensitive to N stress deficiency symptoms. Further, the top of the canopy
represents the youngest leaves or newest plant growth. This can represent the most current
plant growing conditions (status of the corn plant) at the time of sensing. Factors such as the
position of the sensor with respect to the corn row (over or between the rows) likely have an
even greater impact on vertical light penetration in corn. Additional work researching row
spacing and/or sensor positioning with active sensors and production row crops is needed.
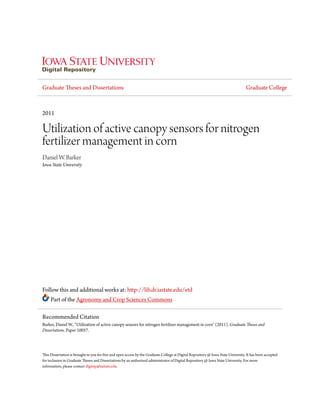
Single vs. Multiple Sensor Values
Figure 1 shows NIR and VIS measurements from each of three CC-210 sensors when
the modulated light source of the sensor is blocked from the light energy collecting photo
diodes. The results reveal small variations in the light measuring function of each sensor.
Sensor 1 shows a normal distribution with the least amount of variation. Sensor 2 has a
negatively skewed NIR distribution with values as low as -0.1095, and a normal VIS
distribution similar to Sensor 1. Sensor 3 had the most variation of any sensor, with a
positively skewed NIR distribution with values as high as 0.2591, and a normal but reduced
VIS distribution compared to Sensors 1 and 2.
The differences between individual CC-210 sensors is also shown when measuring
NIR and VIS reflectance across different corn hybrids, crop rotations, and N rates (Tables 6 -
8). The three CC-210 sensors had significant differences between NIR and VIS reflectance
from each individual sensor. Sensor 1 produced reflectance values greater than Sensors 2 and
3, while Sensor 3 was consistently less than Sensor 1 and 2.
The effect on measured NIR and VIS reflectance values when CC-210 sensors are in
different combinations (Sensor 2, Sensor 1 + 3, and Sensor 1 + 2 + 3) is given in Tables 9 -
27. 18
11. The NIR and VIS reflectance values were not statistically different when readings were
evaluated as a single sensor, a unit with two sensors, or a unit with three sensors (H x SC, CR
x SC, and NR x SC interactions). However, when hybrids, crop rotations, and N rates were
averaged (SC effect), the NIR values from Sensors 1 + 3 and Sensors 1 + 2 + 3 were greater
than from Sensor 2. The SC effect for the VIS reflectance was never statistically different at
the P < 0.05 level. This was likely due to relative small mean differences of VIS values from
sensor combinations across hybrid, crop rotation and N rate.
It is not known why the CC-210 sensors differed from each other when calibration
was performed. However, the Holland Scientific (2004) reported 5 % measurement variation
from the mean is well above the average variation from the mean (< 2 % NIR, < 1 % VIS)
[100 * (observed value – mean value) / mean value)] of the sensors used in this study.
Variation between separate sensors found by Martin et al. (2007) and Roberts et al. (2009)
were quite similar to differences reported in this study.
The performance of individual sensors had a significant effect on mean reflectance
readings when collected with sensor combinations of Sensor 2, Sensors 1 + 3, and Sensors 1
+ 2 + 3. When using a single CC-210 unit for collection of agricultural research data, testing
for a normalized distribution as close to zero NIR and zero VIS reflectance is suggested. This
can be done by blocking the source of modulated light and logging NIR and VIS reflectance
prior to collecting readings. When collecting readings across varying N rates, using one
sensor was equal to using sensor combinations of 1 + 3 and 1 + 2+ 3 (no NR x SC
interactions). Other research suggests that averaging sensor values across application booms
or utilizing fewer sensors adequately describes the crop canopy (Pena-Yewtukhiw et al.,
28. 19
2008; Roberts et al., 2009). In this study, a 3 m wide area was sensed with sensor
combinations of Sensor 2, Sensors 1 + 3, and Sensors 1 + 2 + 3. This amounts to grid sizes
from 0.1 to 0.3 m2
, which is smaller than the recommended sub-meter and meter spatial
resolution suggested by recent studies with optical sensors (Solie et al., 1999; Raun et al.,
2002; Phillips et al., 2004). Spatial resolution of active sensors that is < 1 m2
should be
adequate for use in production agriculture.
Conclusions
The CC-210 NIR and VIS measured reflectance values were not affected by different
lighting conditions. The GS-506 produced NIR and VIS reflectance values during the day
that were greater than values collected at night, suggesting it is detecting canopy light
reflectance from sunlight. The artificial light source used in this study had no effect on the
CC-210, but significantly increased reflectance measurements from the GS-506.
The GS-506 light reaches deeper into the corn canopy and more lower leaves
compared to the CC-210. Canopy reflectance from the GS-506 sensor was reduced when the
bottom 4 leaves were removed, whereas the CC-210 reflectance values were reduced when
the bottom 8 leaves were removed.
Individual CC-210 active sensor units produced different NIR and VIS reflectance
values, although differences were small (< 2 % from mean values) and well within the
manufacturer’s operating range of 5 %. Canopy NIR reflectance values collected with CC-
210 sensor combinations of 1 vs. 2 or 3 sensors were significantly different, likely due to
different values produced between individual sensors. The single sensor (Sensor 2) had the
lowest mean NIR value, and was less than either a combination of two different sensors
29. 20
(Sensors 1 + 3) or a combination of all three sensors (Sensors 1 + 2 + 3).
Differences between sensors in regard to effects of lighting conditions, including
natural sunlight, emitted light characteristics, and variation in sensor measurements can
significantly affect canopy index determination and subsequent corn N stress determination
and N rate prediction. Realizing the greatest potential measurement capabilities of active
sensors is needed to derive the most benefit for N management in production corn fields.
References
Abendroth, L.J., R.W. Elmore, M.J. Boyer, and S.K. Marlay. 2011. Corn growth and
development. PMR 1009. Iowa State University Extension, Ames, Iowa.
Asner, G.P. 2004. Biophysical remote sensing signatures of arid and semiarid ecosystems. p.
53-109. In S. Ustin (ed.) Manual of remote sensing. Vol. 4, Remote sensing for
natural resource management and environmental monitoring. 3rd
ed. John Wiley and
Sons, Hoboken, NJ.
Boedhram, N., T.J. Arkebauer, and W.D. Batchelor. 2001. Season-long characterization of
vertical distribution of leaf area in corn. Agron. J. 93:1235-1242.
Ciganda, V., A. Gitelson, and J. Schepers. 2008. Vertical profile and temporal variation of
chlorophyll in maize canopy: quantitative “crop vigor” indicator by means of
reflectance-based techniques. Agron. J. 100:1409-1417.
Daughtry, C.S., C.L. Walthall, M.S. Kim, E. Brown de Colstoun, and J.E. McMurtrey. 2000.
Estimating corn leaf chlorophyll concentration from leaf and canopy reflectance.
Remote Sens. Environ. 74:229-239.
Heege, H.J., S. Reusch, and E. Thiessen. 2008. Prospects and results for optical systems for
30. 21
site-specific on-the-go control of nitrogen top-dressing in Germany. Precision Agric
9:115-131.
Hendrickson, L.L., S. Han, and G.C. Gries. 2002. Development of nitrogen stress maps from
aerial images. p. 1425-1437. In Proc. 2002 Sixth International Conf. on Prec. Ag.,
ASA Misc. Publ., ASA-CSSA-SSSA, Madison, WI.
Holland Scientific. 2004. Crop Circle ACS-210 plant canopy reflectance sensor instruction
manual. Rev. 1.0. Holland Scientific, Inc., Lincoln, NE.
Holland Scientific. 2006. Crop Circle VRA system user’s manual Rev. 0, 1/04/06. Holland
Scientific, Inc., Lincoln, NE.
Martin, K.L., K. Girma, K.W. Freeman, R.K. Teal, B. Tubana, D.B. Arnall, B. Chung, O.
Walsh, J.B. Solie, M.L. Stone, and W.R. Raun. 2007. Expression of variability in
corn as influenced by growth stage using optical sensor measurements. Agron. J.
99:384-389.
NTech Industries. 2007. Model 505 GreenSeeker hand held optical sensor unit operating
manual. Available at http://www.ntechindustries.com/lit/gs/GS_HandHeld _Manual
_rev_K.pdf (verified June 1 2011). NTech Industries, Inc., Ukiah, CA.
Pena-Yewtukhiw, E.M., G.J. Schwab, J.H. Grove, L.W. Murdock, and J.T. Johnson. 2008.
Spatial analysis of early wheat canopy normalized difference vegetative index:
determining appropriate observation scale. Agron. J. 100:454-462.
Phillips, S.B., D.A. Keahey, J.G. Warren, and G.L. Mullins. 2004. Estimating winter wheat
tiller density using spectral reflectance sensors for early-spring, variable-rate nitrogen
applications. Agron. J. 96:591-600.
31. 22
Raun, W.R., J.B. Solie, G.V. Johnson, M.L. Stone, R.W. Mullen, K.W. Freeman, W.E.
Thomason, and E.V. Lukina. 2002. Improving nitrogen use efficiency in cereal grain
production with optical sensing and variable rate application. Agron. J. 94:815-820.
Roberts D.F., V.I. Adamchuk, J.F. Shanahan, R.B. Ferguson, and J.S. Schepers. 2009.
Optimization of crop canopy sensor placement for measuring nitrogen status in corn.
Agron. J. 101:140-149.
SAS Institute. 2009. SAS user’s guide: Release 9.1. SAS Inst., Cary, NC.
Sawyer, J.E. 2004. Nutrient deficiencies and application injuries in field crops. IPM 42. Rev.
ed. Iowa State Univ. Coop. Ext. Serv., Ames.
Solie, J.B., W.R. Raun, and M.L. Stone. 1999. Sub meter spatial variability of selected soil
and bermuda grass production variables. Soil Sci. Soc. Am. J. 63:1724-1733.
Solie, J.B., W.R. Raun, R.W. Whitney, M.L. Stone, and J.D. Ringer. 1996. Optical sensor
based field element size and sensing strategy for nitrogen application. Trans. ASAE
39:1983-1992.
Valentinuz, O.R., and M. Tollenaar. 2006. Effect of genotype, nitrogen, plant density, and
row spacing on the area-per-leaf profile in maize. Agron. J. 98:94-99.
32.
23
Table 1. Soil series and classification from each of the study areas, 2008.
Site Soil series Soil classification
Lighting source study
Ames-M Nicollet loam fine-loamy, mixed, superactive, mesic Aquic Hapludolls
Light penetration study
Ames-S Webster silty clay loam fine-loamy, mixed, superactive, mesic Typic Endoaquolls
Multiple sensor study
Ames-M Nicollet loam fine-loamy, mixed, superactive, mesic Aquic Hapludolls
Ames-D Canisteo clay loam fine-loamy, mixed, superactive, calcareous, mesic Typic Endoaquolls
Atlantic Marshall silty clay loam fine-silty, mixed, superactive, mesic Typic Hapludolls
Kanawha Canisteo clay loam fine-loamy, mixed, superactive, calcareous, mesic Typic Endoaquolls
Chariton Haig silty clay loam fine, smectitic, mesic Vertic Argiaquolls
Sutherland Galva silty clay loam fine-silty, mixed, superactive, mesic Typic Hapludolls
33.
24
Table 2. Effect of lighting treatment on near-infrared (NIR) reflectance from a corn canopy within and across corn hybrids and
applied N rates, 2008.
Ames-M
NIR
CC-210 GS-506
Lighting treatment (L)
Mean
Lighting treatment (L)
MeanDay
Day +
light Night
Night +
light Day
Day +
light Night
Night +
light
Hybrid (H) x L H H
DeKalb 61-69 0.362 0.369 0.362 0.369 0.366 0.127 0.137 0.121 0.122 0.127
DeKalb 61-73 0.350 0.344 0.350 0.344 0.347 0.126 0.129 0.111 0.117 0.121
DeKalb 63-42 0.356 0.353 0.356 0.353 0.355 0.134 0.140 0.115 0.121 0.128
DeKalb 63-46 0.361 0.353 0.361 0.353 0.357 0.126 0.130 0.110 0.115 0.120
N Rate (NR) x L NR NR
kg N ha-1
0 0.261 0.255 0.325 0.318 0.290 0.089 0.088 0.082 0.082 0.085
67 0.351 0.344 0.391 0.404 0.373 0.121 0.127 0.108 0.109 0.116
135 0.391 0.404 0.351 0.344 0.373 0.148 0.153 0.130 0.141 0.143
202 0.408 0.403 0.306 0.297 0.353 0.146 0.159 0.134 0.137 0.144
270 0.375 0.367 0.414 0.411 0.392 0.138 0.144 0.119 0.123 0.131
L mean†
0.357a 0.355a 0.357a 0.355a 0.128ba 0.134a 0.114c 0.119bc
Statistics
------------------------------- P > F -------------------------------
H 0.492 0.072
NR 0.001 0.001
L 0.992 0.001
H x L 1.000 0.966
NR x L 0.001 0.913
† Different letters in the row for each sensor indicate means are statistically different (P < 0.05).
34.
25
Table 3. Effect of lighting treatment on visible (VIS) reflectance from a corn canopy within and across corn hybrids and applied N
rates, 2008.
Ames-M
VIS
CC-210 GS-506
Lighting treatment (L)
Mean
Lighting treatment (L)
MeanDay
Day +
light Night
Night +
light Day
Day +
light Night
Night +
light
Hybrid (H) x L H H
DeKalb 61-69 0.058 0.059 0.058 0.059 0.059 0.019 0.020 0.012 0.012 0.016
DeKalb 61-73 0.057 0.056 0.057 0.056 0.056 0.019 0.020 0.011 0.012 0.015
DeKalb 63-42 0.062 0.061 0.062 0.061 0.061 0.020 0.021 0.012 0.013 0.016
DeKalb 63-46 0.060 0.058 0.060 0.058 0.059 0.019 0.021 0.011 0.012 0.016
N Rate (NR) x L NR NR
kg N ha-1
0 0.055 0.053 0.057 0.055 0.055 0.018 0.018 0.011 0.011 0.015
67 0.059 0.058 0.060 0.062 0.060 0.019 0.020 0.011 0.012 0.016
135 0.060 0.062 0.059 0.058 0.060 0.020 0.021 0.012 0.014 0.017
202 0.061 0.061 0.055 0.053 0.058 0.020 0.022 0.012 0.013 0.017
270 0.058 0.057 0.063 0.062 0.060 0.019 0.021 0.011 0.012 0.016
L mean†
0.059a 0.058a 0.059a 0.058a 0.019b 0.020a 0.012c 0.012c
Statistics
------------------------------- P > F -------------------------------
H 0.004 0.012
NR 0.002 0.001
L 0.888 0.001
H x L 0.998 0.927
NR x L 0.044 0.827
† Different letters in the row for each sensor indicate means are statistically different (P < 0.05).
35.
26
Table 4. Effect of leaf removal on near infrared (NIR) reflectance from a V10 corn canopy using the Crop Circle ACS-210 (CC-
210) and GreenSeeker Model 506 (GS-506), 2008.
NIR
Inter-row
position (IP)†
CC-210 GS-506
Bottom plant leaves removed (LR)‡
IP
Mean
Bottom plant leaves removed (LR)‡
IP
Mean2 4 6 8 10 2 4 6 8 10
C 0.244a 0.246a 0.245a 0.265a 0.265a 0.253 0.094a 0.102a 0.108a 0.118a 0.103a 0.105
M 0.253a 0.243a 0.195a 0.100b 0.064b 0.171 0.071a 0.079ba 0.057b 0.029b 0.024b 0.052
M + A 0.248a 0.235a 0.199a 0.087b 0.038b 0.161 0.091a 0.073b 0.062b 0.031b 0.013b 0.054
Statistics
--------------------------------- P > F ---------------------------------
IP 0.001 0.001
LR 0.001 0.013
IP x LR 0.001 0.001
† C, control; M, middle inter-row; M + A, middle + adjacent inter-rows.
‡ Different letters in the column for each sensor and LR treatment indicate means are statistically different (P < 0.05).
36.
27
Table 5. Effect of leaf removal on visible (VIS) reflectance from a V10 corn canopy using the Crop Circle ACS-210 (CC-210) and
GreenSeeker Model 506 (GS-506), 2008.
VIS
Inter-row
position (IP)†
CC-210 GS-506
Bottom plant leaves removed (LR)‡
IP
Mean
Bottom plant leaves removed (LR)‡
IP
Mean2 4 6 8 10 2 4 6 8 10
C 0.033a 0.034a 0.035a 0.037a 0.037a 0.035 0.018a 0.020a 0.021a 0.023a 0.021a 0.021
M 0.035a 0.034a 0.032a 0.021b 0.017b 0.028 0.017a 0.018b 0.017b 0.015b 0.015b 0.016
M + A 0.034a 0.034a 0.030a 0.020b 0.015b 0.027 0.016a 0.018ba 0.017b 0.015b 0.013b 0.016
Statistics
--------------------------------- P > F ---------------------------------
IP 0.001 0.001
LR 0.001 0.013
IP x LR 0.001 0.001
† C, control; M, middle inter-row; M + A, middle + adjacent inter-rows.
‡ Different letters in the column for each sensor and LR treatment indicate means are statistically different (P < 0.05).
37. 28
Figure 1. Box and whisker plot of near-infrared (NIR) and visible (VIS) measurements from
three Crop Circle ACS-210 (CC-210) active canopy sensor units when the modulated light
source is blocked from the photo detectors. Lower and upper limits of each box indicates the
25th
and 75th
percentile; horizontal solid line in the box indicates the median; horizontal
dashed line in the box indicates the mean; the lower and upper limits of the whiskers indicate
the 10th
and 90th
percentile; dots indicate the minimum and maximum reflectance
observation.
38. 29
Table 6. Differences in near-infrared (NIR) and visible (VIS) reflectance from a V10 corn
canopy between individual Crop Circle ACS-210 (CC-210) active canopy sensors (sensors 1,
2, and 3). Measurements were collected from four hybrids and five N rates at the Ames-M
site, 2008.
NIR VIS
Sensor 1 Sensor 2 Sensor 3 Mean Sensor 1 Sensor 2 Sensor 3 Mean
Hybrid (H) x S H H
Dekalb 61-69 0.385 0.353 0.348 0.362 0.067 0.066 0.063 0.065
Dekalb 61-73 0.449 0.372 0.353 0.391 0.077 0.072 0.064 0.071
Dekalb 63-42 0.373 0.340 0.342 0.352 0.066 0.065 0.063 0.064
Dekalb 63-46 0.426 0.353 0.336 0.372 0.071 0.066 0.060 0.065
N Rate (NR) x S NR NR
kg N ha-1
0 0.319 0.276 0.281 0.292 0.069 0.067 0.064 0.066
67 0.401 0.344 0.331 0.358 0.071 0.066 0.062 0.066
135 0.447 0.402 0.376 0.408 0.073 0.073 0.065 0.070
202 0.452 0.385 0.378 0.405 0.071 0.066 0.062 0.067
270 0.420 0.364 0.357 0.381 0.068 0.064 0.059 0.064
Sensor (S) mean†
0.408a 0.354b 0.345c 0.070a 0.067b 0.062c
Statistics
-------------------- P > F --------------------
H 0.001 0.001
NR 0.001 0.001
S 0.001 0.001
H x S 0.001 0.001
NR x S 0.092 0.436
† Different letters in the row by wavelength for sensor indicate means are statistically
different (P < 0.05).
39. 30
Table 7. Differences in near-infrared (NIR) and visible (VIS) reflectance from a V10 corn
canopy between individual Crop Circle ACS-210 (CC-210) active canopy sensors (sensors 1,
2, and 3). Measurements were collected from three hybrids and five N rates at the Ames-D
site, 2008.
NIR VIS
Sensor 1 Sensor 2 Sensor 3 Mean Sensor 1 Sensor 2 Sensor 3 Mean
Hybrid (H) x S H H
Mycogen 2T780 0.408 0.360 0.360 0.376 0.068 0.067 0.062 0.066
Mycogen 2T787 0.455 0.361 0.334 0.383 0.075 0.067 0.059 0.067
Mycogen 2T785 0.455 0.396 0.388 0.413 0.076 0.074 0.067 0.072
N Rate (NR) x S NR NR
kg N ha-1
0 0.373 0.313 0.308 0.331 0.071 0.068 0.062 0.067
90 0.440 0.381 0.362 0.394 0.073 0.070 0.062 0.068
180 0.493 0.403 0.398 0.431 0.078 0.071 0.065 0.072
225 0.469 0.392 0.385 0.416 0.074 0.070 0.065 0.070
270 0.424 0.375 0.350 0.383 0.069 0.068 0.060 0.066
Sensor (S) mean†
0.439a 0.372b 0.360c 0.073a 0.069b 0.063c
Statistics
-------------------- P > F --------------------
H 0.001 0.001
NR 0.001 0.001
S 0.001 0.001
H x S 0.001 0.001
NR x S 0.472 0.395
† Different letters in the row by wavelength for sensor indicate means are statistically
different (P < 0.05).
40. 31
Table 8. Differences in near-infrared (NIR) and visible (VIS) reflectance from a V10 corn
canopy between individual Crop Circle ACS-210 (CC-210) active canopy sensors (sensors 1,
2, and 3). Measurements were collected from two crop rotations and seven N rates at the
Atlantic, Chariton, Kanawha, and Sutherland sites, 2008.
NIR VIS
Sensor 1 Sensor 2 Sensor 3 Mean Sensor 1 Sensor 2 Sensor 3 Mean
CR†
x S CR CR
C-C 0.340 0.294 0.272 0.302 0.065 0.062 0.055 0.061
C-S 0.460 0.386 0.367 0.404 0.073 0.068 0.062 0.068
N Rate (NR) x S NR NR
kg N ha-1
0 0.286 0.241 0.236 0.254 0.065 0.062 0.056 0.061
45 0.343 0.292 0.284 0.307 0.067 0.063 0.058 0.063
90 0.391 0.330 0.310 0.343 0.069 0.065 0.058 0.064
135 0.417 0.356 0.323 0.365 0.069 0.065 0.057 0.064
180 0.448 0.383 0.359 0.397 0.072 0.067 0.060 0.066
224 0.451 0.377 0.350 0.392 0.071 0.066 0.058 0.065
270 0.455 0.392 0.365 0.404 0.071 0.067 0.060 0.066
Sensor (S) mean‡
0.399a 0.339b 0.319c 0.069a 0.065b 0.058c
Statistics
-------------------- P > F --------------------
CR 0.001 0.001
NR 0.001 0.001
S 0.001 0.001
CR x S 0.001 0.013
NR x S 0.001 0.524
† CR, crop rotation; C-C, continuous corn, C-S, corn rotated with soybean.
‡ Different letters in the row by wavelength for sensor indicate means are statistically
different (P < 0.05).
41. 32
Table 9. Effect of sensor combination (sensor 2, sensor 1 + 3, sensor 1 + 2 + 3) on near-
infrared (NIR) and visible (VIS) reflectance from a V10 corn canopy. Measurements were
collected from four hybrids and five N rates at the Ames-M site, 2008.
NIR VIS
Sensor combination (SC)
Mean
Sensor combination (SC)
Mean
Sensor
2
Sensor
1+3
Sensor
1+2+3
Sensor
2
Sensor
1+3
Sensor
1+2+3
Hybrid (H) x SC H H
Dekalb 61-69 0.353 0.385 0.374 0.371 0.066 0.066 0.066 0.066
Dekalb 61-73 0.360 0.388 0.379 0.375 0.066 0.067 0.067 0.066
Dekalb 63-42 0.340 0.363 0.355 0.353 0.067 0.067 0.067 0.067
Dekalb 63-46 0.365 0.370 0.368 0.368 0.070 0.067 0.068 0.068
N Rate (NR) x SC NR NR
kg N ha-1
0 0.276 0.300 0.292 0.289 0.067 0.066 0.066 0.066
67 0.343 0.366 0.358 0.356 0.066 0.066 0.066 0.066
135 0.404 0.412 0.409 0.408 0.073 0.069 0.070 0.071
202 0.386 0.415 0.405 0.402 0.067 0.067 0.067 0.067
270 0.365 0.389 0.381 0.378 0.064 0.064 0.064 0.064
SC mean†
0.355b 0.376a 0.369ab 0.067a 0.066a 0.067a
Statistics
-------------------- P > F --------------------
H 0.193 0.614
NR 0.001 0.062
SC 0.069 0.877
H x SC 0.977 0.995
NR x SC 0.999 0.999
† Different letters in the row by wavelength for sensor indicate means are statistically
different (P < 0.05).
42. 33
Table 10. Effect of sensor combination (sensor 2, sensor 1 + 3, sensor 1 + 2 + 3) on near-
infrared (NIR) and visible (VIS) reflectance from a V10 corn canopy. Measurements were
collected from three hybrids and five N rates at the Ames-D site, 2008.
NIR VIS
Sensor combination (SC)
Mean
Sensor combination (SC)
Mean
Sensor
2
Sensor
1+3
Sensor
1+2+3
Sensor
2
Sensor
1+3
Sensor
1+2+3
Hybrid (H) x SC H H
Mycogen 2T780 0.360 0.384 0.376 0.374 0.067 0.065 0.066 0.066
Mycogen 2T787 0.364 0.398 0.387 0.383 0.067 0.068 0.068 0.068
Mycogen 2T785 0.394 0.420 0.411 0.408 0.074 0.071 0.072 0.072
N Rate (NR) x SC NR NR
kg N ha-1
0 0.313 0.341 0.332 0.329 0.068 0.067 0.067 0.067
90 0.380 0.401 0.394 0.392 0.070 0.067 0.068 0.068
180 0.402 0.447 0.432 0.427 0.072 0.072 0.072 0.072
225 0.392 0.426 0.415 0.411 0.071 0.069 0.070 0.070
270 0.375 0.388 0.384 0.382 0.068 0.065 0.066 0.066
SC mean†
0.372b 0.401a 0.391ab 0.069a 0.068a 0.068a
Statistics
-------------------- P > F --------------------
H 0.002 0.001
NR 0.001 0.034
SC 0.020 0.590
H x SC 0.994 0.953
NR x SC 0.996 0.999
† Different letters in the row by wavelength for sensor indicate means are statistically
different (P < 0.05).
43. 34
Table 11. Effect of sensor combination (sensor 2, sensor 1 + 3, sensor 1 + 2 + 3) on near-
infrared (NIR) and visible (VIS) reflectance from a V10 corn canopy. Measurements were
collected from two crop rotations and seven N rates at the Atlantic, Chariton, Kanawha, and
Sutherland sites, 2008.
NIR VIS
Sensor combination (SC)
Mean
Sensor combination (SC)
Mean
Sensor
2
Sensor
1+3
Sensor
1+2+3
Sensor
2
Sensor
1+3
Sensor
1+2+3
CR†
x SC CR CR
C-C 0.302 0.316 0.311 0.310 0.063 0.061 0.062 0.062
C-S 0.387 0.415 0.406 0.403 0.069 0.068 0.068 0.068
N Rate (NR) x SC NR NR
kg N ha-1
0 0.250 0.269 0.263 0.261 0.064 0.062 0.063 0.063
45 0.302 0.323 0.317 0.314 0.065 0.063 0.064 0.064
90 0.340 0.360 0.353 0.351 0.066 0.064 0.065 0.065
135 0.363 0.378 0.373 0.371 0.066 0.064 0.065 0.065
180 0.385 0.408 0.400 0.398 0.068 0.067 0.067 0.067
224 0.382 0.407 0.399 0.396 0.067 0.066 0.066 0.066
270 0.392 0.412 0.405 0.403 0.068 0.066 0.067 0.067
SC mean‡
0.345b 0.365a 0.358a 0.066a 0.065a 0.065a
Statistics
-------------------- P > F --------------------
CR 0.001 0.001
NR 0.001 0.018
SC 0.007 0.229
CR x SC 0.564 0.732
NR x SC 1.000 1.000
† CR, crop rotation; C-C, continuous corn, C-S, corn rotated with soybean.
‡ Different letters in the row by wavelength for sensor indicate means are statistically
different (P < 0.05).
44. 35
CHAPTER 3. USING ACTIVE CANOPY SENSORS TO QUANTIFY CORN
NITROGEN STRESS AND NITROGEN APPLICATION RATE1
A paper published in Agronomy Journal 102:964-971 (2010)
Daniel W. Barker 2,3,4
and John E. Sawyer 2
Abstract
In-season corn (Zea mays L.) N sensing with active canopy sensors can provide input
variables that direct variable rate N fertilizer applications. The objectives of this study were
to assess corn N stress at the V10 - V12 growth stages, establish canopy indices that relate to
optimum N application, and provide N rate algorithms for use in applying variable rate N
fertilizer. Corn was sensed with the GreenSeeker Green 506 (GS-506) and Crop Circle ACS-
210 (CC-210) active canopy sensors. Sensing was conducted in N rate trials over 3 years
encompassing 62 site-years across Iowa. The relationship between sensor indices and
differential from economic optimum N rate (dEONR) was evaluated by fitting quadratic-
plateau (QP) regression models between sensor values and dEONR. Sensing corn at the V10
- V12 stages resulted in statistically significant QP models relating sensor indices to corn N
response. Relative canopy index models had greater adjR2
values than others, resulting in
better representation between canopy index values and dEONR. These were the relative
simple ratio index (rSRI), relative green difference vegetative index (rGDVI), and relative
modified simple ratio index (rMSRI) for the GS-506 sensor, and relative green normalized
1
From Agron. J. 102:964-971 (2010), with permission, copyright Am. Soc. of Agronomy.
2
Assistant Scientist and Professor, respectively, Department of Agronomy, Iowa State Univ.,
Ames, IA 50011.
3
Primary researcher and author.
4
Corresponding author.
45. 36
difference vegetative index (rGNDVI), rSRI, rMSRI, and rGDVI for the CC-210 sensor.
Variability in sensor prescribed N rate was greatest at slight N deficiencies (0 - 50 kg N ha–1
deficit dEONR). Several indices relating to canopy biomass (rGNDVI) or canopy chlorophyll
(rSRI, rMSRI, or rGDVI) can be used as an N rate algorithm for applying N fertilizer in-
season.
Abbreviations: adjR2
, adjusted R2
; CC-210, Crop Circle ACS-210 active canopy sensor; R2
,
coefficient of determination; dEONR, nitrogen rate differential from the economic optimum
nitrogen rate; EONR, economic optimum nitrogen rate; GDVI, green difference vegetative
index; GNDVI, green normalized difference vegetative index; GDD, growing degree day;
GS-506, GreenSeeker Green 506 active canopy sensor; LCL, 95% lower QP model
confidence limit; MNDVI, modified normalized difference vegetative index; MSRI,
modified simple ratio index; NIR, near-infrared; NDVI, normalized difference vegetative
index; NLI, non-linear index; rGDVI, relative green difference vegetative index; rGNDVI,
relative green normalized difference vegetative index; rMNDVI, relative modified
normalized difference vegetative index; rMSRI, relative modified simple ratio index; rNIR,
relative near infrared; rNLI, relative non-linear index; rRDVI, relative re-normalized
difference vegetative index; rSRI, relative simple ratio index; rSPAD, relative SPAD index;
RDVI, re-normalized difference vegetative index; SPAD-502, SPAD 502 chlorophyll meter;
SRI, simple ratio index; rVIS, relative visible index; QP, quadratic-plateau; UCL, 95% upper
QP model confidence limit; VIS, visible.
46. 37
Introduction
Precision agriculture technologies are becoming an integral part of farming operations
for crop production, including fertilizer management in the U.S. Corn Belt. Active canopy
sensors are continually being developed and tested as an input variable used to implement
variable rate N fertilizer management strategies in corn. Canopy sensors can differentiate
site-specific N need, thus potentially reducing N fertilizer application across fields while
maintaining crop yields. Improving N use efficiency by addressing spatial variability of corn
fertilizer N requirements can increase profitability and promotes equitable land stewardship.
Since the early 1990’s, on-going research has been conducted using the SPAD
chlorophyll meter (SPAD-502) as a plant based testing method to determine N fertilization
need. Schepers et al. (1992) found significant differences in SPAD readings between sites,
corn hybrids, and growth stages suggesting that normalization procedures are needed to
standardize readings in order for the SPAD-502 to be a practical N management tool.
Normalization procedures require a non-limiting N fertilized field area as a comparison to
areas where N may be deficient. This normalization produces a relative SPAD value
(rSPAD), sometimes called a sufficiency index (Schepers et al., 1992). This normalization
has been shown to be important by others with the SPAD-502 (Varvel et al., 1997; Scharf et
al., 2006; Hawkins et al., 2007; Varvel et al., 2007; Ziadi et al., 2008).
Researchers from Missouri summarized a regional experiment in the North-Central
USA evaluating the SPAD-502 to predict corn N fertilization (Scharf et al., 2006). They
found rSPAD values correlated well to the economic optimum N rate (EONR) and yield
response to N in corn, and were more accurate in predicting N need when N fertilizer was not
47. 38
previously applied, when sensing was performed later in the growing season, and when
readings were normalized. Findings from Hawkins et al. (2007) in Iowa and Varvel et al.
(2007) in Nebraska indicated that in-season N stress in corn can be detected with the SPAD-
502 and N rate algorithms could be developed to make in-season N rate applications between
the V8 - V12 growth stages. Although, the SPAD-502 can detect N deficiencies, a study by
Zhang et al. (2008) indicated limited potential for use in production corn fields under
moderate N stress and near optimum N.
Canopy reflectance measurement at optical wavelengths with active canopy sensors is
a relatively new method of remote sensing. The concept of remote sensing using reflectance
measurements from active sensors is similar to that of natural light reflectance with passive
sensing technologies using hand-held, aerial, and satellite platforms. However, active sensors
utilize their own light source and measure light reflectance in real-time at the canopy level.
Researchers in Oklahoma studied active sensors as a method to improve N use
efficiency in winter wheat (Triticum aestivum L.) (Raun et al., 2002). Optical sensing
strategies developed in that work incorporated estimates of grain yield potential at the time of
sensing. When compared to uniform N rate application based on traditional yield goal, N use
efficiency was improved 15% using in-season N application guided by optical canopy
sensors. Further, a study predicting corn grain yield using active sensors was conducted as a
method to improve N fertilizer use (Teal et al., 2006). It was determined normalized
difference vegetative index (NDVI) at approximately the V8 growth stage could predict corn
yield potential. Another study utilizing optical canopy sensors to determine sidedress N rate
in corn at the V6 - V7 growth stages found that relative NDVI was strongly related to the
48. 39
calculated EONR (Dellinger et al., 2008). Findings were limited to situations where no N or
very little N fertilizer was applied at corn planting, suggesting that sensing subtle N
deficiencies in corn at the V6 - V7 stage was difficult. Additional investigations led
researchers to conclude that plant N stress sensing when compared to traditional soil and
plant NO3 tests has a greater potential to address spatial and temporal variability associated
with N fertilizer management in corn (Schmidt et al., 2009). Use of active sensors to direct
variable rate N application must be limited to situations where N stress is identified as the
main limiting plant growth factor. This point was emphasized by Zillmann et al. (2006),
concluding the cause for limited plant growth and field variability must be fully understood
before sensor based N fertilizer is applied.
Multiple canopy indices in corn can be calculated from visible (VIS) and near-
infrared (NIR) reflectance variables collected with active sensors. Some indices emphasize
specific plant canopy characteristics such as leaf area index, leaf chlorophyll, whole plant
biomass, plant density, canopy temperature, and canopy moisture content (Gong et al., 2003;
Hatfield et al., 2008; Eitel et al., 2009; Samborski et al., 2009). These indices were originally
developed from passive remote sensing systems, but are now being used to assess plant
health and vigor with active sensors at the canopy level. Recent investigations with the CC-
210 were conducted by Sripada et al. (2008) in rainfed corn and Solari et al. (2008) in
irrigated corn. Sripada et al. (2008) developed a prediction model for EONR at any given N
fertilizer to corn price ratio using green normalized difference vegetative index (GNDVI).
Solari et al. (2008) determined that green difference vegetative index (GDVI) (also referred
to as the chlorophyll index, CI590) collected during vegetative growth stages in corn was the
49. 40
most sensitive to canopy N status and could best direct variable rate N application. Heege et
al. (2008) suggested biomass is a more reliable indicator of crop N status than chlorophyll
concentration. They also found NDVI to have the lowest standard deviation in winter wheat
among the common spectral indices investigated.
There can be significant temporal variability in corn N stress during the growing
season. If plant N sensing is to be a successful N management practice, some level of plant N
stress or deficiency must be present. Significant N uptake in corn does not begin until the V6
growth stage (Abendroth et al., 2011). Sensing too early in the corn canopy development will
not show enough N stress or have adequate above ground biomass for sensors to collect
accurate readings. Sensing in the later vegetative stages (V15 - V18) can provide for more N
stress development and greater differences in N stress, but delays in-season N application and
increases the risk of yield reduction due to N deficiencies. Some recent examples of
suggested timing strategies in corn are sensing at the V10 - R1 (Scharf et al., 2006), V8 -
V12 (Varvel et al., 2007), V11 - V15 (Solari et al., 2008), V6 - V7 (Dellinger et al., 2008),
V12 (Ziadi et al., 2008), and V7 - V11 (Kitchen et al., 2010) growth stages.
Recently, Samborski et al. (2009) and Hatfield et al. (2008) performed a review of
remote sensing techniques with active canopy sensors. The importance of developing
practical algorithms for use in production agricultural was emphasized, and may be
instrumental in canopy sensors receiving broad support as an N management tool. But the
reviewers also stressed sensor algorithms are limited to the regions and growing conditions
where they are developed. An additional complicating factor when using canopy sensors in
producer fields can be detection of growth variables unrelated to plant N stress, such as plant
50. 41
moisture deficit or reduced growth due to varying soils. Nitrogen rate algorithms based on
canopy sensor inputs need to be robust for a range of field conditions, developed for specific
regions, and easily implemented with precision agriculture application equipment.
In Iowa, farming operations are incorporating more automation in chemical and
fertilizer delivery systems. In the case for N fertilizer, sensing of canopy vegetation can be
used with in-season variable rate applicators to direct on the go N application in corn.
Nitrogen rate algorithms are the mathematical models needed to calibrate active sensor
canopy values with optimal N rates. The objectives of this study were to assess N stress
levels at the V10 - V12 corn growth stages with active canopy sensors, establish canopy
indices that correspond to optimum N rates, and provide N rate algorithms that can be used to
apply variable rate N fertilizer in Iowa and geographic areas with similar corn production
conditions.
Materials and Methods
Study Design
This study utilized fertilizer N rate trials conducted in corn from 2006 - 2008 (62 site-
years) at Iowa State University Research and Demonstration Farms representing predominant
Iowa soils with varying levels of N responsiveness. The research farms were located in
Hancock (42o
01'12''N 93o
47'40''W), Floyd (42o
56'11''N 92o
34'12''W), Lucas (40o
58'23''N
93o
25'25''W), O’Brien (42o
55'30''N 95o
32'19''W), Pottawattamie (41o
18'39''N 95o
10'25''W),
Story (42o
01'12''N 93o
46'23''W), and Washington (41o
12'13''N 91o
29'11''W) counties in Iowa.
Fertilizer N treatments for all site-years were applied in spring prior to planting as
ammonium nitrate broadcast on the soil surface, urea broadcast and incorporated, or urea
51. 42
ammonium nitrate solution surface applied and incorporated. Trial 1 (41 site-years) used a
split-plot randomized complete block design with four replicates. Corn following soybean
[Glycine max (L.) Merrill] and continuous corn rotations represented the main plots and
seven N fertilizer rates of 0, 45, 90, 134, 179, 224, 269 kg N ha–1
as the split plots. Site-years
had crop rotations and N rate treatments in place as little as two years and as many as eight
years. Trial 2 (14 site-years) used a randomized complete block design with four replications
of six N fertilizer rates of 0, 45, 90, 134, 179, 224 kg N ha–1
in a corn-soybean rotation.
Trials 3 and 4 (7 site-years) used a strip plot design with two factors (N fertilizer rate and
corn hybrid), replicated four times in continuous corn. The N rates in trial 3 were 0, 67, 134,
202, and 269 kg N ha–1
and in trial 4 were 0, 90, 179, 224, and 269 kg N ha–1
.
The tillage system for all trials was chisel plow after grain harvest in fall, and field
cultivation prior to corn planting in spring. Phosphorus and K fertilizers were surface
broadcast applied in the fall or spring prior to planting at each site-year to maintain soil tests
at or above optimum levels for corn and soybean production (Sawyer et al., 2008). Plot sizes
were 4.5 m or 6 m in width (6 or 8 rows) by 15 m or 20 m in length. Row spacing for all site-
years was 76 cm.
Sensor Measurements and Weather Data
Corn plant sensing was conducted using a SPAD-502 meter (Konica Minolta, Japan)
and two active canopy sensors. The SPAD-502 provides a measure of the relative amount of
chlorophyll in plant leaves. It measures light transmittance through individual plant leaves
and utilizes two light emitting diode sources at the VIS 650 nm and NIR 940 nm
wavelengths. The light is transmitted through the leaf and is received by a silicon photodiode
52. 43
which calculates the SPAD unit using the ratio of the intensity of the transmitted VIS and
NIR light (Konica Minolta, 1989). Measurements were collected from the uppermost leaf
with a fully exposed leaf collar, midway between the leaf edge and midrib (Peterson et al.,
1993). Readings were collected by measuring twenty plants from the middle two corn rows
in each N rate.
The active sensors used were the CC-210 (Holland Scientific, Lincoln, NE) and GS-
506 (NTech Industries, Ukiah, CA). Each sensor provides plant canopy reflectance
measurements that are used to calculate sensor indices (Table 1). The CC-210 uses a single
light emitting diode that emits light at the VIS 590 nm and NIR 880 nm wavelengths.
Reflected light from the canopy is captured by two silicon photodiodes on the sensor of
varying spectral ranges (400 - 680 nm and 800 - 1100 nm). Data from the sensor were
captured on a handheld computer (HP iPAQ Pocket PC) equipped with HGIS Professional
(Star Pal, Ft. Collins, CO) software. The sensor projects a rapidly pulsed light beam on the
canopy 52 cm wide, depending on the sensor to canopy distance. Reflectance data were
collected at a sample output rate of 6 Hz (Holland Scientific, 2004). The mean VIS and NIR
reflectance variables were calculated for each plot. The GS-506 (hardware rev. G-K,
software ver. 1.6.10) emits light at the VIS 560 nm and NIR 774 nm wavelengths. The GS-
506 sensor required periodic maintenance and calibration for optimum performance which
was performed by NTech Industries, Ukiah, CA in 2007 and 2008. Data from the sensor were
captured on a HP iPAQ Pocket PC equipped with NTech Capture software 2003 ver. 2.0.0.
The GS-506 sensor projects a constant light beam width of 37 cm, regardless of sensor to
canopy distance. Reflectance data were collected at a sample output rate of 100 Hz (NTech
53. 44
Industries, 2007). The canopy index values directly provided by the sensor, NDVI and simple
ratio index (SRI), were averaged for each plot. Raw reflectance variables (VIS and NIR)
were not provided by this sensor so a limited number of canopy indices were calculated
(Table 1). Each single sensor unit was mounted on a specialized sensing mast and carried by
hand through the middle of each N rate plot at a constant speed (1.3 m s–1
) and distance
above the canopy (60 - 90 cm) while collecting reflectance data. The active sensors were
positioned perpendicular to the row in the nadir position (0o
angle) between the middle two
rows of each N rate.
Sensing was conducted between 1000 - 1500 h during the day in June and July when
the corn growth stage across N fertilizer rates averaged approximately V12 (ranging from V9
- V14) (Table 2). Relative indices for each site-year N rate were calculated using the mean
observed sensor index value divided by the sensor index value from the highest N rate within
each site-year. Relative indices are indicated with a prefix “r”. Weather data used to calculate
cumulative base 10 growing degree days (GDD) from corn planting to sensing, and
cumulative rainfall between N applications to sensing were determined from the Iowa
Environmental Mesonet Network for each site-year (Shaw, 1988; Arritt and Herzmann,
2009).
Calculations and Statistics
Corn grain was harvested from the middle rows of each N rate with plot combines
and grain yield corrected to 155 g kg–1
moisture. Statistical analyses were conducted using
SAS software (SAS Institute, 2009). Corn grain yield response to applied N fertilizer was
determined for each site-year by using PROC GLM to determine if N rate or mean N rate
54. 45
contrasted to zero N was significantly different (P ≤ 0.10). The PROC NLIN procedure was
then used to fit regression models for each site-year identified as responsive to applied N.
The model statistically significant and possessing the highest coefficient of determination
(R2
) was selected. When R2
values were similar, the QP model was selected. The fitted
regression model was used to determine EONR for each site-year using the ratio of fertilizer
cost, 0.66 $ kg–1
N (0.30 $ lb–1
N), and corn grain price, 0.1179 $ kg–1
grain (3.00 $ bu–1
grain). The dEONR was calculated as the EONR minus applied N rates within each site-year
(Hawkins et al., 2007). The relationship between sensor index and dEONR was evaluated by
fitting a QP regression model using PROC NLIN, and the adjR2
and 95% lower confidence
limit (LCL) and upper confidence limit (UCL) regression parameters were calculated for
each canopy index model. The adjR2
was used as a goodness of fit statistic to determine the
best sensor index QP regression model. The LCL and UCL regression equations, compared
to the fitted regression model across relative sensor index values, were used to determine the
variability in sensor prescribed N rate for dEONR up to zero N.
Results and Discussion
Description of Sensing and Canopy Conditions
Across all years, a wide range of corn planting, N fertilizer application, and growing
conditions existed (Table 2). Corn growth stages at sensing ranged from V9 - V14, with an
average growth stage of V12 across the 62 site-years. Sensing N fertilizer rates across
multiple years of N response, different crop rotations, and N fertilization practices resulted in
a wide variety of corn canopy color and height. Corn development measured in GDD from
planting to sensing ranged from 483 - 652 GDD, averaging 571 GDD across all site-years.
55. 46
The number of days between N application and sensing also varied from as little as 31 d to as
many as 87 d. There was significantly greater cumulative rainfall (37 cm) between N
application and sensing in 2008 compared to 2006 and 2007 due to excessive spring rainfall
events. Some corn canopy conditions that negatively affected canopy sensing values and that
typically exist in Iowa’s corn production fields were also observed over the course of this
study. These included the presence of visible corn tassels during the V17 stage, reduced plant
population due to wet conditions, lodging due to wind damage, and leaf curling due to
moisture/heat stress. Active canopy sensing to adjust N rates in-season should be avoided
under these conditions.
The importance of diverse cropping conditions in which active sensor algorithm
development is conducted should not be understated. If active sensor technology is to be used
in production corn fields, the crop canopy should fit similar criteria to that with N algorithm
development and provide a reasonable timeframe where precision agriculture equipment can
apply N in-season. Timing of N stress sensing with active canopy sensors in this study and in
other recent work has focused near the V10 - V12 growth stages in corn (Solari et al., 2008).
This timing may provide the best balance for attempting to provide adequate fertilizer N to
growing corn plants when it is most needed, limit severity of lost yield potential due to N
stress, and to accurately estimate corn N stress. Sensor based in-season N application may be
more time consuming compared to pre-plant N application, with concerns related to
completing applications in a timely manner. During this study, corn growth rate and stage
development across planting dates suggest that if active sensors are used to apply N in-
season, the N application window that exists in Iowa is approximately 14 d in late June to
56. 47
early July.
Sensor Indices Relationship to Nitrogen Rate
Due to the improvement in model fit (reduction in sensor value variation) between
sensor readings and dEONR with relative indices, as has been found by others (Schepers et
al., 1992; Scharf et al., 2006; Hawkins et al., 2007), relative indices are used for N algorithm
development instead of direct index values (Table 3). The QP model had the highest non-
linear model fit statistics compared to other models and was statically significant in all cases
except for CC-210 VIS and relative VIS (rVIS) indices, in which, a QP model could not be
significantly fit at the P < 0.05 level.
The SPAD-502 was evaluated in conjunction with active canopy sensors. This was
intended to serve as a baseline comparison for active sensor indices with an established
sensor response to corn N stress measurement. Over all site-years, the rSPAD had one of the
highest goodness of fit statistics (adjR2
0.75) (Table 3). When compared to the adjR2
of active
sensor indices, rSPAD was equal to or more capable of measuring N stress. Figure 1 and
Table 4 show the QP regression model and equation parameters for the relationship between
rSPAD and dEONR. This relationship is similar to that found in previous Iowa research by
Hawkins et al. (2007). The rSPAD index has a similar model fit and relationship to dEONR
when compared to active sensor indices rMSRI, rSRI, and rGDVI from both the CC-210 and
GS-506 sensors.
The GS-506 sensor showed greater variation in the relationship between canopy
sensor indices and dEONR compared to the CC-210 sensor (Table 3). In 2006, the adjR2
of
rGNDVI, rSRI, rMSRI, and rGDVI CC-210 canopy indices (0.86 - 0.89) were greater than in
57. 48
2007 (0.69 - 0.73) and 2008 (0.72 - 0.78). Across all site-years, some canopy index QP
models had greater adjR2
values, thus developing a more accurate model and better
representing the relationship between the canopy index and dEONR. These were the rSRI,
rMSRI, and rGDVI with the GS-506 sensor and rGNDVI, rSRI, rMSRI, and rGDVI with the
CC-210 sensor.
Figure 1 and Table 4 show canopy index QP regression models and equation
parameters with the largest adjR2
representing the relationship between the relative canopy
index and dEONR for the SPAD-502 and both active sensors. Each of the canopy indices
have a similar index value at zero dEONR (0.99 - 1.00), and join point values (33.7 - 53.6 kg
N ha–1
). One exception is the lower CC-210 rGNDVI join point of 13.9 kg N ha–1
. In 6 of the
7 active canopy sensor indices, there were some site-year responses that exhibited greater
index values than the regression model plateau of 1.00 or 1.01 (Figure 1). This model effect
occurred near zero dEONR, and was minimized with the CC-210 rGNDVI index. The
canopy index value rate of change per kg N ha–1
(model slope) was greatest with the GS-506
and CC-210 rGDVI and the least with CC-210 rGNDVI. The larger model slope reflects the
greater range of relative index values across dEONR rates. That is, indices relating to canopy
biomass (rGNDVI) have a reduced range of relative values across deficit dEONR than
indices relating to canopy chlorophyll (rSRI, rMSRI, and rGDVI).
The difference in active sensor performance could be due to the different light source
wavelengths (VIS 590 nm vs. VIS 560 nm and NIR 880 nm vs. NIR 774 nm), average field
of view (44 vs. 37 cm), or light detection electronics in the CC-210 and GS-506 sensors,
respectively (Holland Scientific, 2004; NTech Industries, 2007). The rSRI, rMSRI, and
58. 49
rGDVI index regression models with the GS-506 sensor were quite similar, relative values
spanned a similar range, and each could equally serve to direct N rate application.
The individual NIR and VIS reflectance data provided from the CC-210 sensor were
used to calculate several additional canopy indices (Table 1). The equations used to calculate
canopy indices were originally developed using passive light sources, aerial or satellite
platforms, measuring a variety of canopy types (crop, grassland, or forest canopies) (Roujean
and Breon, 1995; Gitelson et al., 1996; Gitelson et al., 1999; Gong et al., 2003). In this study,
the same canopy indices were calculated from active light source sensors, at the canopy level,
measuring corn at mid-vegetative growth stages. This resulted in large difference between
canopy indices. Some of the indices provide equivalent relative corn N stress values,
distribution in index values, and high goodness of regression model fit (rMSRI, rSRI and
rGDVI), while other indices provided different and variable N stress values and poor
goodness of model fit [relative non-linear index (rNLI) and relative modified normalized
difference vegetative index (rMNDVI)] (Tables 3 and 4). The rGNDVI had similar
regression model goodness of fit compared to the rSRI, rGDVI, and rMSRI indices between
and across years, however, the rGNDVI had a reduced range of relative index values across
the range of deficit N. This may be due to the more subtle differences in canopy biomass
across varying level of N compared to canopy chlorophyll. Choice of a model to use as an N
rate algorithm could be flexible, with focus more on canopy biomass (rGNDVI) or canopy
chlorophyll (rSRI, rMSRI, or rGDVI).
Prescribed N Rate Variability of N Rate Algorithms
Figure 2 shows the prescribed N rate variability across deficit dEONR for rSPAD
59. 50
(SPAD-502), rSRI, rMSRI, rGDVI (GS-506), and rGNDVI, rSRI, rMSRI, and rGDVI (CC-
210). Overall, each sensor index had similar levels of variability at prescribed N rates
between 0 and 250 kg N ha-1
. Variability was the smallest when 50 - 200 kg N ha-1
is
prescribed by sensors. Greater uncertainty exists when 0 - 50 kg N ha-1
is predicted to be
applied according to the sensor algorithms. The CC-210 rGNDVI had the lowest prescribed
N rate variability compared to the other indices.
If active canopy sensors are to be used for determining needed in-season N
application rates, then assessing the level of accuracy for prediction models is needed. Our
results indicate that based on the 95% confidence limits for the QP regression models,
sensing slight N deficiencies (N algorithm prescribed in-season N application between 0 - 50
kg N ha–1
) produces greater variability in prescribed N rate and therefore would reduce the
effectiveness of using active sensor based N stress detection for incremental or fine-tuning N
application. There may be several reasons for this, including a reduced slope in all index
models as dEONR approaches 0 kg N ha–1
(adequate/excess N) and site-year variability
(adjR2
for all regression models ≤ 0.75) in the relationship between deficit N and sensor
index values. Some recent studies have also documented related issues in sensitivity with N
stress sensing using the SPAD-502 (Scharf et al., 2006; Hawkins et al., 2007; Ruiz Diaz et
al., 2008; Zhang et al., 2008) and CC-210 (Dellinger et al., 2008). Also, when corn is only
slightly N deficient, the leaf area index of the canopy is near its greatest level, and varies
only somewhat from corn with adequate N. It has been shown that GNDVI performs better
(undergoes less reflective saturation) when leaf area index is high (> 2.0 - 2.5) (Heege et al.,
2008). This may explain why the CC-210 rGNDVI demonstrated the lowest prescribed N