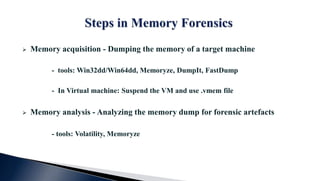
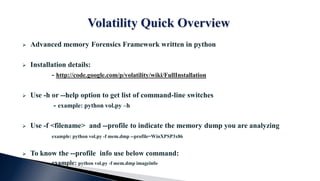
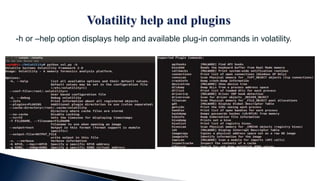
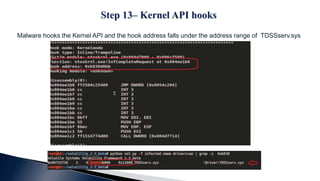
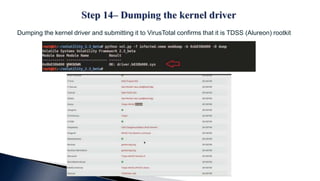
The document provides information about an advanced malware analysis training program. It begins with disclaimers about the content being provided "as is" and acknowledges those who supported the training. Biographical information is given about the trainer, Monnappa K A. An overview of memory forensics and the volatility framework is provided, along with examples of commands and plugins. The document outlines two malware analysis case studies demonstrating how volatility could be used to investigate memory dumps and detect malicious activity and rootkits.

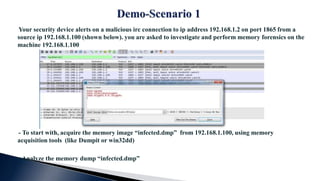


![Reversing & Malware Analysis Training Part 11 - Exploit Development [Advanced]](https://cdn.slidesharecdn.com/ss_thumbnails/reversingmalwareanalysistrainingpart11-exploitdevelopmentadvanced-120908121200-phpapp02-thumbnail.jpg?width=640&height=640&fit=bounds)