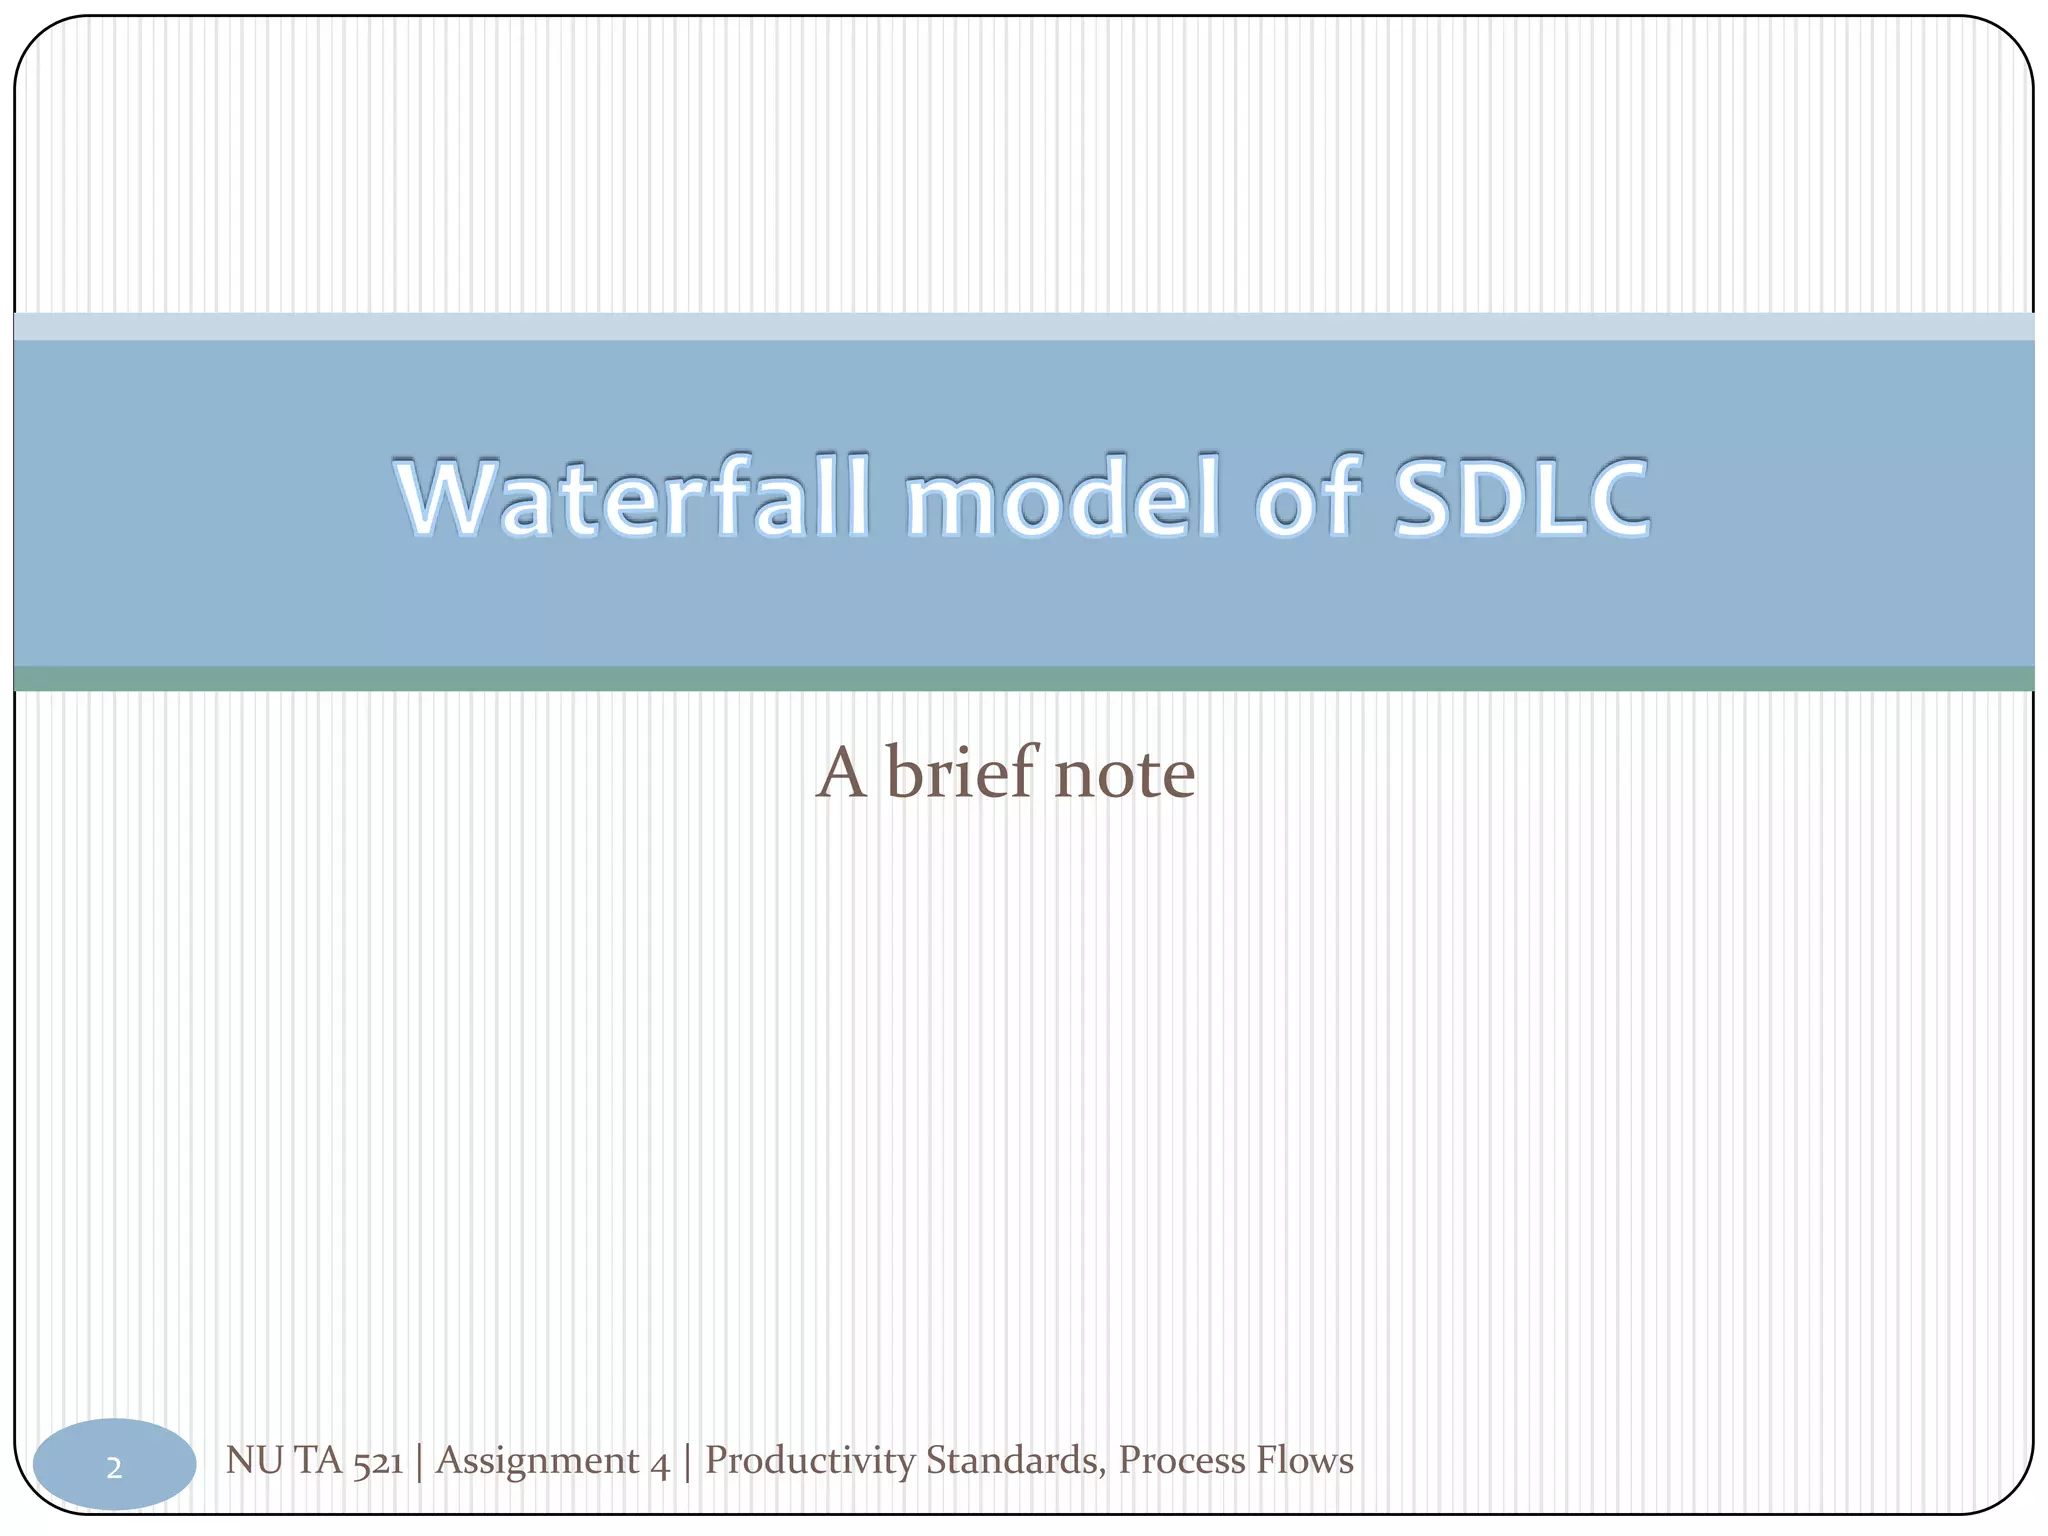
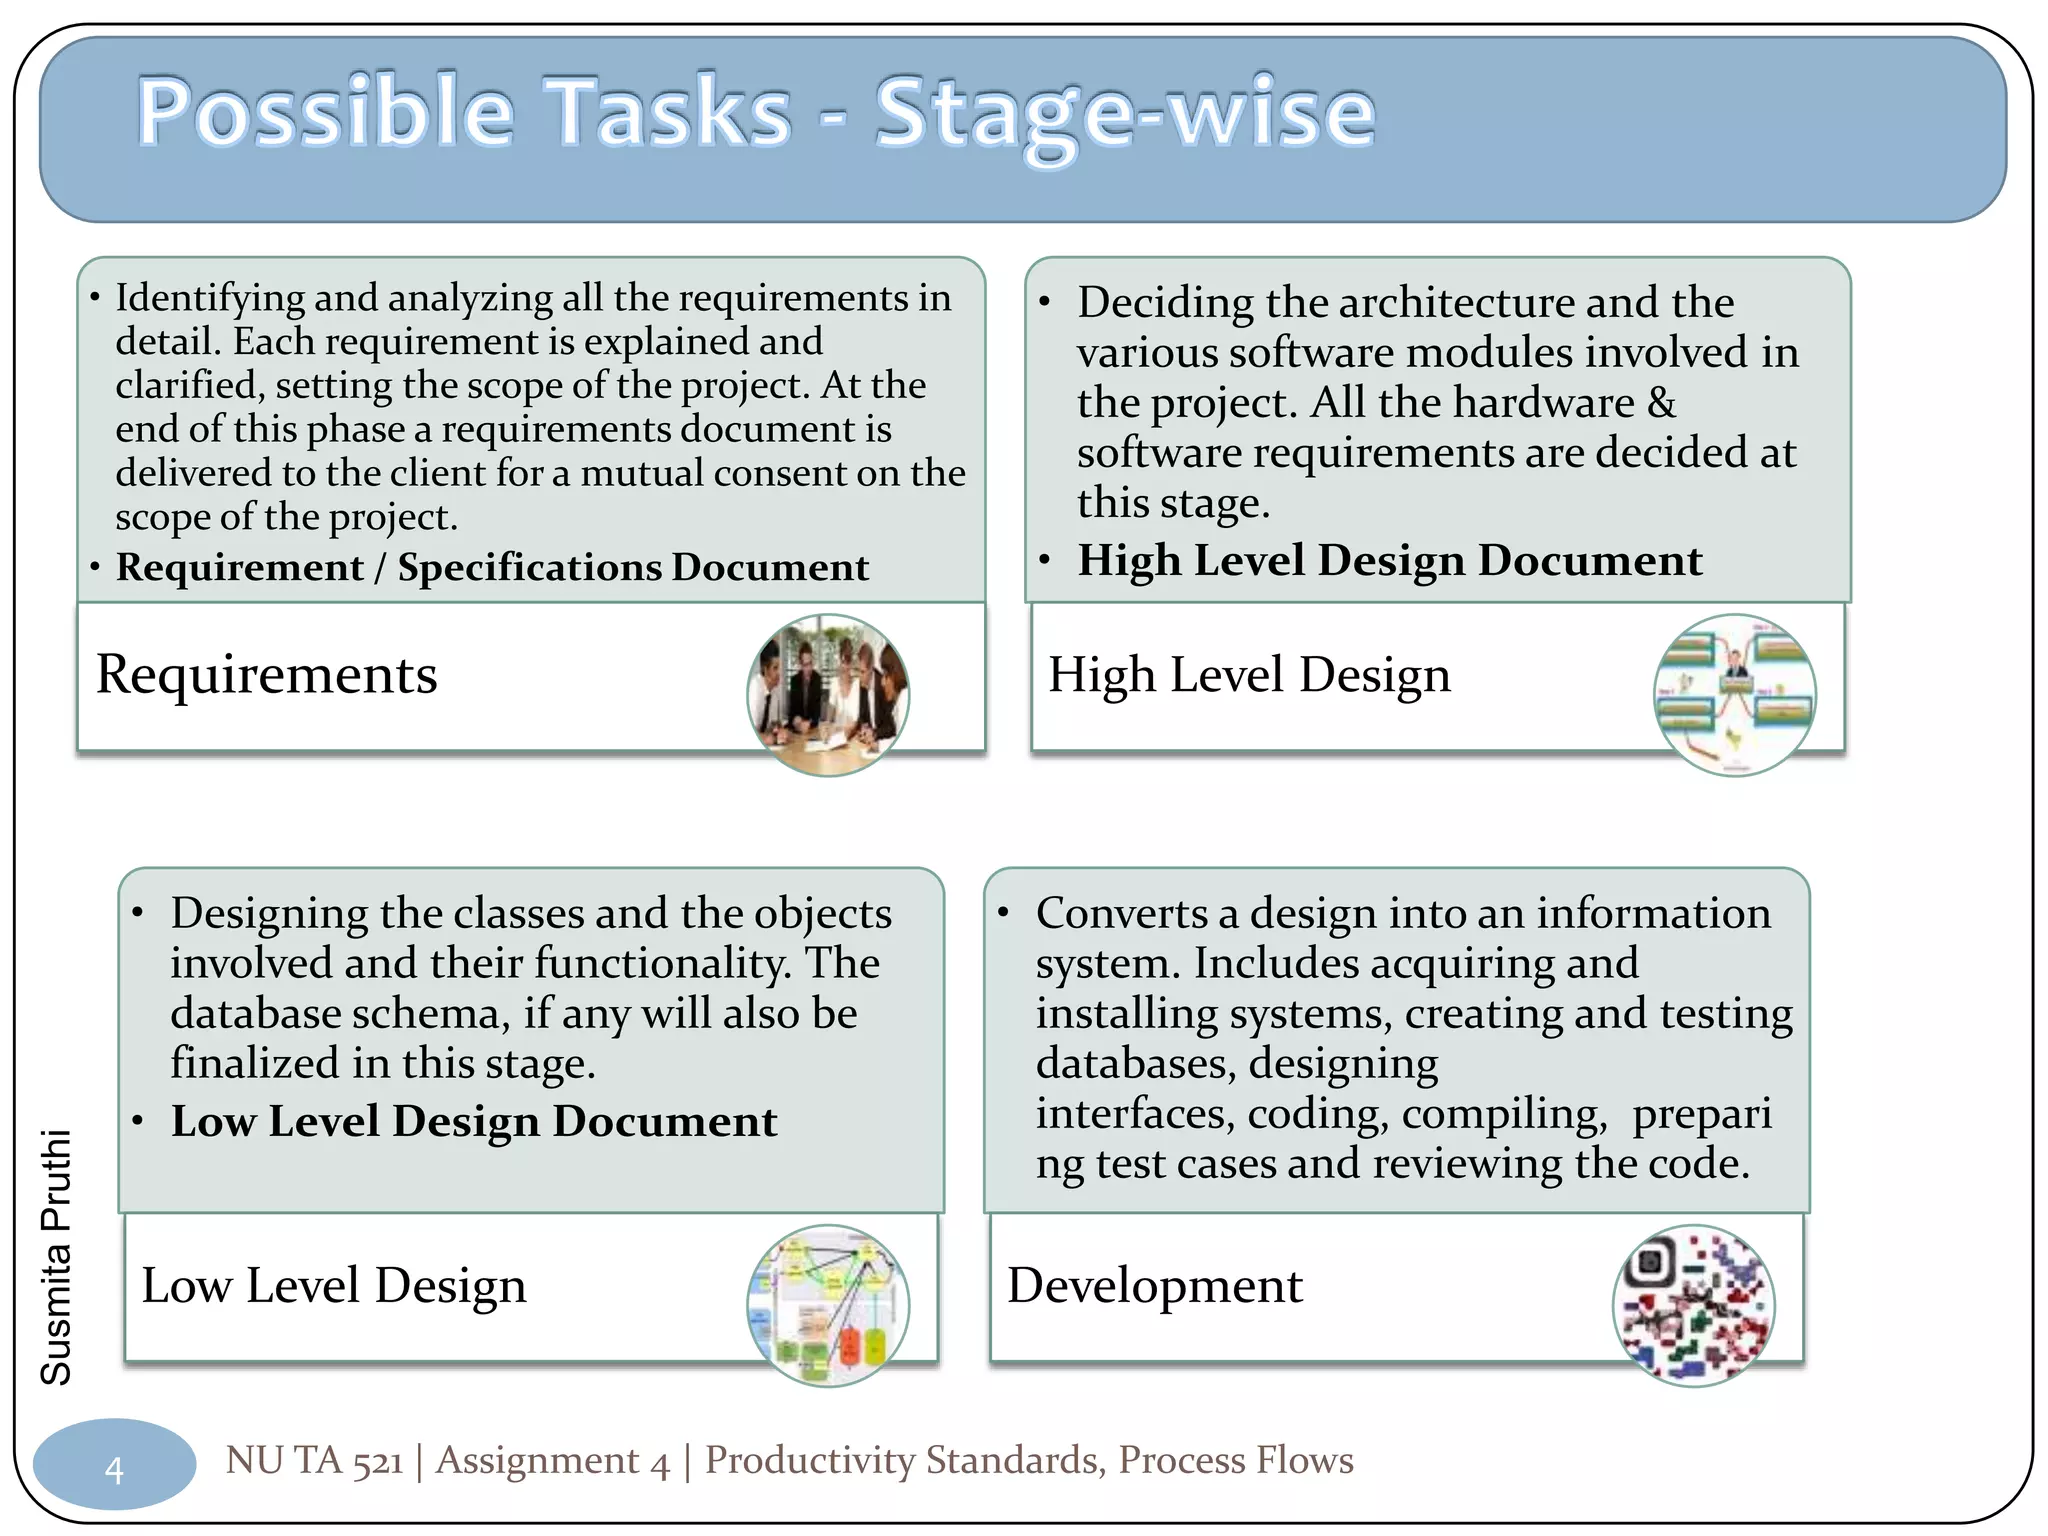
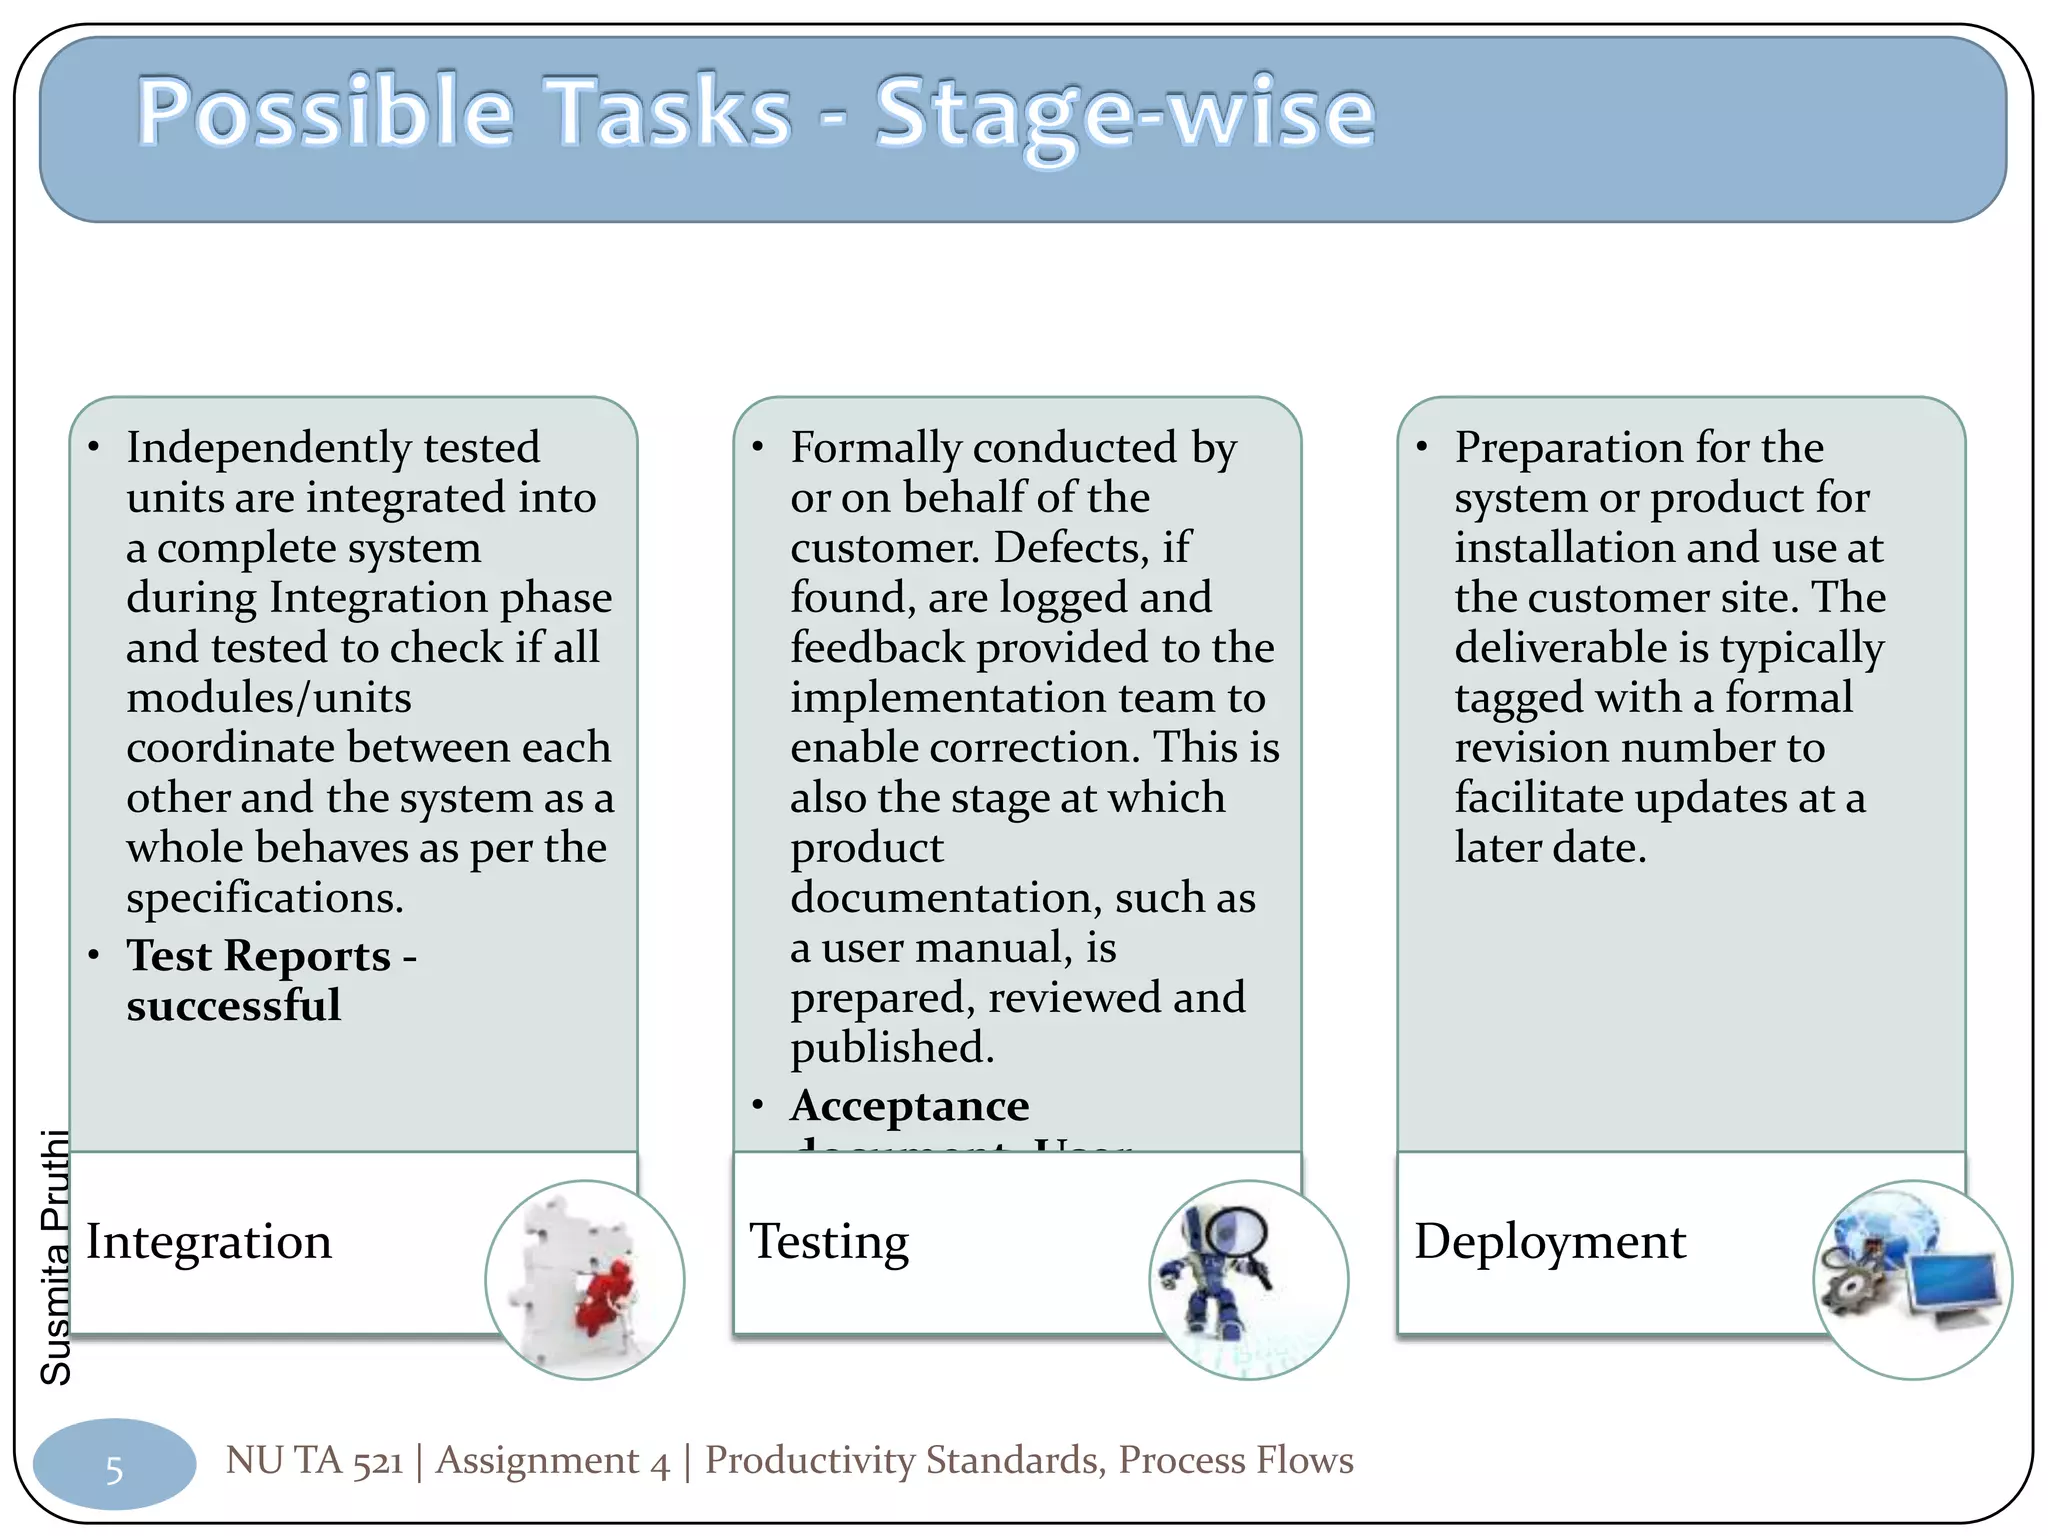
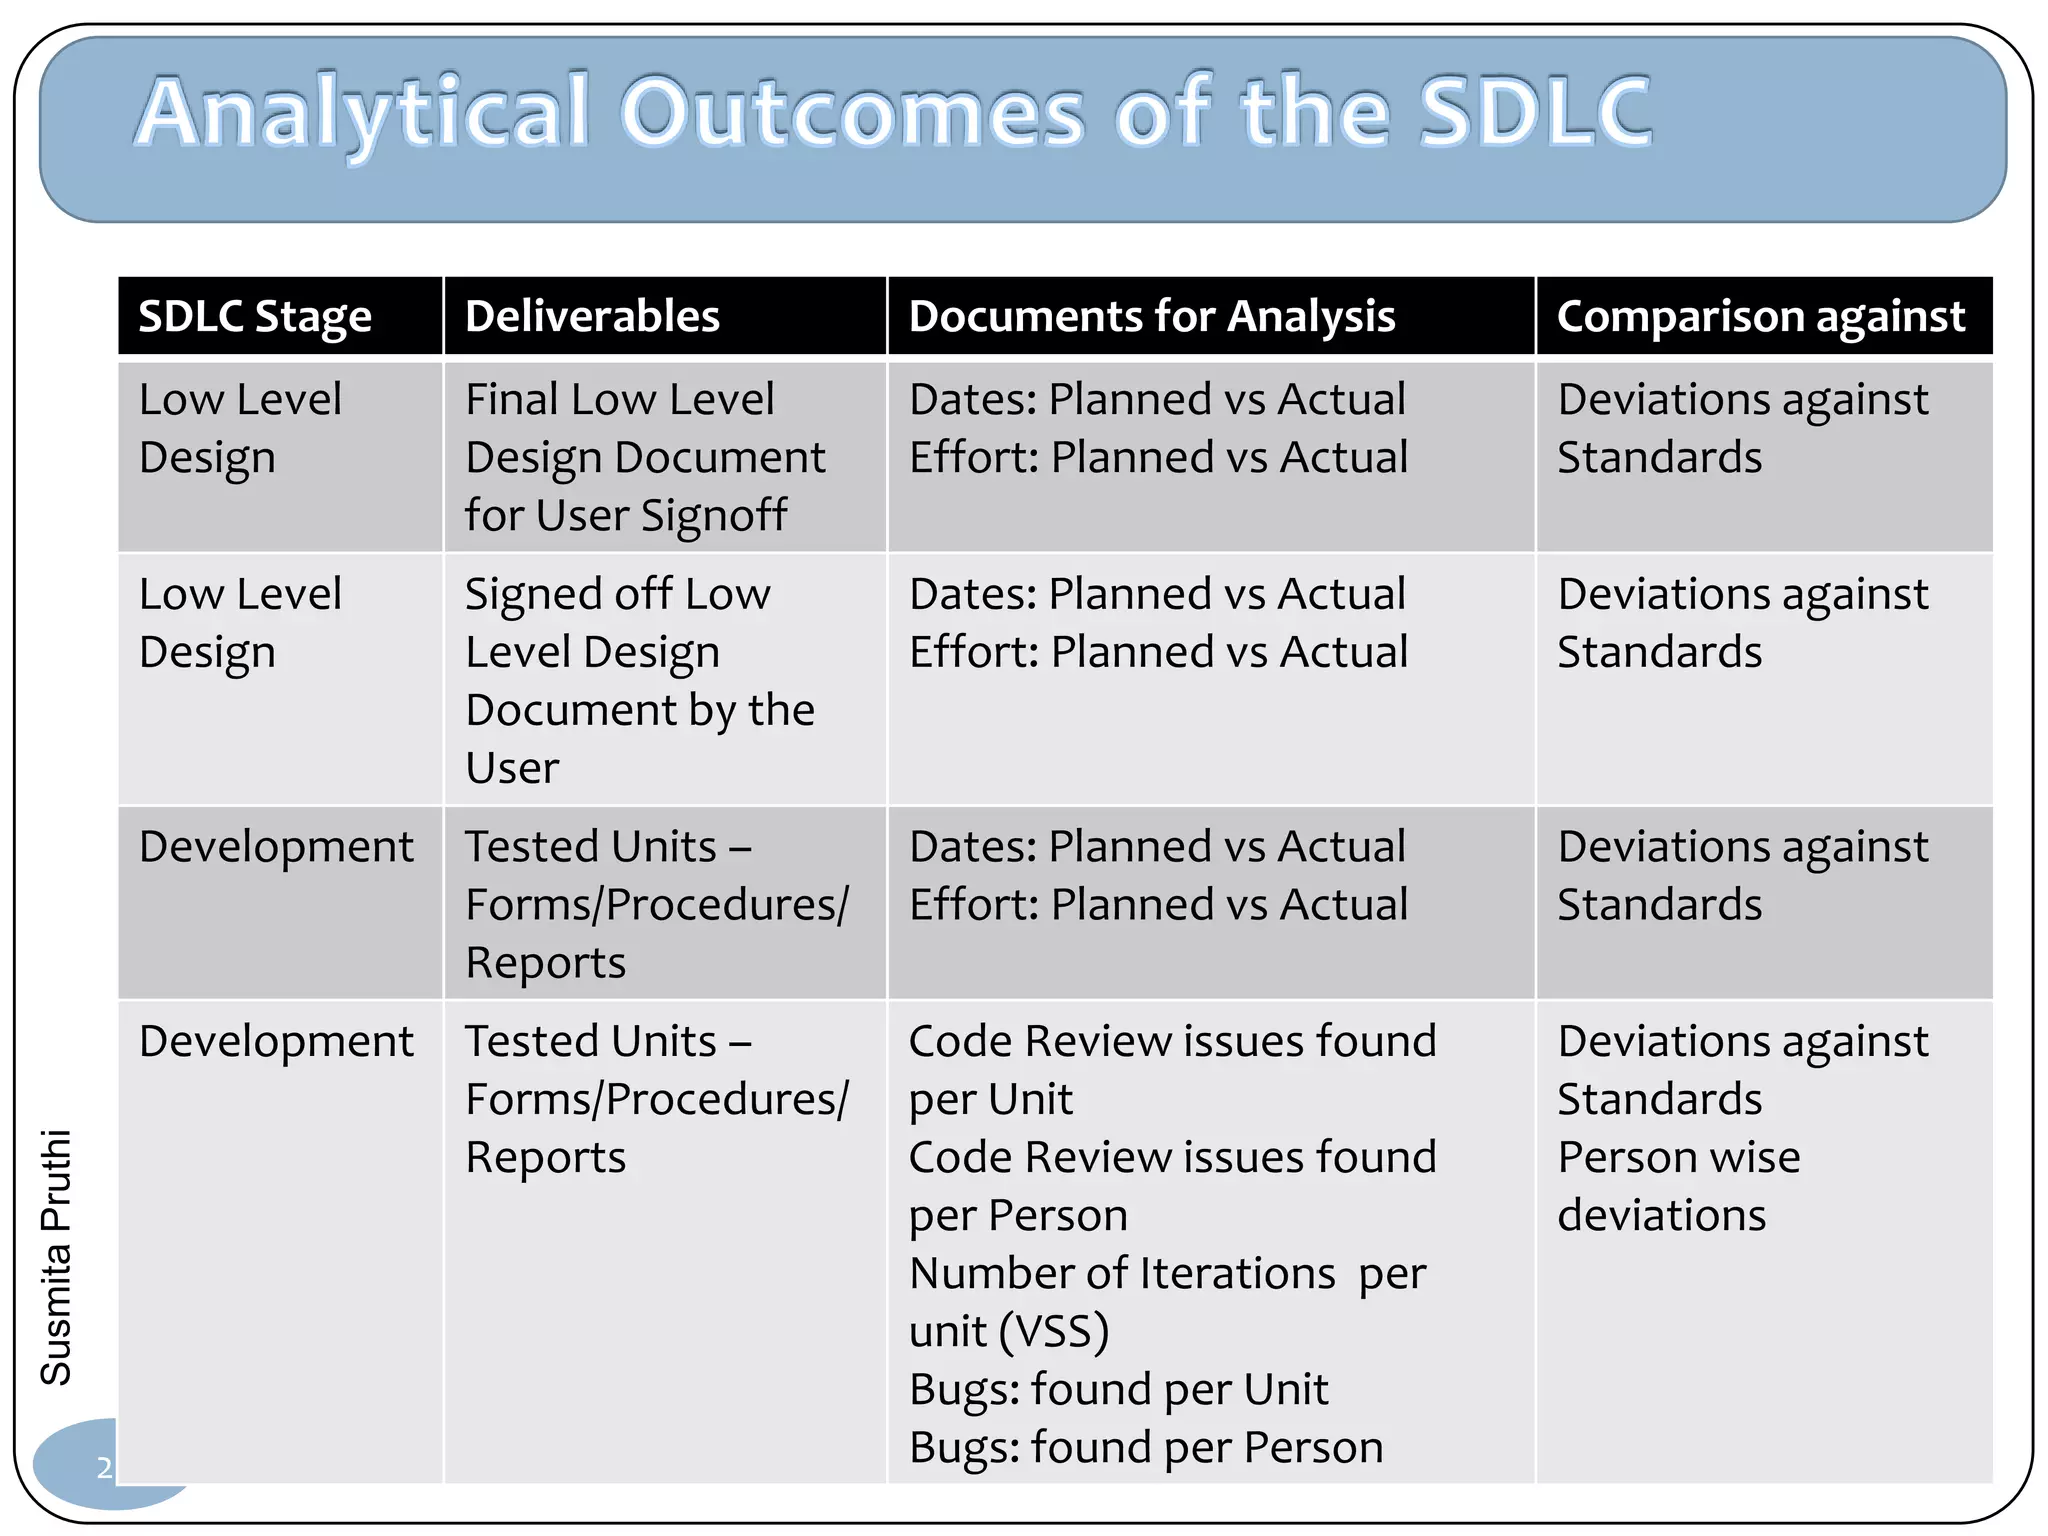
1. Using the Waterfall model:
1. Create a workflow SDLC using Data Flow Diagram
principles for a software development factory. Add
assumptions for your convenience. The workflow should
be optimized for Measurement.
2. Take this SDLC and add phases / stages to it to make it
reach the second level of productivity – Analysis.
Susmita Pruthi
1 NU TA 521 | Assignment 4 | Productivity Standards, Process Flows
2. A brief note
2 NU TA 521 | Assignment 4 | Productivity Standards, Process Flows
3. Requirements
Validation
High Level Design
Verification
Low Level Design
Verification
Development
Unit Testing
Integration
System Testing
Testing
Susmita Pruthi
Regression Testing
Deployment
Installation
3 NU TA 521 | Assignment 4 | Productivity Standards, Process Flows
4. • Identifying and analyzing all the requirements in • Deciding the architecture and the
detail. Each requirement is explained and various software modules involved in
clarified, setting the scope of the project. At the the project. All the hardware &
end of this phase a requirements document is
delivered to the client for a mutual consent on the software requirements are decided at
scope of the project. this stage.
• Requirement / Specifications Document • High Level Design Document
Requirements High Level Design
• Designing the classes and the objects • Converts a design into an information
involved and their functionality. The system. Includes acquiring and
database schema, if any will also be installing systems, creating and testing
finalized in this stage. databases, designing
• Low Level Design Document interfaces, coding, compiling, prepari
Susmita Pruthi
ng test cases and reviewing the code.
Low Level Design Development
4 NU TA 521 | Assignment 4 | Productivity Standards, Process Flows
5. • Independently tested • Formally conducted by • Preparation for the
units are integrated into or on behalf of the system or product for
a complete system customer. Defects, if installation and use at
during Integration phase found, are logged and the customer site. The
and tested to check if all feedback provided to the deliverable is typically
modules/units implementation team to tagged with a formal
coordinate between each enable correction. This is revision number to
other and the system as a also the stage at which facilitate updates at a
whole behaves as per the product later date.
specifications. documentation, such as
• Test Reports - a user manual, is
successful prepared, reviewed and
published.
• Acceptance
Susmita Pruthi
document, User
Manual
Integration Testing Deployment
5 NU TA 521 | Assignment 4 | Productivity Standards, Process Flows
6. Deliverable: A document, piece of software, or piece of hardware to be
delivered to user (buyer, customer, client) as part of contract; the secret, for
large jobs, is to have intermediate deliverables - so that bad news (or good) is
known early enough to take corrective action. Analogy: Continuous
assessment for university courses; inspection of a house during building.
Milestone: One of a number of predefined points during the project which
mark completion of part of the work or acceptance of a deliverable by the
customer; can mark time at which go-ahead to a next phase is decided; also
progress payment points. Analogy: Passing of years exams and assessments;
laying of foundations of a house.
Input: Information, data, documentation etc. supplied by user to developer
for use during project; e.g. sample employee data for use as test data.
Output : Any product of a phase.
Review: Inspection of a deliverable (in most significant cases involving user)
Susmita Pruthi
to see if it meets requirements; success may mark the reaching of a milestone.
Baseline: Current agreed plan, specification, or design or system - usually
reviewed; cannot be changed, except by express agreement of all parties.
Baseline often corresponds to a deliverable.
6 NU TA 521 | Assignment 4 | Productivity Standards, Process Flows
7. 7 NU TA 521 | Assignment 4 | Productivity Standards, Process Flows
8. Name of the System: Order Approval System
End users:
Sales TM
Logistics TM
Zonal Heads
Business Unit Head
Requirements: System should provide a platform to
Login new orders by the Sales TM based on the available products
The system should identify the EBIT deviation % on the basis of product
wise EBIT rules
On the basis of the EBIT deviation percentage, the order to be slotted as
‘Red’, ‘Orange’ or ‘Green’
The Order requirement to be validated by the logistics TM basis the
product and feasability
Susmita Pruthi
Product commitment versus the promise to the customer
Bill of Material – Units, Prices, Configurations
Prices for variable products
The order must move from Logistics TM to Zonal Head for approval.
8 NU TA 521 | Assignment 4 | Productivity Standards, Process Flows
9. The system to allow the approval of the order basis the EBIT Deviation
Approval matrix –
‘Red’ – Not Allow
‘Orange’ – BU Head approval
‘Green’ – ZH approval
Any rejection for correction at any level must be reverted to the Sales TM
to incorporate.
In case of any change in the order, the order must pass through the
approval chain
Change in BOM: Sales TM Logistics TM ZH BU Head
Any other change: Sales TM ZH BU Head
Susmita Pruthi
9 NU TA 521 | Assignment 4 | Productivity Standards, Process Flows
10. Response: Update info
Response
EBIT Request Request
New Order EBIT BOM
SP Logistics
Request Entry Calculated Validation
Lead Info
Product Info Request
Sales Products for
Funnel BOM data approval
Request data, EBIT
for Lead data Response for
clarifications
ZH
Order EBIT
approved Request for processing
Deviation approval
Matrix data EBIT
Susmita Pruthi
status
Generate Process
EBIT Report Approving Authority data Approval
Dynamic Report Approving Order
Authority Approved
10 NU TA 521 | Assignment 4 | Productivity Standards, Process Flows
12. Requirements Problem Description/Definition
Validation System Analysis
High Level Design Logical Design
Verification
Physical Design
Low Level Design
Dependencies Verification
Procedures
Development Programming / Unit Testing
Unit Testing
System Reliability Integration
System Testing
Testing Load Testing
Susmita Pruthi
Regression Testing Integration Testing
Systems Testing
Live Implementation Deployment
Maintenance Installation
12 NU TA 521 | Assignment 4 | Productivity Standards, Process Flows
13. Measuring the production level of an entity intails the
following processes:
data acquisition,
data summary
comparison.
In obtaining data, documenting the activities of an entity
helps in creating tangible reports of certain group
transactions.
Documents and files can be extremely valuable, particularly
during the performance evaluation.
Susmita Pruthi
13 NU TA 521 | Assignment 4 | Productivity Standards, Process Flows
14. SDLC Stage Deliverables Measure against Milestone
Across the SDLC Time Sheet Effort: Stage-wise Planned
vs Actual
Requirement Final Requirement Document for User Dates: Planned vs Actual
Signoff Effort: Planned vs Actual
Requirement Signed off Requirement Document by Dates: Planned vs Actual
the User Effort: Planned vs Actual
High Level Design Final High Level Design Document for Dates: Planned vs Actual
User Signoff Effort: Planned vs Actual
High Level Design Signed off High Level Design Dates: Planned vs Actual
Document by the User Effort: Planned vs Actual
Low Level Design Final Low Level Design Document for Dates: Planned vs Actual
User Signoff Effort: Planned vs Actual
Susmita Pruthi
Low Level Design Signed off Low Level Design Document Dates: Planned vs Actual
by the User Effort: Planned vs Actual
14 NU TA 521 | Assignment 4 | Productivity Standards, Process Flows
15. SDLC Stage Deliverable Measure against Milestones
Development Tested Units – Dates: Planned vs Actual
Forms/Procedures/Reports Effort: Planned vs Actual
Development Tested Units – Code Review issues found per Unit
Forms/Procedures/Reports Code Review issues found per Person
Number of Iterations per unit (VSS)
Bugs: found per Unit
Bugs: found per Person
Integration Tested System Dates: Planned vs Actual
Testing Tested Database Effort: Planned vs Actual
Integration Installation Report Iteration for achieving the successful
Testing User Manual Installation
User Acceptance Report
Susmita Pruthi
Deployment / Successful Installation in field Dates: Planned vs Actual
Release Effort: Planned vs Actual
15 NU TA 521 | Assignment 4 | Productivity Standards, Process Flows
16. Response: Feasibility Report
User Problem Problem Project Problem
Definition Statement TM Analysis Feasibility
Request
Study
System
Analysis
Is
Feasible?
Yes No
Requirements Input for High Level Design
Document
Update from High Level Design
Susmita Pruthi
Time Sheet
16 NU TA 521 | Assignment 4 | Productivity Standards, Process Flows
17. Requirements Project High Level
Document TM System Design
User Clarifications
High Level
System Design
Completion
Update To Requirements Document
Changes
Yes No
due to High Level
clarificati Design
ons? Document
Update From Low Input for Low
Level Design Level Design
Susmita Pruthi
Document
Time Sheet
17 NU TA 521 | Assignment 4 | Productivity Standards, Process Flows
18. High Level Project Low Level
Design TM System Design
Document
User Clarifications
Low Level
System Design
Completion
Update To High Level Changes
Yes No
Design Document due to Low Level
clarificati Design
ons? Document
Update From Input
Development Development
Susmita Pruthi
Time Sheet
18 NU TA 521 | Assignment 4 | Productivity Standards, Process Flows
19. Low Level Project Database
Design TMs Creation
Time
Document Sheet
Clarifications
Form/Procedure/R
User eport Creation
Changes
Yes No
due to Project
clarification Clarifications TMs
Update To Low Level
s?
Design Document User
Yes
Changes?
No Form /
Susmita Pruthi
Report /
Unit Testing Fix Bugs Procedure
Bug Release
Report Unit
19 NU TA 521 | Assignment 4 | Productivity Standards, Process Flows
20. Other development Stages also follow similar data flow.
Refer Slide ‘Measurable Outcomes of the SDLC’ for details of
these stages
Susmita Pruthi
20 NU TA 521 | Assignment 4 | Productivity Standards, Process Flows
21. Optimised for Analysis
NU TA 521 | Assignment 4 | Productivity
21 Standards, Process Flows
22. Productivity analysis refers to the process of differentiating
the actual data over the estimated data of output and input
measurement and presentation.
Productivity is the ratio of the output production per unit of
input.
Factors affecting the productivity of entities may be:
labor force
Product
Quality
Process
Capacity
and external influences
Susmita Pruthi
Productivity analysis may be seen as an evaluative activity of
the performance of an entity.
22 NU TA 521 | Assignment 4 | Productivity Standards, Process Flows
23. It involves
conducting detailed comparisons on production reports
checking of each source used in the creation of the report.
Documents/ Data that are generally analysed
Budgeted and actual time sheets
Resource requisition forms
Purchase orders, and Material withdrawal slips
Sometimes random examination of the workplace are also
undertaken.
Susmita Pruthi
23 NU TA 521 | Assignment 4 | Productivity Standards, Process Flows
24. SDLC Stage Deliverables Documents for Analysis Comparison against
Across the Time Sheet Effort: Stage-wise Deviations against
SDLC Dates: Planned vs Actual Standards
Requirement Final Requirement Dates: Planned vs Actual Deviations against
Document for User Effort: Planned vs Actual Standards
Signoff
Requirement Signed off Dates: Planned vs Actual Deviations against
Requirement Effort: Planned vs Actual Standards
Document by the User
High Level Final High Level Design Dates: Planned vs Actual Deviations against
Design Document for User Effort: Planned vs Actual Standards
Signoff
High Level Signed off High Level Dates: Planned vs Actual Deviations against
Susmita Pruthi
Design Design Document by Effort: Planned vs Actual Standards
the User
Higher Productivity Levels can also be identified and analysed for dependency criteria
24 NU TA 521 | Assignment 4 | Productivity Standards, Process Flows
25. SDLC Stage Deliverables Documents for Analysis Comparison against
Low Level Final Low Level Dates: Planned vs Actual Deviations against
Design Design Document Effort: Planned vs Actual Standards
for User Signoff
Low Level Signed off Low Dates: Planned vs Actual Deviations against
Design Level Design Effort: Planned vs Actual Standards
Document by the
User
Development Tested Units – Dates: Planned vs Actual Deviations against
Forms/Procedures/ Effort: Planned vs Actual Standards
Reports
Development Tested Units – Code Review issues found Deviations against
Forms/Procedures/ per Unit Standards
Susmita Pruthi
Reports Code Review issues found Person wise
per Person deviations
Number of Iterations per
unit (VSS)
Bugs: found per Unit
25 NU TA 521 | Assignment 4 | Productivity Standards, ProcessPerson
Bugs: found per Flows
26. SDLC Stage Deliverables Documents for Analysis Comparison against
Integration Tested System Dates: Planned vs Actual Deviations against
Testing Tested Database Effort: Planned vs Actual Standards
Integration Installation Report Iteration for achieving Deviations against
Testing User Manual the successful Installation Standards
User Acceptance
Report
Deployment / Successful Installation Dates: Planned vs Actual Deviations against
Release in field Effort: Planned vs Actual Standards
Susmita Pruthi
Higher Productivity Levels can also be identified and analysed for dependency criteria
26 NU TA 521 | Assignment 4 | Productivity Standards, Process Flows
27. Requirements
Validation
High Level Design
Verification
Validate the Design using a Prototype:
• Sets internal benchmarks for coding
Low Level Design standards, GUI, Report Formats etc
Verification
•Give a preview to user on what to
expect especially when there is an
Prototype
Validation inherent process change
•Get a sign off from the user
Development
Unit Testing
Integration
System Testing
Testing
Susmita Pruthi
Regression Testing
Deployment
Installation
27 NU TA 521 | Assignment 4 | Productivity Standards, Process Flows
Editor's Notes
http://www.pro-sky.com/requirement-analysis.html
http://www.onestoptesting.com/sdlc-models/waterfall-model/-------------------------------------------------------------------------------------------------------------------------------------This is the most common and classic of life cycle models, also referred to as a linear-sequential life cycle model. It is very simple to understand and use. In a waterfall model, each phase must be completed in its entirety before the next phase can begin. At the end of each phase, a review takes place to determine if the project is on the right path and whether or not to continue or discard the project. Unlike what I mentioned in the general model, phases do not overlap in a waterfall model.Waterfall model of SDLCAdvantagesSimple and easy to use.Easy to manage due to the rigidity of the model – each phase has specific deliverables and a review process.Phases are processed and completed one at a time.Works well for smaller projects where requirements are very well understood.DisadvantagesAdjusting scope during the life cycle can kill a projectNo working software is produced until late during the life cycle.High amounts of risk and uncertainty.Poor model for complex and object-oriented projects.Poor model for long and ongoing projects.Poor model where requirements are at a moderate to high risk of changing.