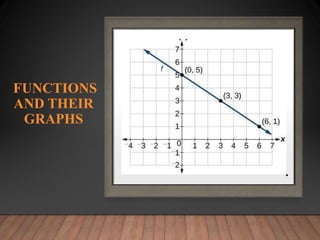
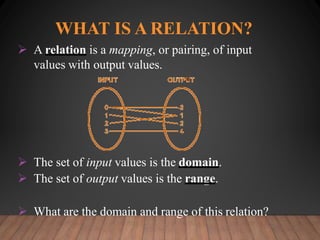
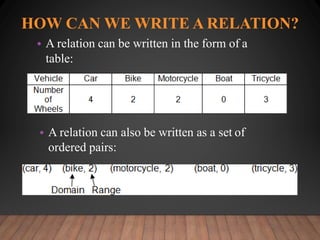
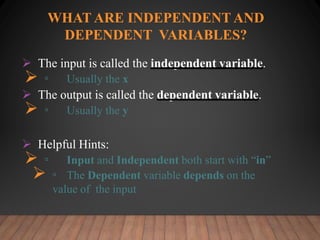
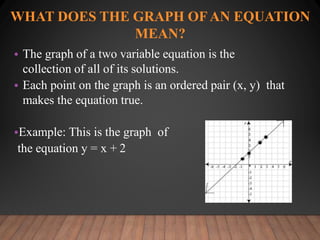
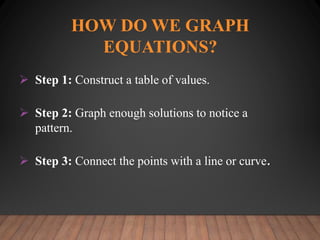
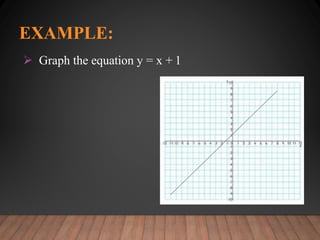
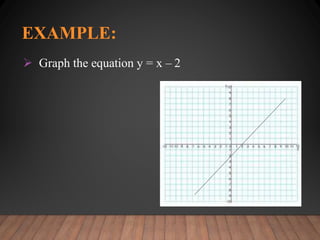
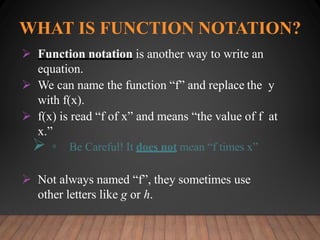
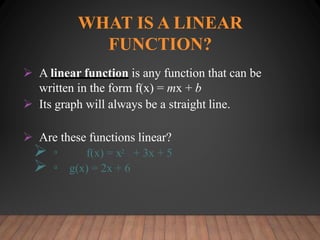
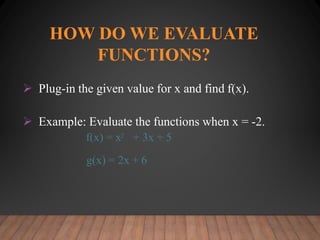
FUNCTIONS AND THEIR
GRAPHS
Submitted by: Group H
SYED NOOR UL HASSAN SUBHANI(20021519-015)
MUHAMMAD ABDULLAH HASHMI(20021519-016)
SAAD JAVED(20021519-017)
WALEED ZAHID(20021519-020)
USAMA ZAFAR(20021519-092)
SHEHRYAR TARIQ BUTT(20021519-108)
---------------------------
Submitted to: Ms. HABIBA ISHAQ
UNIVERSITY OF GUJRAT
FUNCTIONS
AND THEIR
GRAPHS
WHAT IS A RELATION?
 A relation is a mapping, or pairing, of input
values with output values.
 The set of input values is the domain.
 The set of output values is the range.
 What are the domain and range of this relation?
HOW CAN WE WRITE A RELATION?
• A relation can be written in the form of a
table:
• A relation can also be written as a set of
ordered pairs:
HOW DO WE WRITE A RELATION WITH
NUMBERS?
 Set of ordered pairs with form (x, y).
 The x-coordinate is the input and the y-
coordinate is the output.
 Example:
{ (0, 1) , (5, 2) , (-3, 9) }
 { } is the symbol for a “set”
 What is the domain and range of this relation?
HOW DO WE GRAPH A RELATION?
 To graph a relation, plot each of its ordered
pairs on a coordinate plane.
 Graph the relation:
{ (0, 1) , (5, 2) , (-3, 9) }
Remember:
The x comes first – moves
right or left.
The y comes second –
moves up or down.
Positive means to the
right or up.
Negative means to the
left or down.
HOW DO WE GRAPH A RELATION?
(CON’T)
 Graph the relation and identify the domain
and range.
{ (-1,2), (2, 5), (1, 3), (8, 2) }
WHAT IS A FUNCTION?
 A function ‘f’ from a set D to a set Y is a rule that assigns
a unique (single) element f(x) E Y to each element x E D.
 A function is a special type of relation that has exactly
one output for each input.
 If any input maps to more than one output, then it is not
a function.
 Is this a function? Why or why not?
WHICH OF THESE RELATIONS ARE
FUNCTIONS?
• { (3,4), (4,5), (6,7), (3,9) }
X 5 7 9 2 6
y 1 6 2 8 4
USING THE VERTICAL LINE TEST
 A relation is a function if and only if no
vertical line crosses the graph at more
than one point.
 This is not a function because the vertical
line crosses two points.
USING THE VERTICAL LINE TEST
(CON’T)
 Write the domain and range.
 Is this a function?
 { (2,4) (3,6) (4,4) (5, 10) }
WHAT IS A SOLUTION OF AN
EQUATION?
• Many functions can be written as an equation, such
as y = 2x – 7.
• A solution of an equation is an ordered pair (x,
y) that makes the equation true.
• Example: Is (2, -3) a solution of y = 2x – 7 ?
WHAT ARE INDEPENDENT AND
DEPENDENT VARIABLES?
 The input is called the independent variable.
 ▫ Usually the x
 The output is called the dependent variable.
 ▫ Usually the y
 Helpful Hints:
 ▫ Input and Independent both start with “in”
 ▫ The Dependent variable depends on the
value of the input
WHAT DOES THE GRAPH OFAN EQUATION
MEAN?
• The graph of a two variable equation is the
collection of all of its solutions.
• Each point on the graph is an ordered pair (x, y) that
makes the equation true.
•Example: This is the graph of
the equation y = x + 2
HOW DO WE GRAPH
EQUATIONS?
 Step 1: Construct a table of values.
 Step 2: Graph enough solutions to notice a
pattern.
 Step 3: Connect the points with a line or curve.
EXAMPLE:
 Graph the equation y = x + 1
EXAMPLE:
 Graph the equation y = x – 2
WHAT IS FUNCTION NOTATION?
 Function notation is another way to write an
equation.
 We can name the function “f” and replace the y
with f(x).
 f(x) is read “f of x” and means “the value of f at
x.”
 ▫ Be Careful! It does not mean “f times x”
 Not always named “f”, they sometimes use
other letters like g or h.
WHAT IS A LINEAR
FUNCTION?
 A linear function is any function that can be
written in the form f(x) = mx + b
 Its graph will always be a straight line.
 Are these functions linear?
 ▫ f(x) = x2 + 3x + 5
 ▫ g(x) = 2x + 6
HOW DO WE EVALUATE
FUNCTIONS?
 Plug-in the given value for x and find f(x).
 Example: Evaluate the functions when x = -2.
f(x) = x2 + 3x + 5
g(x) = 2x + 6
HOW DO WE EVALUATE
FUNCTIONS?(CON’T)
 Decide if the function is linear. Then evaluate the
function when x = 3.
 g(x) = -3x + 4
Stop?
HOW DO WE FIND THE
DOMAIN AND RANGE?
 The domain is all of the input values that
make sense.
 ▫ Sometimes “all real numbers”
 ▫ For real-life problems may be limited
 The range is the set of all outputs.
EXAMPLE:
 In Oak Park, houses will be from 1450 to 2100
square feet. The cost C of building is $75 per
square foot and can be modeled by C = 75f, where
f is the number of square feet.
 Give the domain and range of C(f).

Group H Presentation.pptx

  • 2.
    FUNCTIONS AND THEIR GRAPHS Submittedby: Group H SYED NOOR UL HASSAN SUBHANI(20021519-015) MUHAMMAD ABDULLAH HASHMI(20021519-016) SAAD JAVED(20021519-017) WALEED ZAHID(20021519-020) USAMA ZAFAR(20021519-092) SHEHRYAR TARIQ BUTT(20021519-108) --------------------------- Submitted to: Ms. HABIBA ISHAQ UNIVERSITY OF GUJRAT
  • 3.
  • 4.
    WHAT IS ARELATION?  A relation is a mapping, or pairing, of input values with output values.  The set of input values is the domain.  The set of output values is the range.  What are the domain and range of this relation?
  • 5.
    HOW CAN WEWRITE A RELATION? • A relation can be written in the form of a table: • A relation can also be written as a set of ordered pairs:
  • 6.
    HOW DO WEWRITE A RELATION WITH NUMBERS?  Set of ordered pairs with form (x, y).  The x-coordinate is the input and the y- coordinate is the output.  Example: { (0, 1) , (5, 2) , (-3, 9) }  { } is the symbol for a “set”  What is the domain and range of this relation?
  • 7.
    HOW DO WEGRAPH A RELATION?  To graph a relation, plot each of its ordered pairs on a coordinate plane.  Graph the relation: { (0, 1) , (5, 2) , (-3, 9) } Remember: The x comes first – moves right or left. The y comes second – moves up or down. Positive means to the right or up. Negative means to the left or down.
  • 8.
    HOW DO WEGRAPH A RELATION? (CON’T)  Graph the relation and identify the domain and range. { (-1,2), (2, 5), (1, 3), (8, 2) }
  • 9.
    WHAT IS AFUNCTION?  A function ‘f’ from a set D to a set Y is a rule that assigns a unique (single) element f(x) E Y to each element x E D.  A function is a special type of relation that has exactly one output for each input.  If any input maps to more than one output, then it is not a function.  Is this a function? Why or why not?
  • 10.
    WHICH OF THESERELATIONS ARE FUNCTIONS? • { (3,4), (4,5), (6,7), (3,9) } X 5 7 9 2 6 y 1 6 2 8 4
  • 11.
    USING THE VERTICALLINE TEST  A relation is a function if and only if no vertical line crosses the graph at more than one point.  This is not a function because the vertical line crosses two points.
  • 12.
    USING THE VERTICALLINE TEST (CON’T)  Write the domain and range.  Is this a function?  { (2,4) (3,6) (4,4) (5, 10) }
  • 13.
    WHAT IS ASOLUTION OF AN EQUATION? • Many functions can be written as an equation, such as y = 2x – 7. • A solution of an equation is an ordered pair (x, y) that makes the equation true. • Example: Is (2, -3) a solution of y = 2x – 7 ?
  • 14.
    WHAT ARE INDEPENDENTAND DEPENDENT VARIABLES?  The input is called the independent variable.  ▫ Usually the x  The output is called the dependent variable.  ▫ Usually the y  Helpful Hints:  ▫ Input and Independent both start with “in”  ▫ The Dependent variable depends on the value of the input
  • 15.
    WHAT DOES THEGRAPH OFAN EQUATION MEAN? • The graph of a two variable equation is the collection of all of its solutions. • Each point on the graph is an ordered pair (x, y) that makes the equation true. •Example: This is the graph of the equation y = x + 2
  • 16.
    HOW DO WEGRAPH EQUATIONS?  Step 1: Construct a table of values.  Step 2: Graph enough solutions to notice a pattern.  Step 3: Connect the points with a line or curve.
  • 17.
    EXAMPLE:  Graph theequation y = x + 1
  • 18.
    EXAMPLE:  Graph theequation y = x – 2
  • 19.
    WHAT IS FUNCTIONNOTATION?  Function notation is another way to write an equation.  We can name the function “f” and replace the y with f(x).  f(x) is read “f of x” and means “the value of f at x.”  ▫ Be Careful! It does not mean “f times x”  Not always named “f”, they sometimes use other letters like g or h.
  • 20.
    WHAT IS ALINEAR FUNCTION?  A linear function is any function that can be written in the form f(x) = mx + b  Its graph will always be a straight line.  Are these functions linear?  ▫ f(x) = x2 + 3x + 5  ▫ g(x) = 2x + 6
  • 21.
    HOW DO WEEVALUATE FUNCTIONS?  Plug-in the given value for x and find f(x).  Example: Evaluate the functions when x = -2. f(x) = x2 + 3x + 5 g(x) = 2x + 6
  • 22.
    HOW DO WEEVALUATE FUNCTIONS?(CON’T)  Decide if the function is linear. Then evaluate the function when x = 3.  g(x) = -3x + 4 Stop?
  • 23.
    HOW DO WEFIND THE DOMAIN AND RANGE?  The domain is all of the input values that make sense.  ▫ Sometimes “all real numbers”  ▫ For real-life problems may be limited  The range is the set of all outputs.
  • 24.
    EXAMPLE:  In OakPark, houses will be from 1450 to 2100 square feet. The cost C of building is $75 per square foot and can be modeled by C = 75f, where f is the number of square feet.  Give the domain and range of C(f).