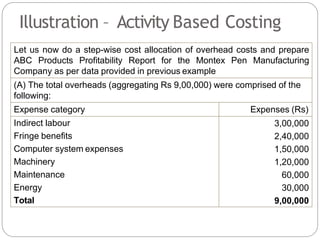
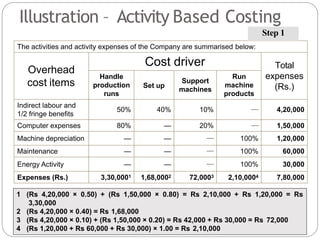
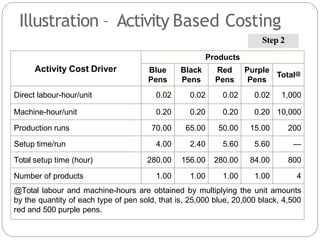
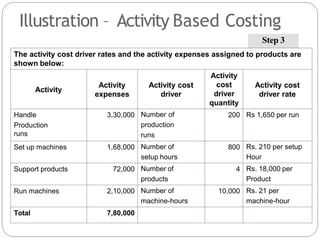
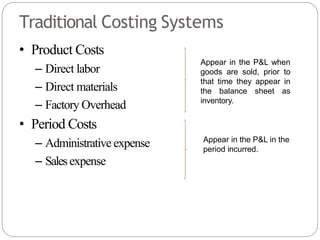
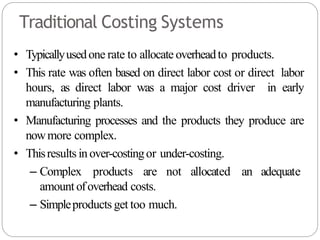
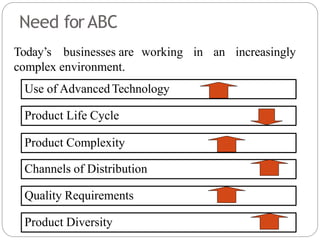
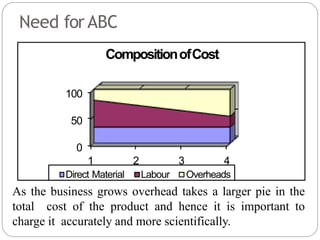
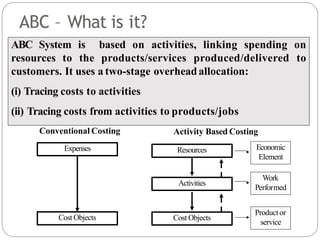
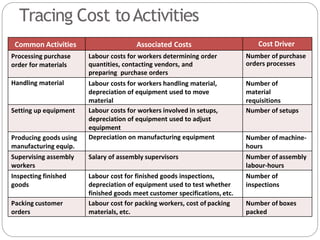
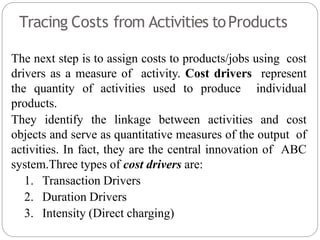
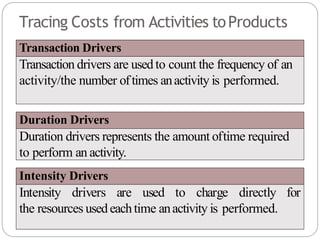
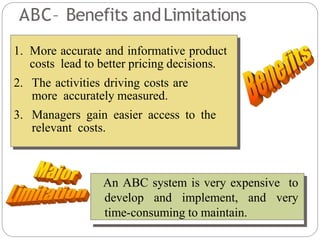
This document provides an overview of activity-based costing (ABC). It discusses the limitations of traditional costing systems and the need for ABC. It describes ABC as focusing on identifying activities associated with making products and linking resource costs to activities and products. The document outlines the key steps in an ABC system: 1) tracing costs to activities, 2) selecting cost drivers, and 3) tracing costs from activities to products. It also provides an example comparing product costs and profits under traditional and ABC systems.

![Illustration – Traditional Costing System
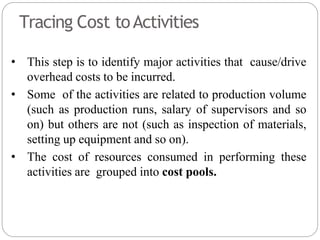
Montex PenTotal and Product Profitability (Amt. in Rs.)
Particulars
Blue
Pens
Black
Pens
Red
Pens
Purple
Pens
Total
(1) (2) (3) (4) (5)
Production/Sales volume 25,000 20,000 4,500 500 50,000
Unit sale price 45 45 46.5 49.5
Sales (a) 11,25,000 9,00,000 2,09,250 24,750 22,59,000
Material costs 3,75,000 3,00,000 70,200 8,250 7,53,450
Direct labour costs 1,50,000 1,20,000 27,000 3,000 3,00,000
Overheads (300% of Direct
Labour)
4,50,000 3,60,000 81,000 9,000 9,00,000
Total costs (b) 9,75,000 7,80,000 1,78,200 20,250 19,53,450
Total operating income
[(a) – (b)]
1,50,000 1,20,000 31,050 4,500 3,05,550
Return on sales (%) 13.3 13.3 14.8 18.2 13.5](https://image.slidesharecdn.com/activitybasedcosting-230309131235-f231c62f/85/Activity-Based-Costing-pptx-20-320.jpg)