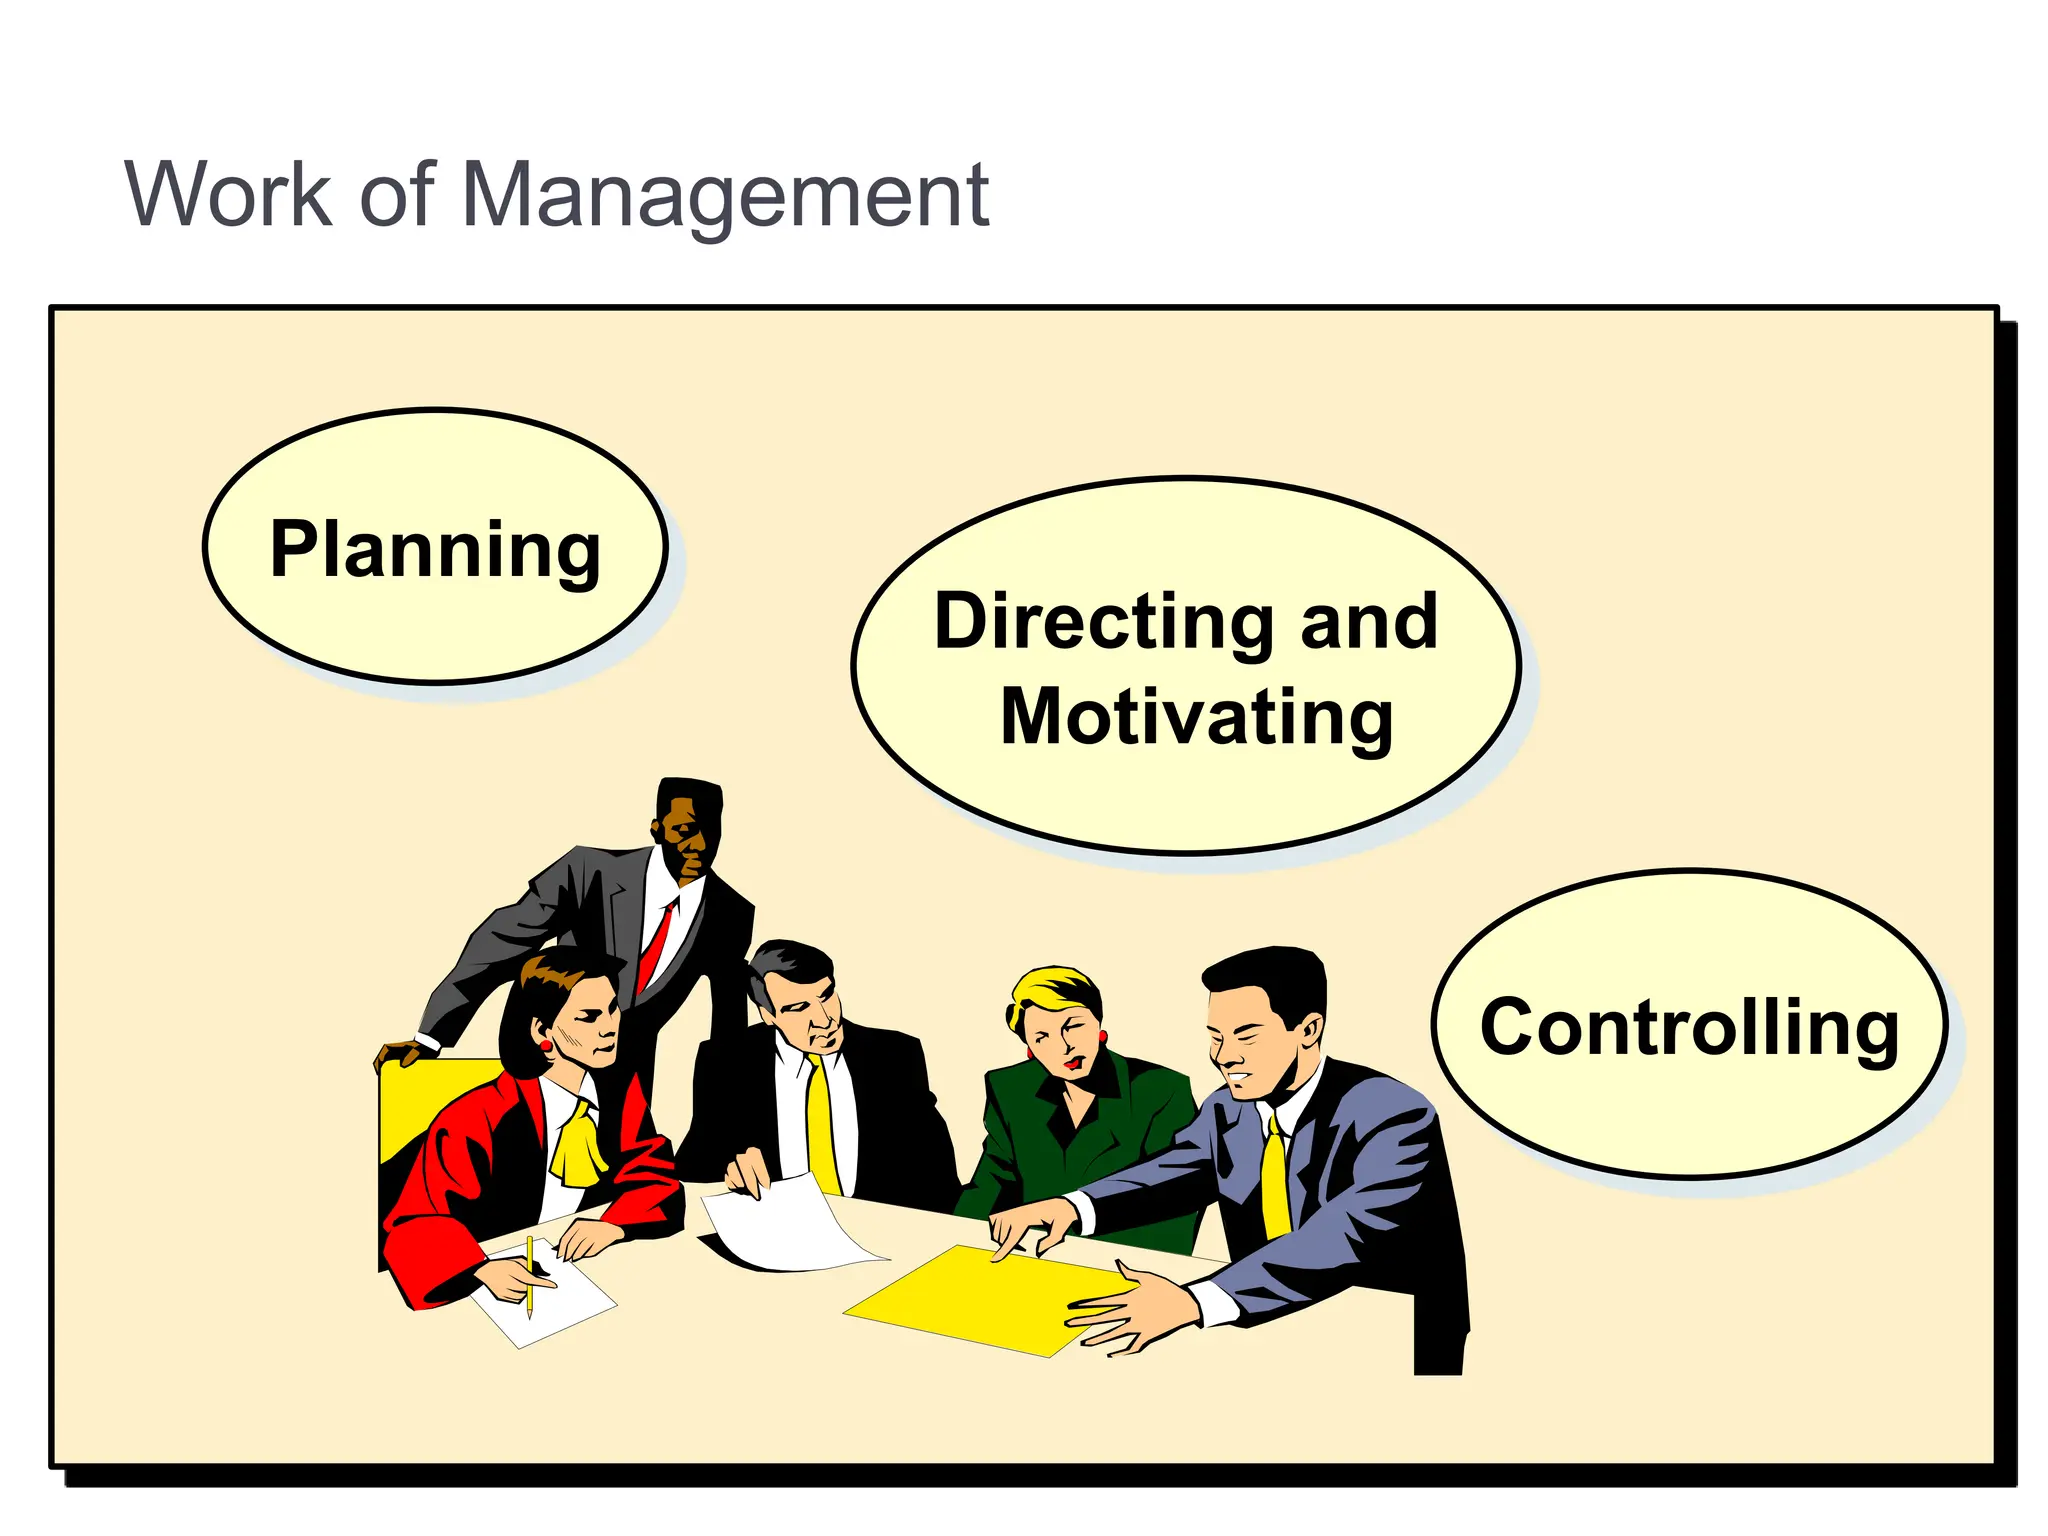
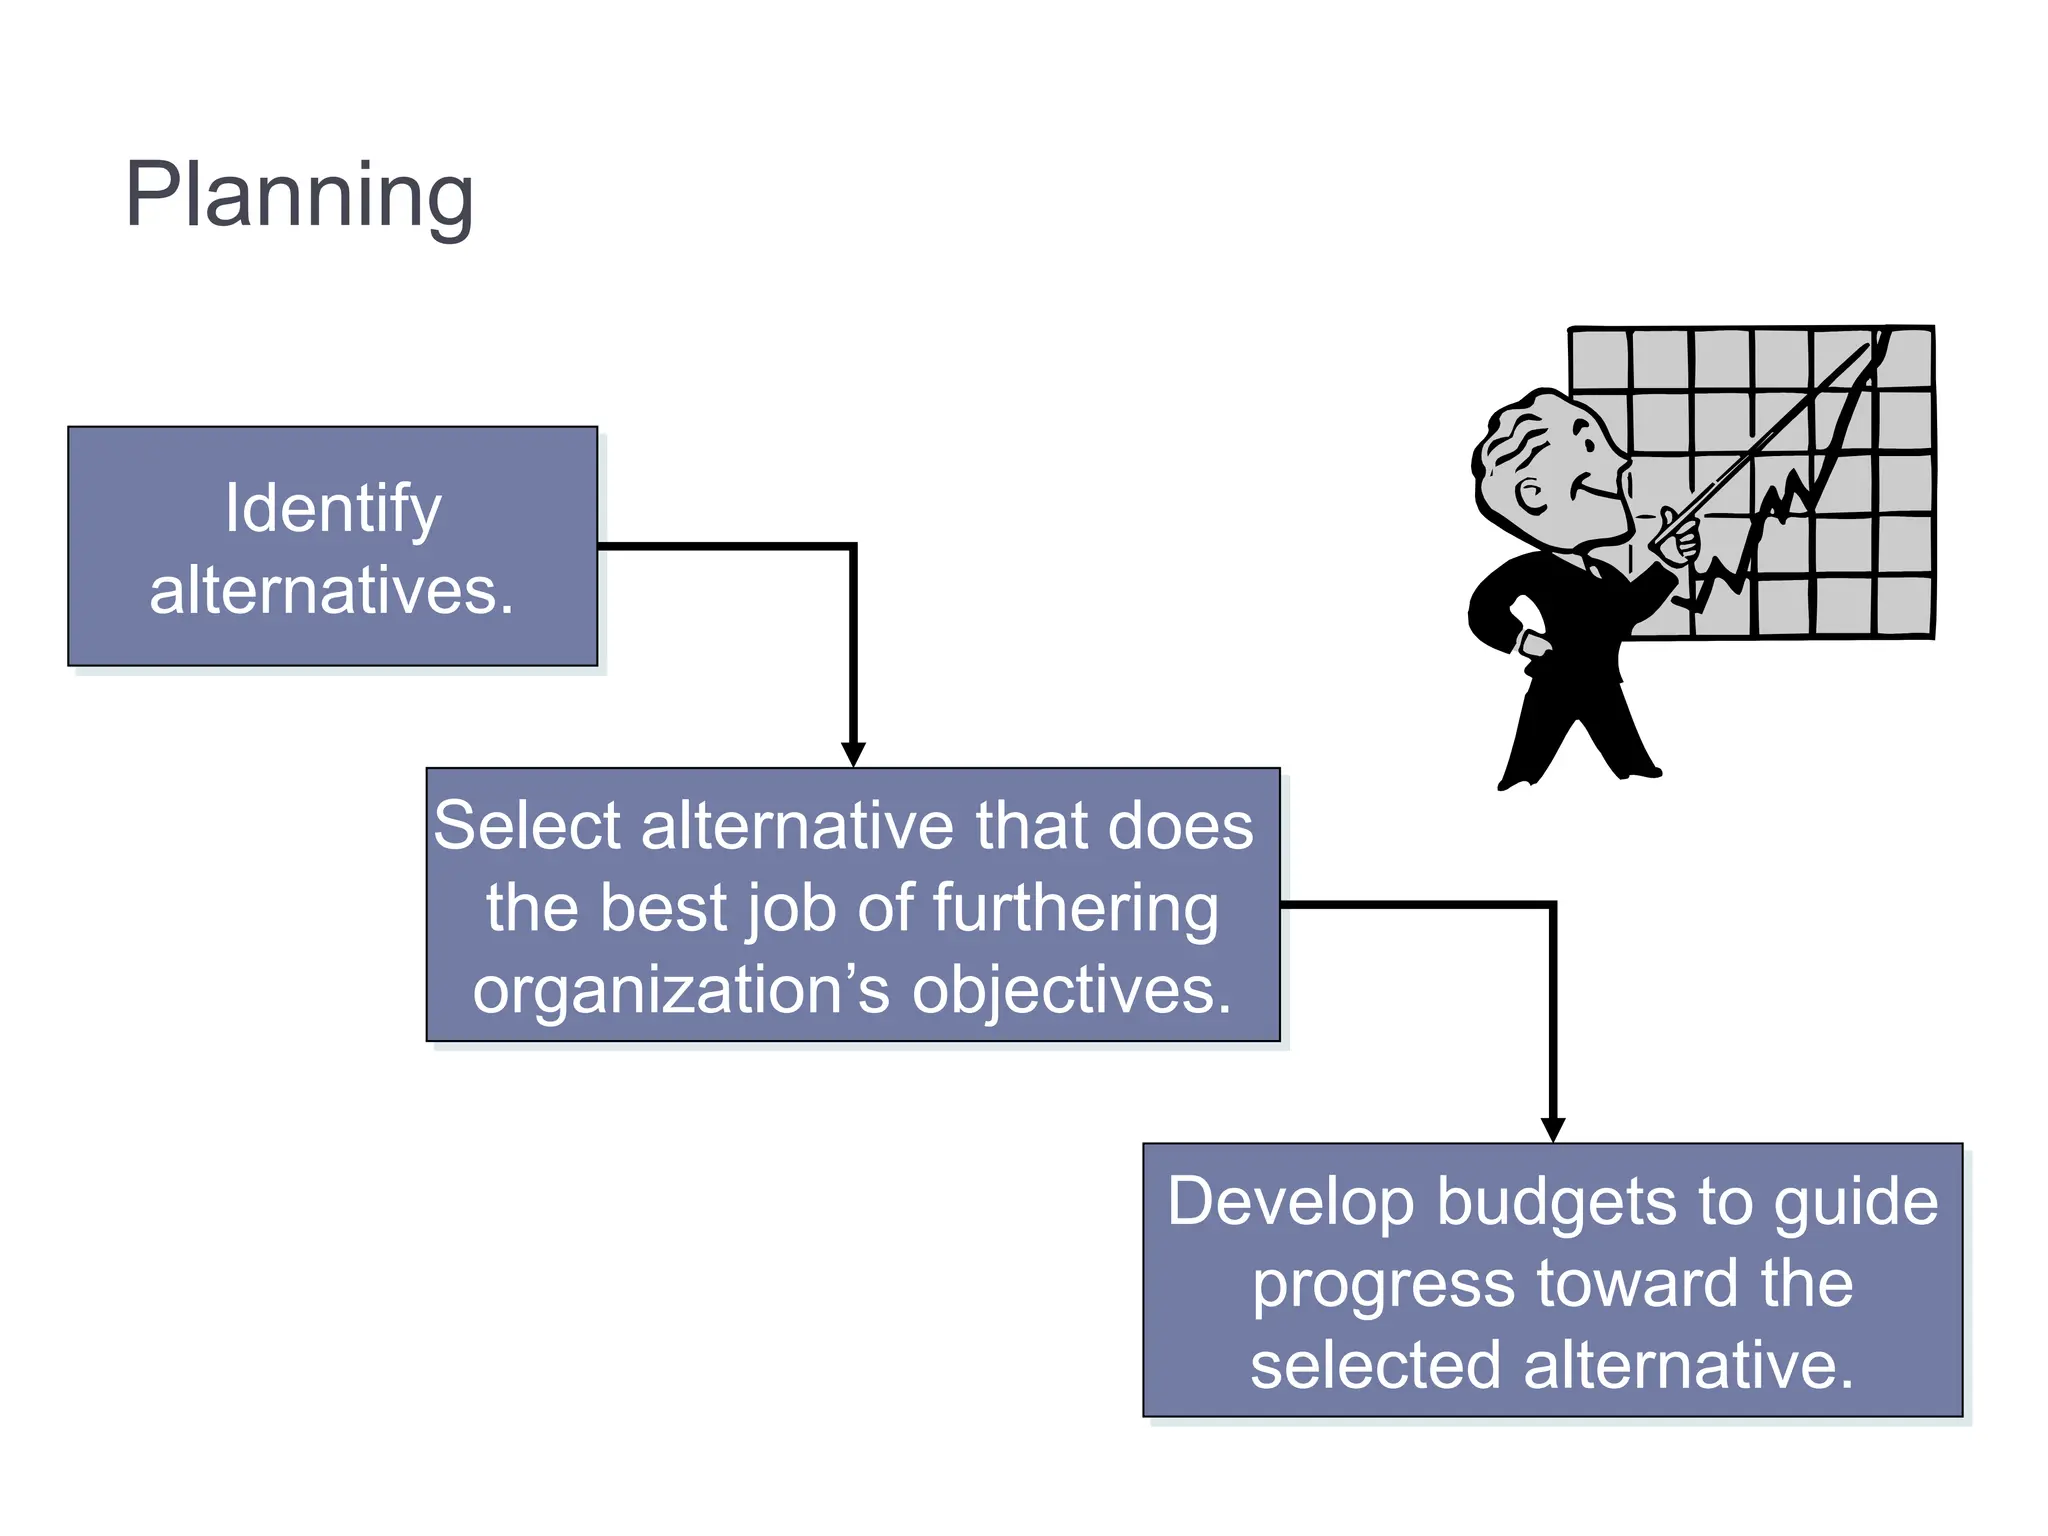
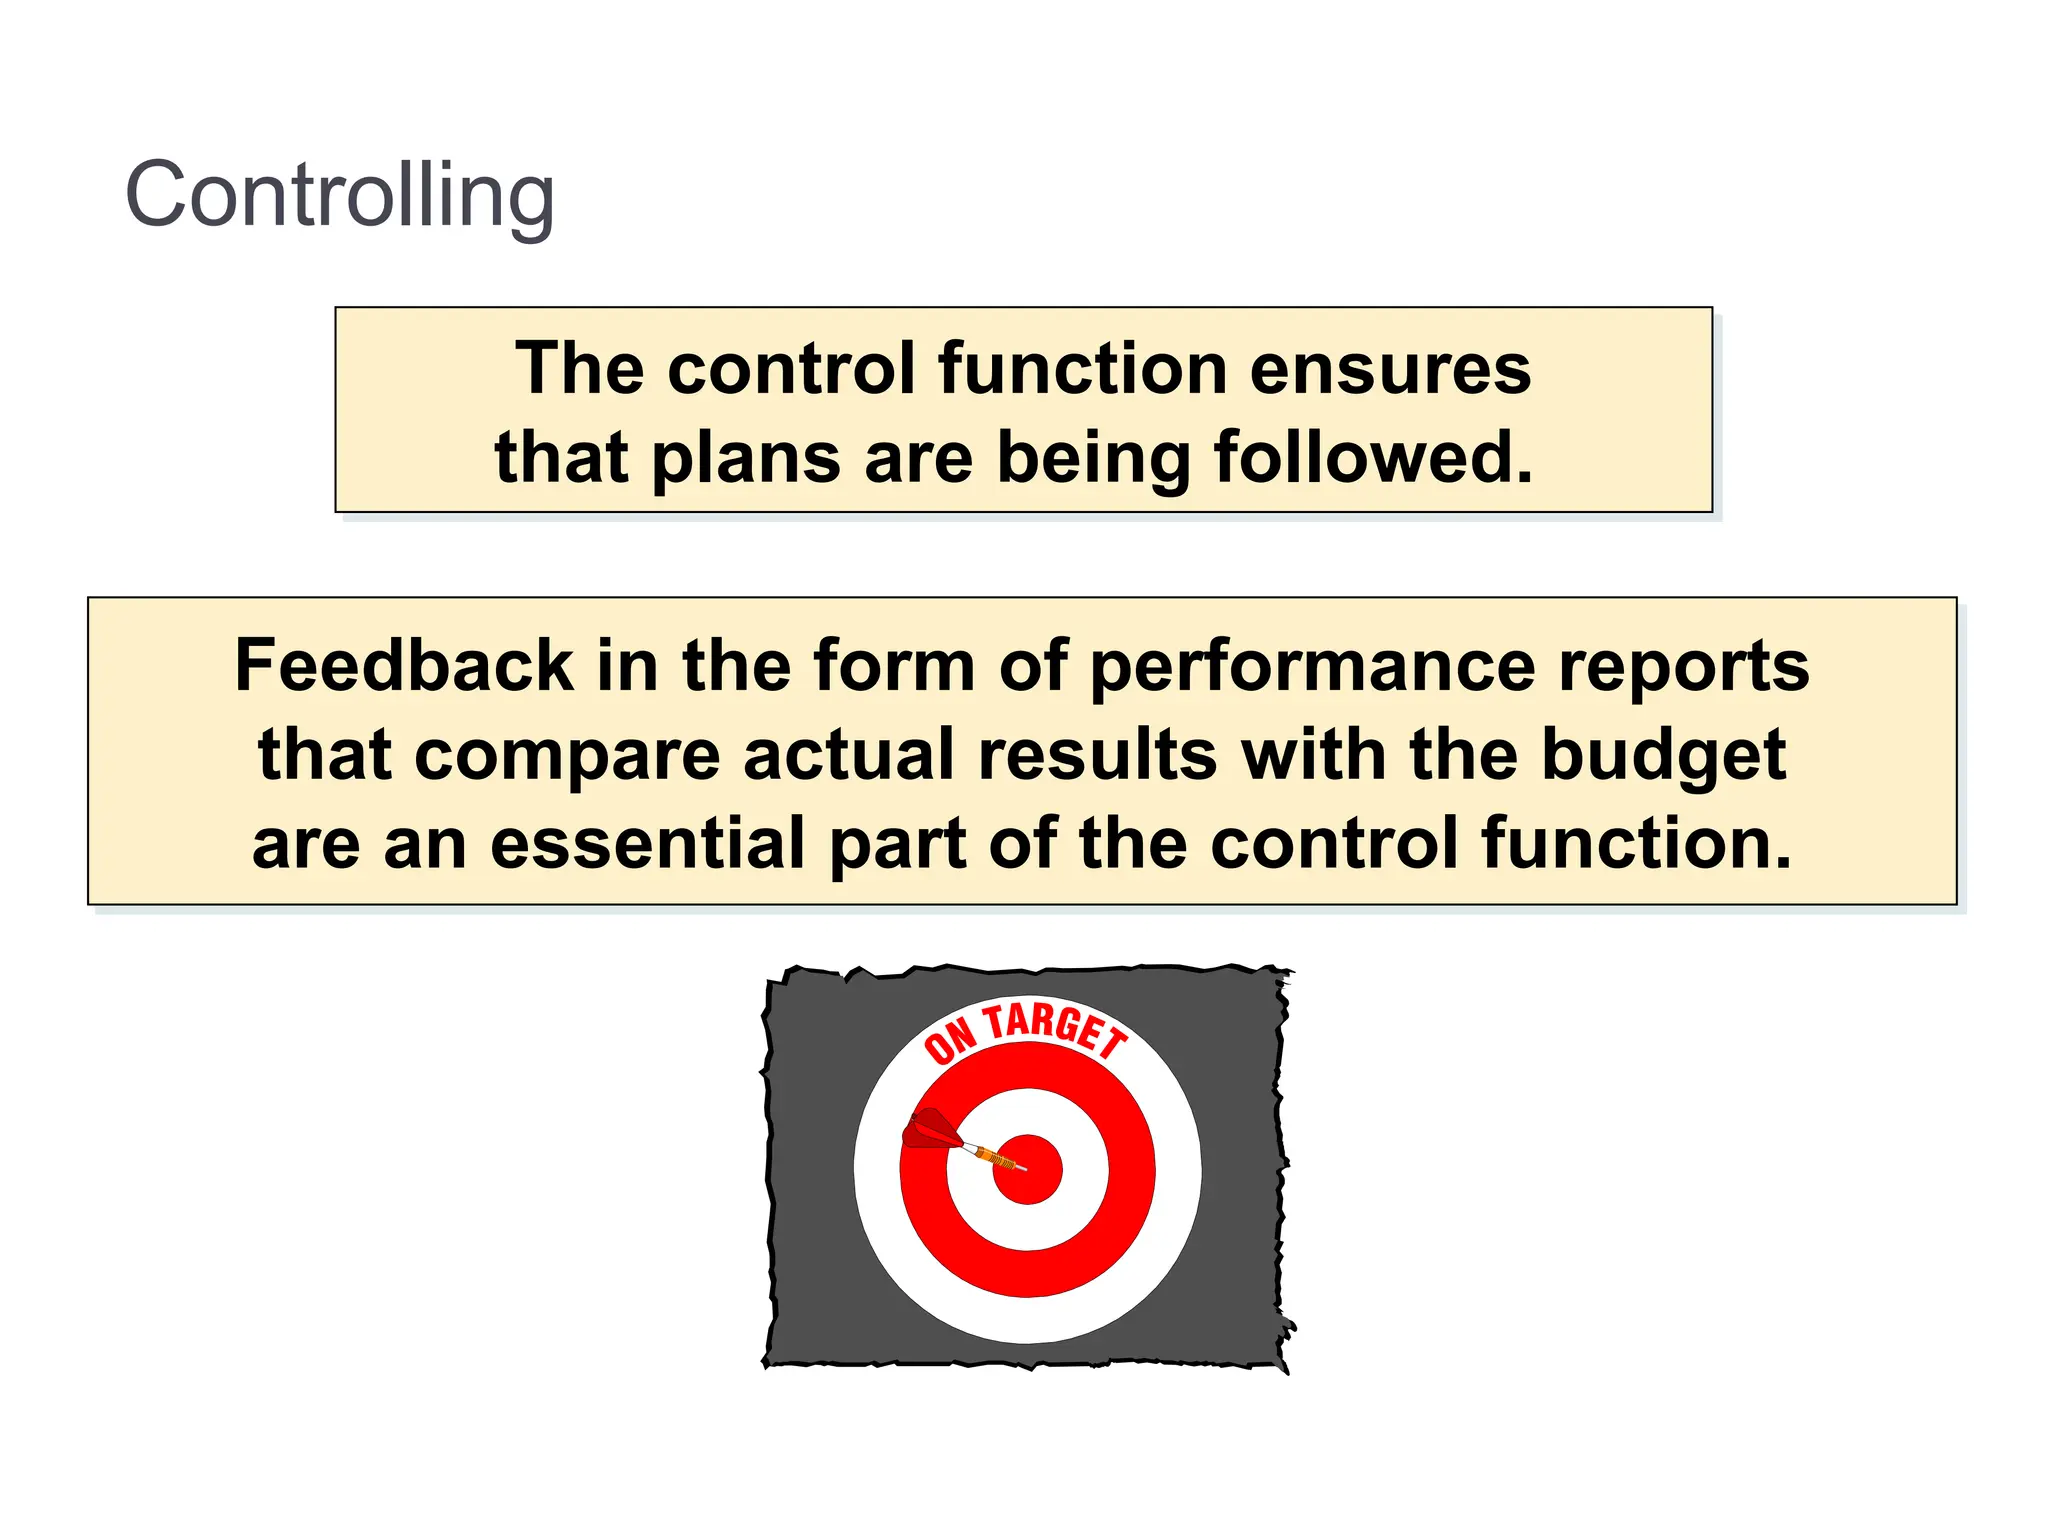
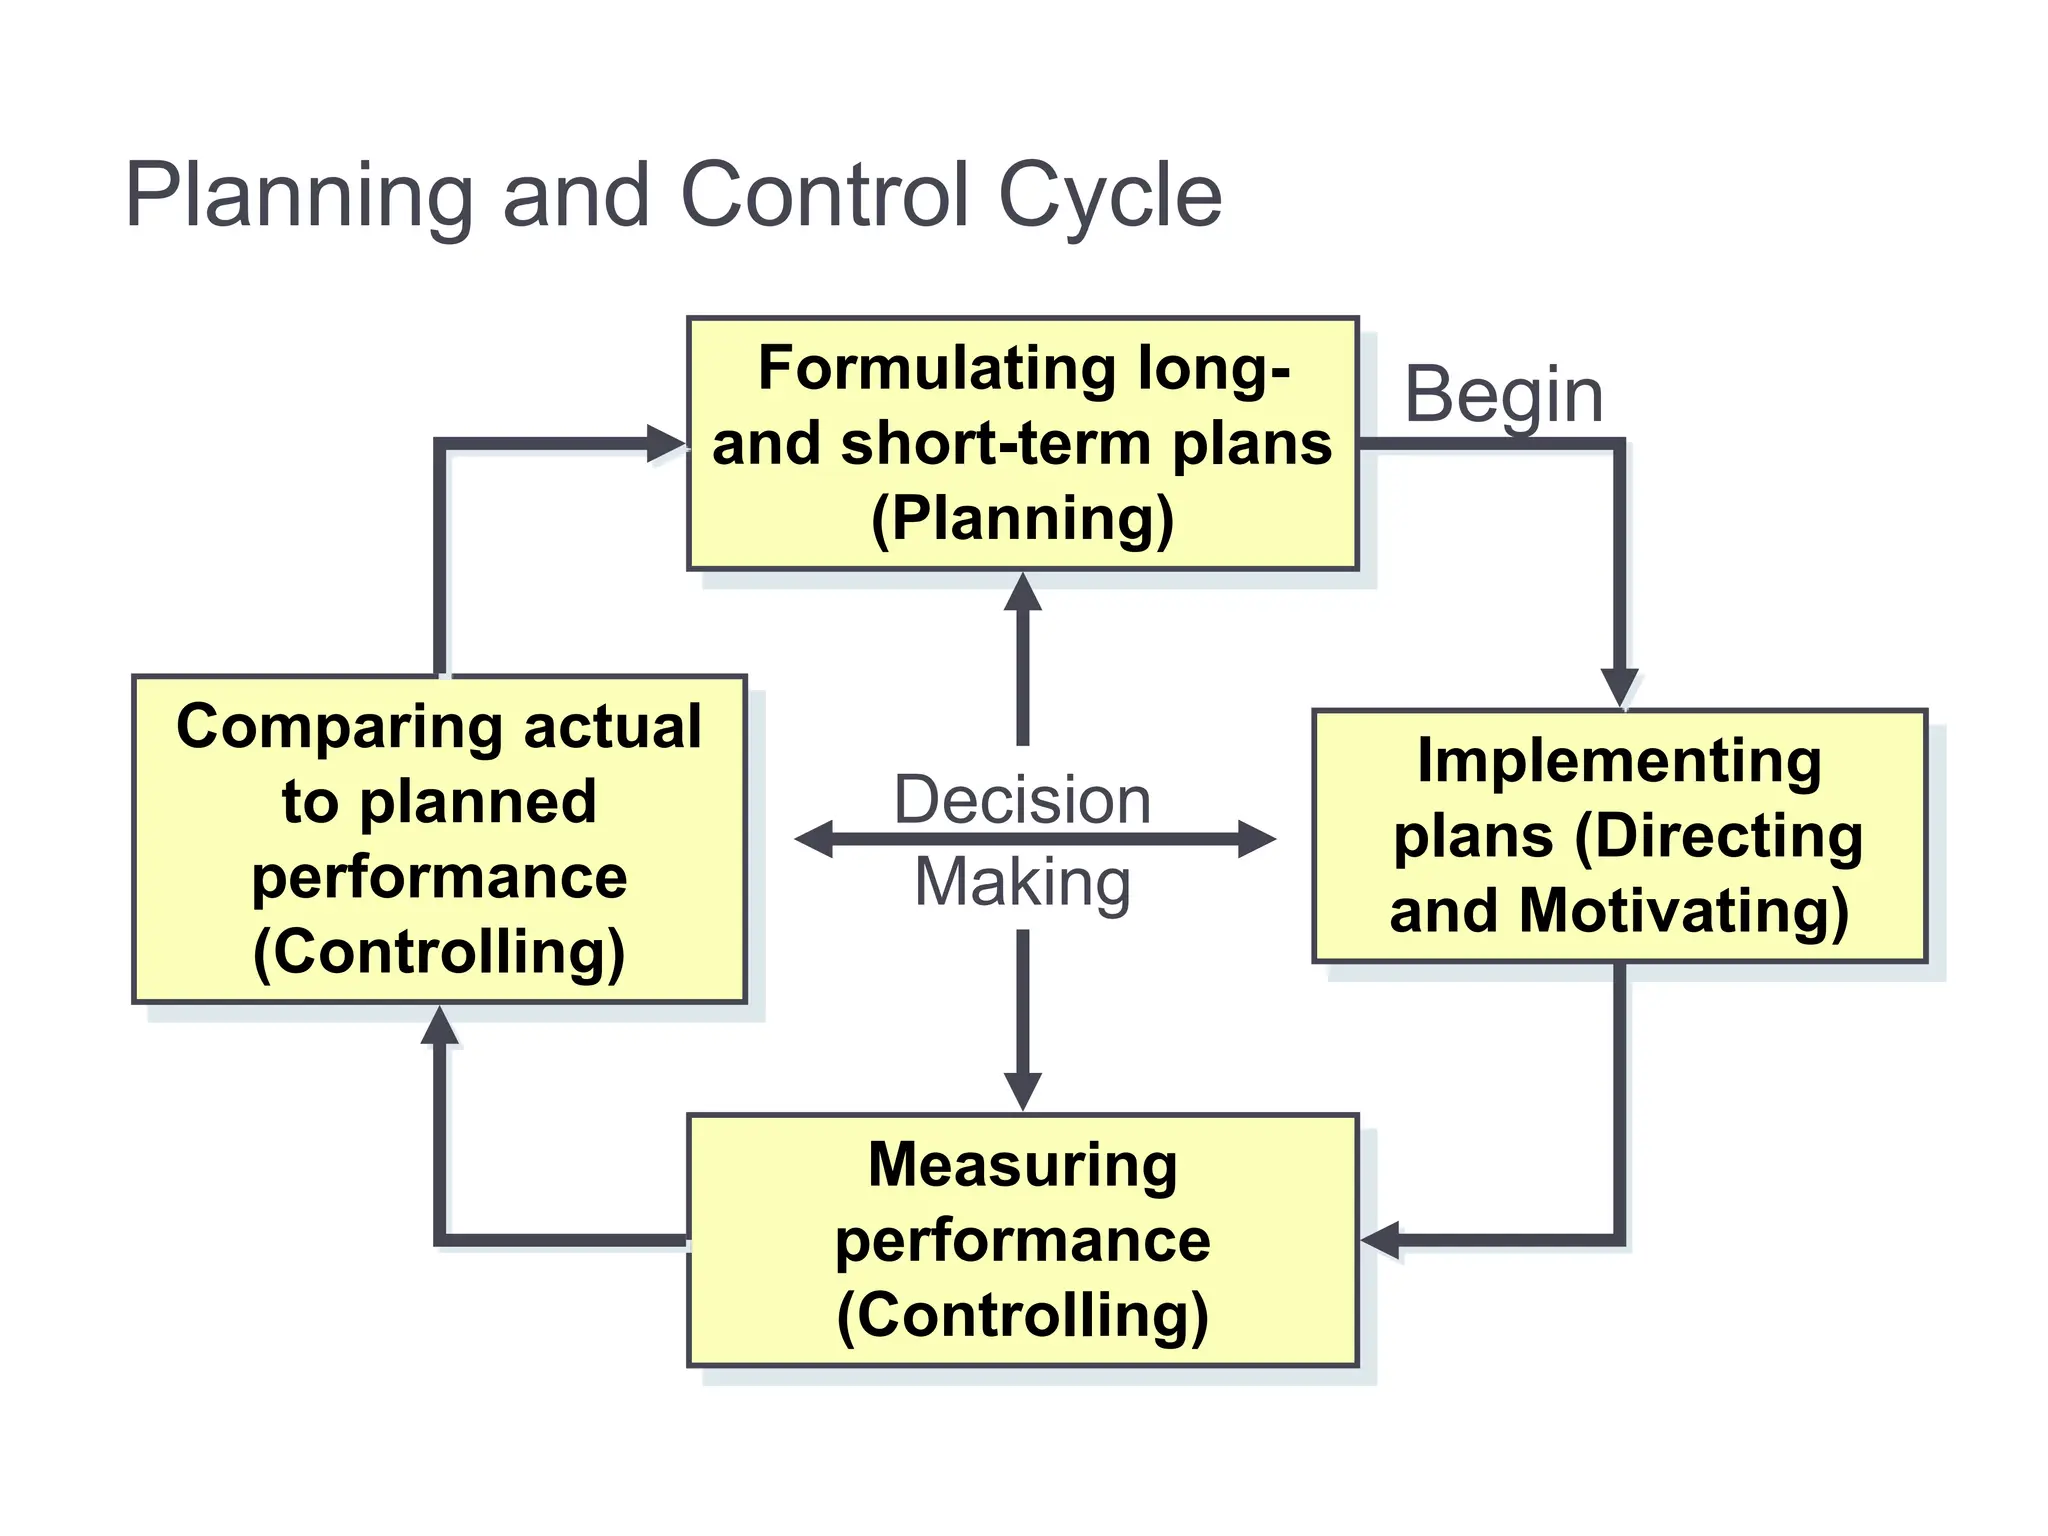
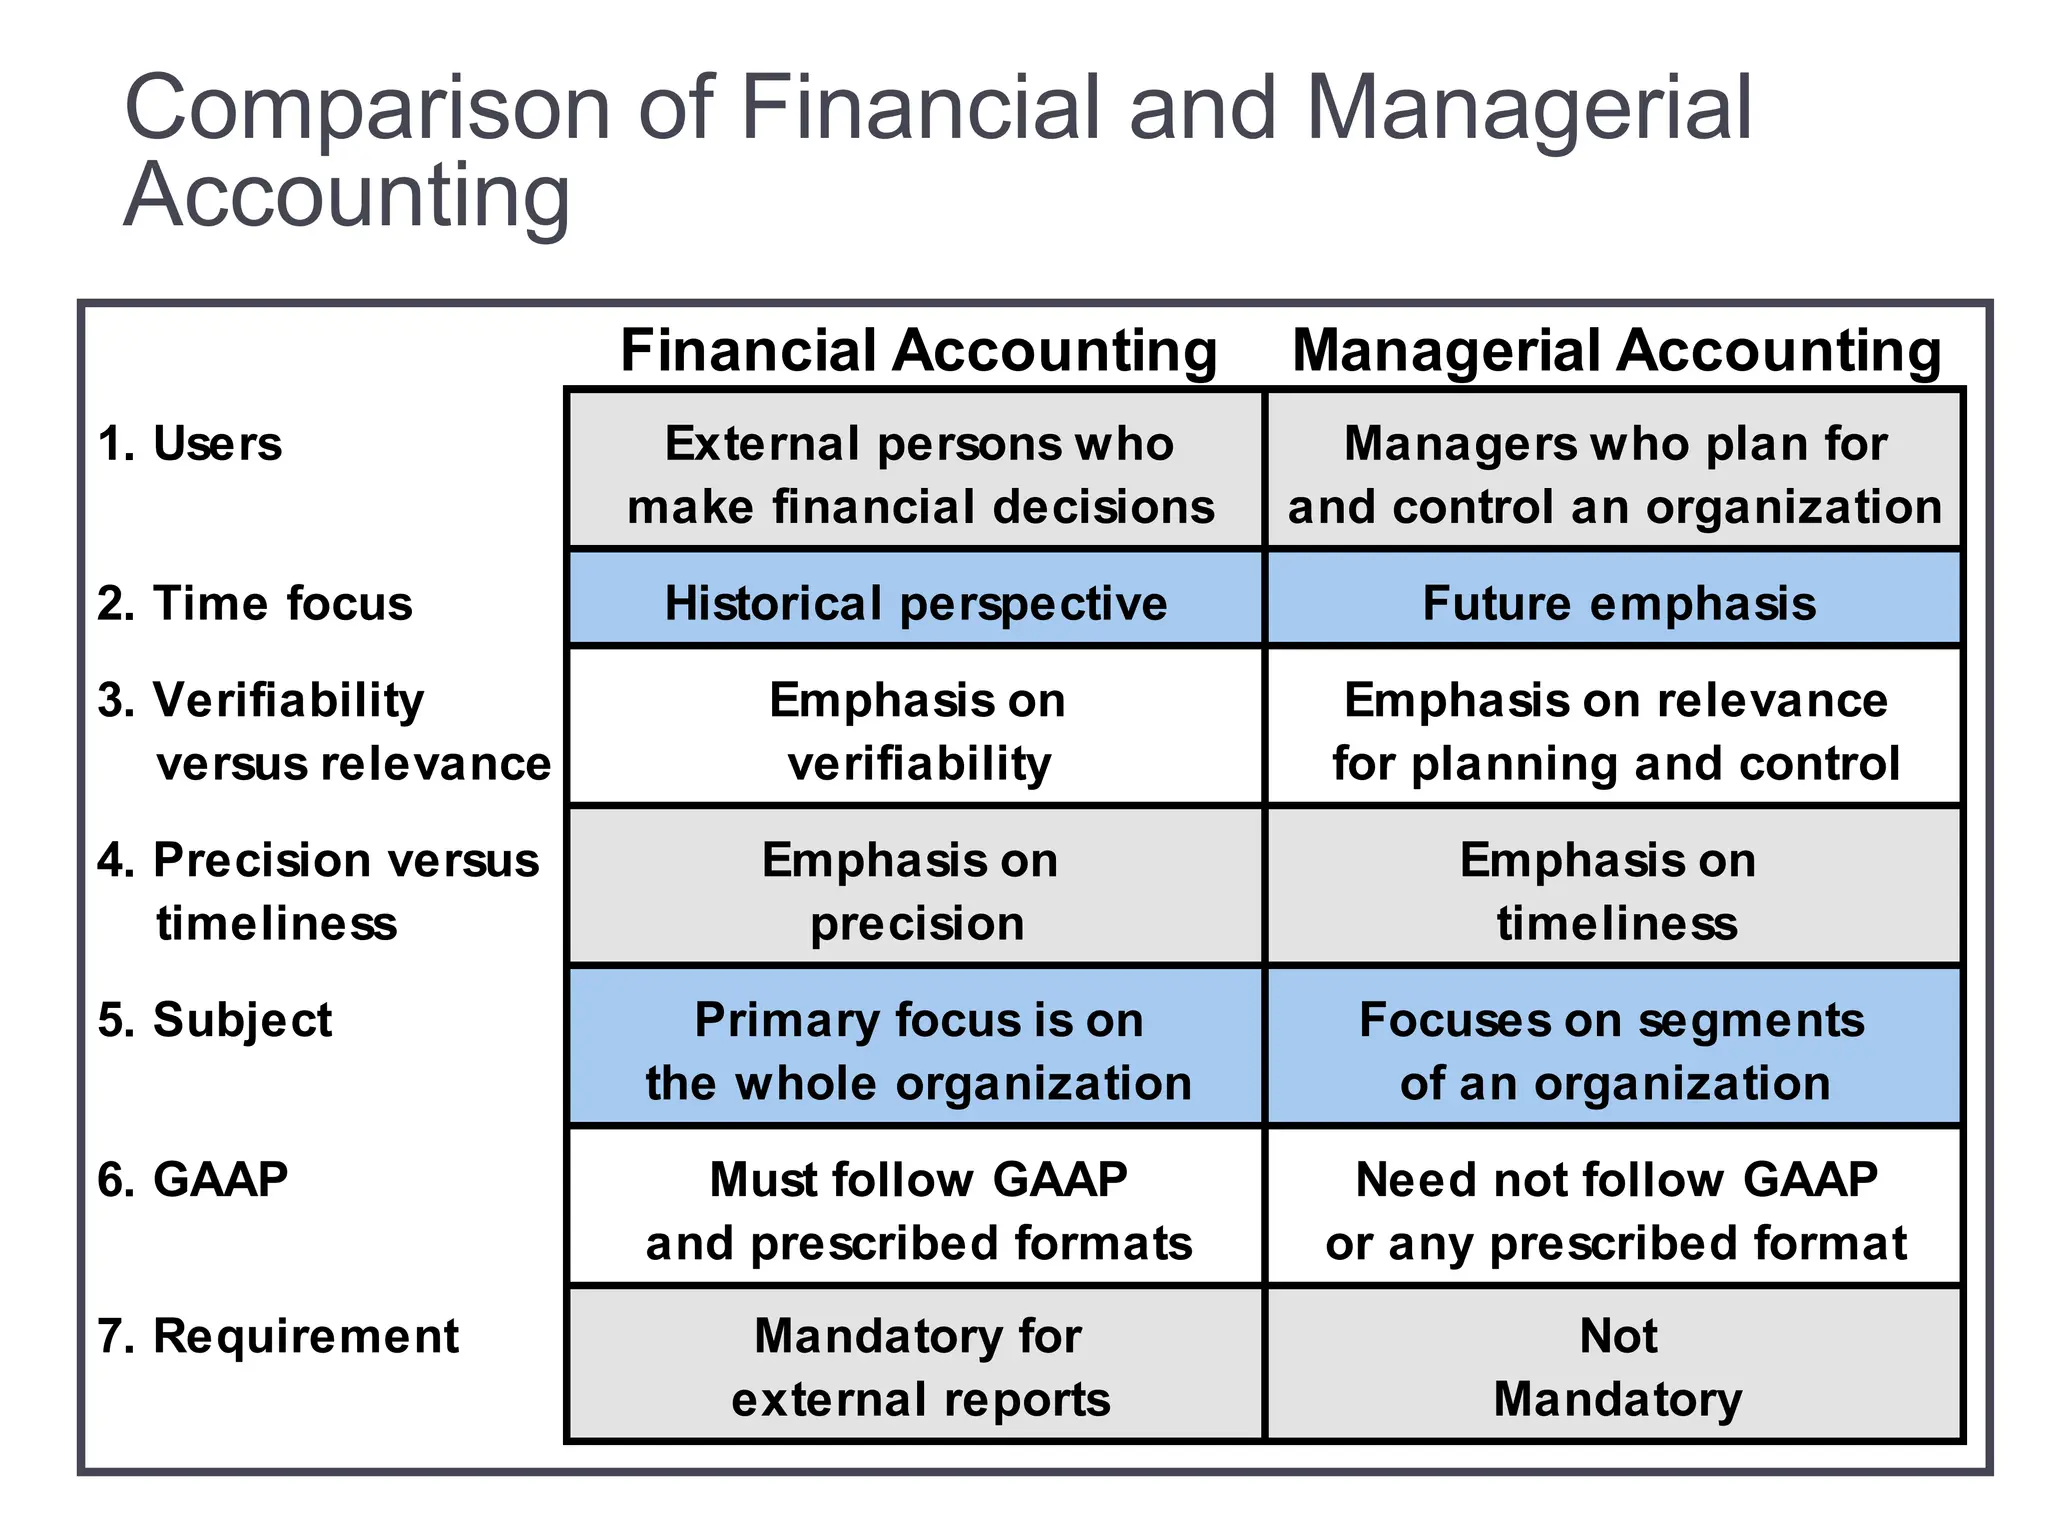
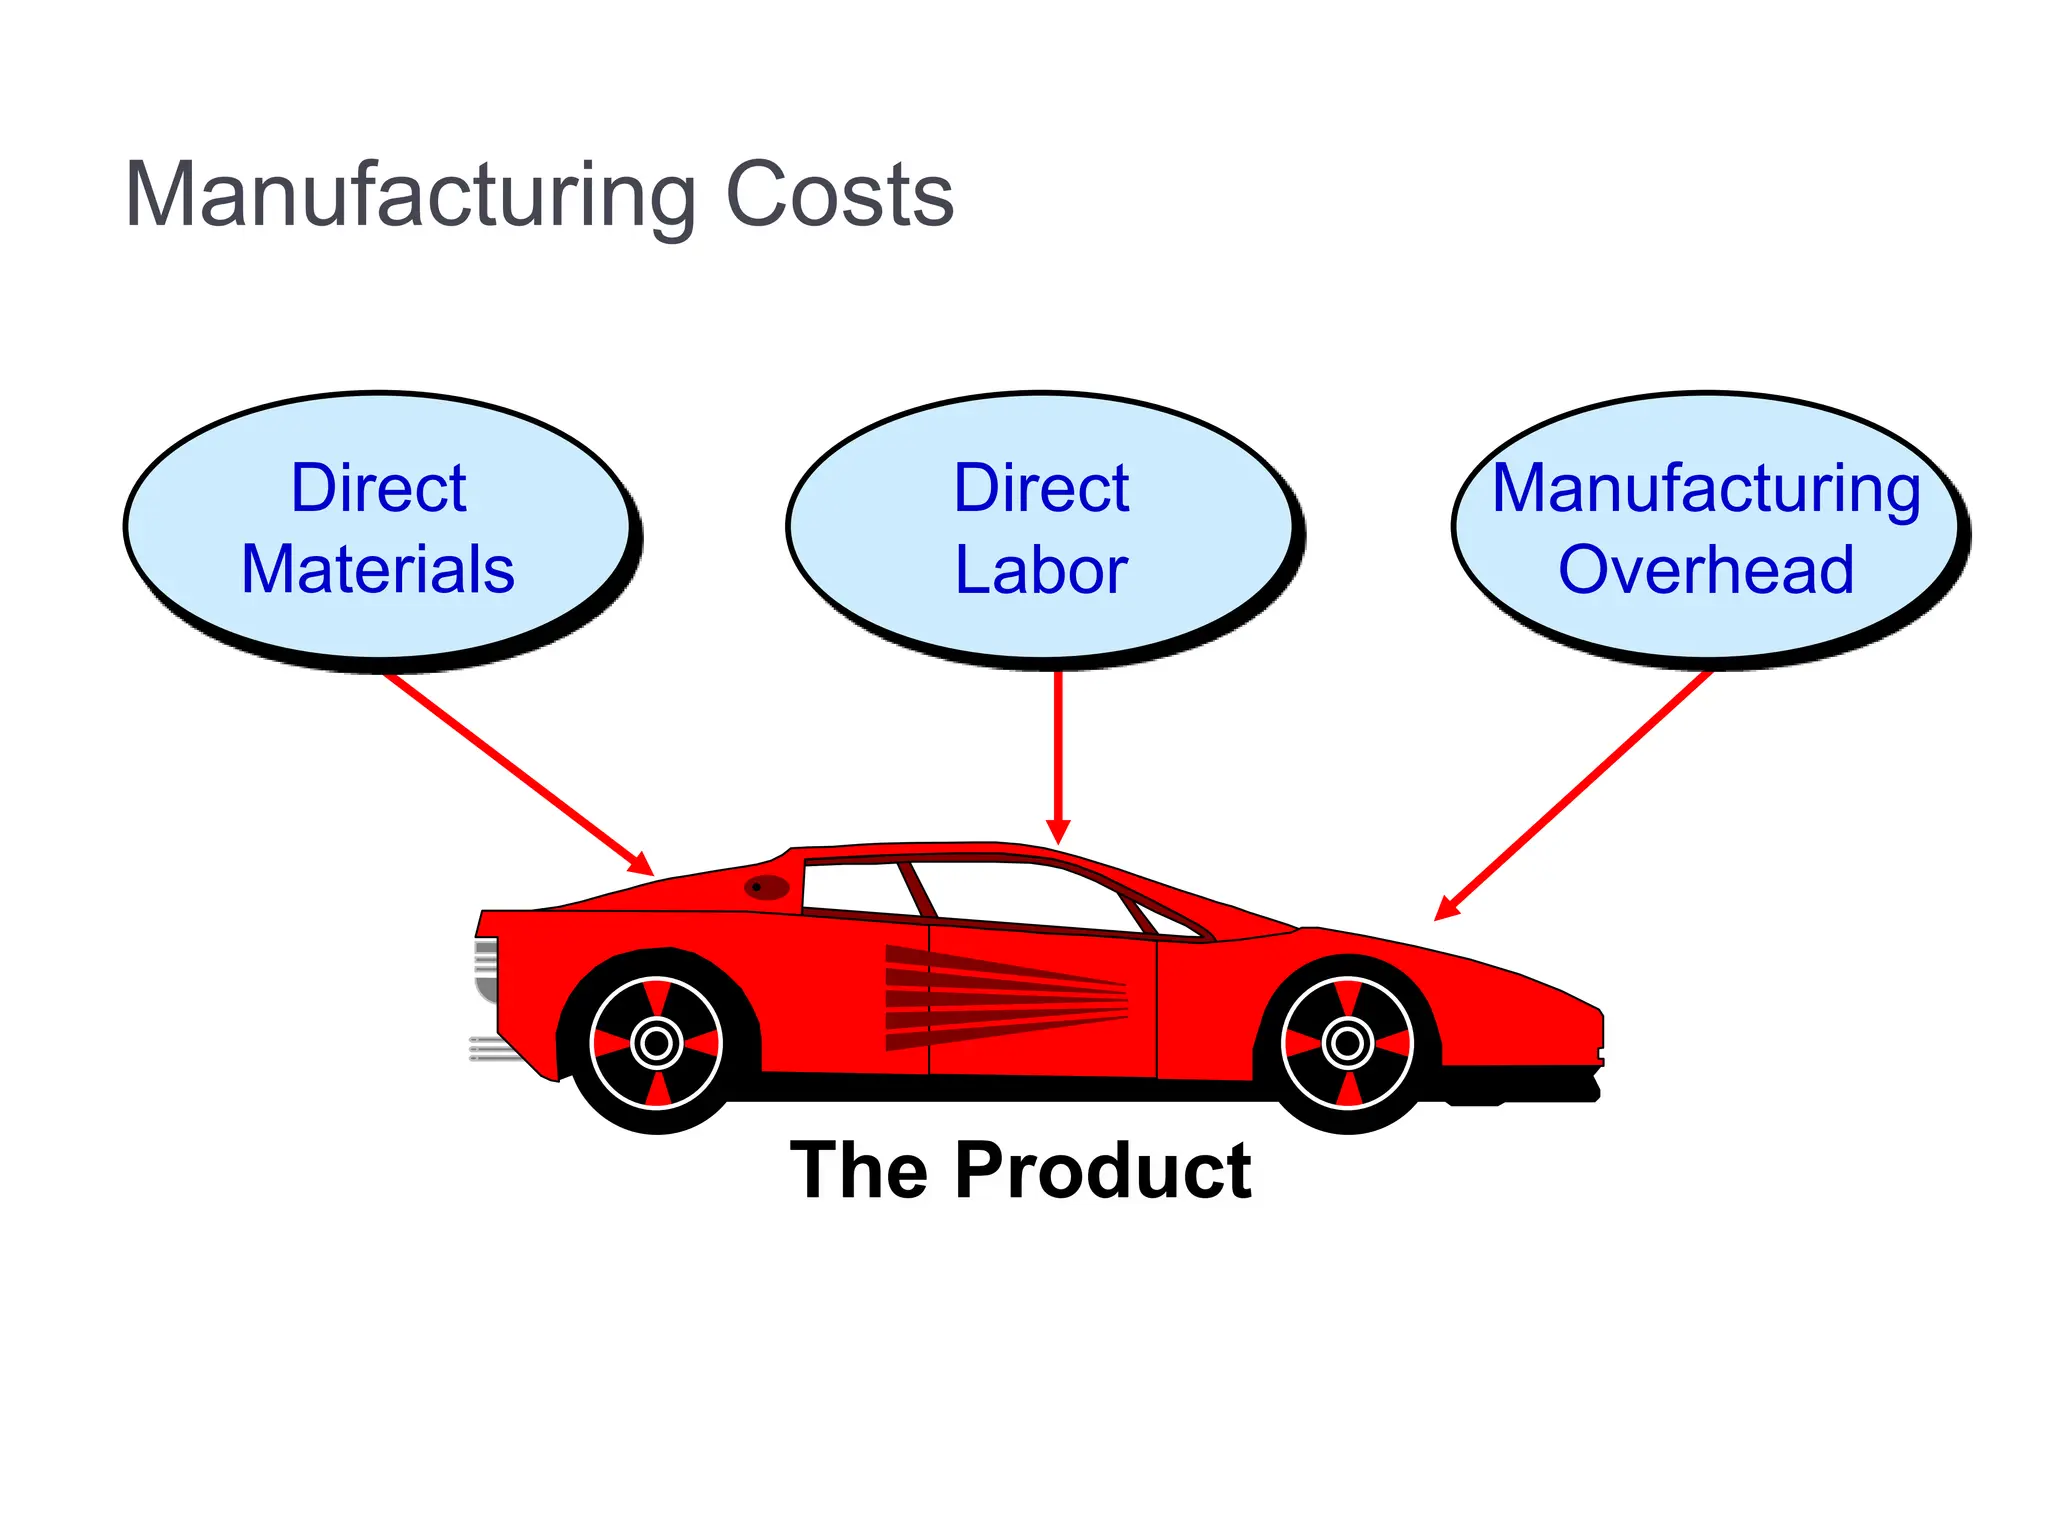
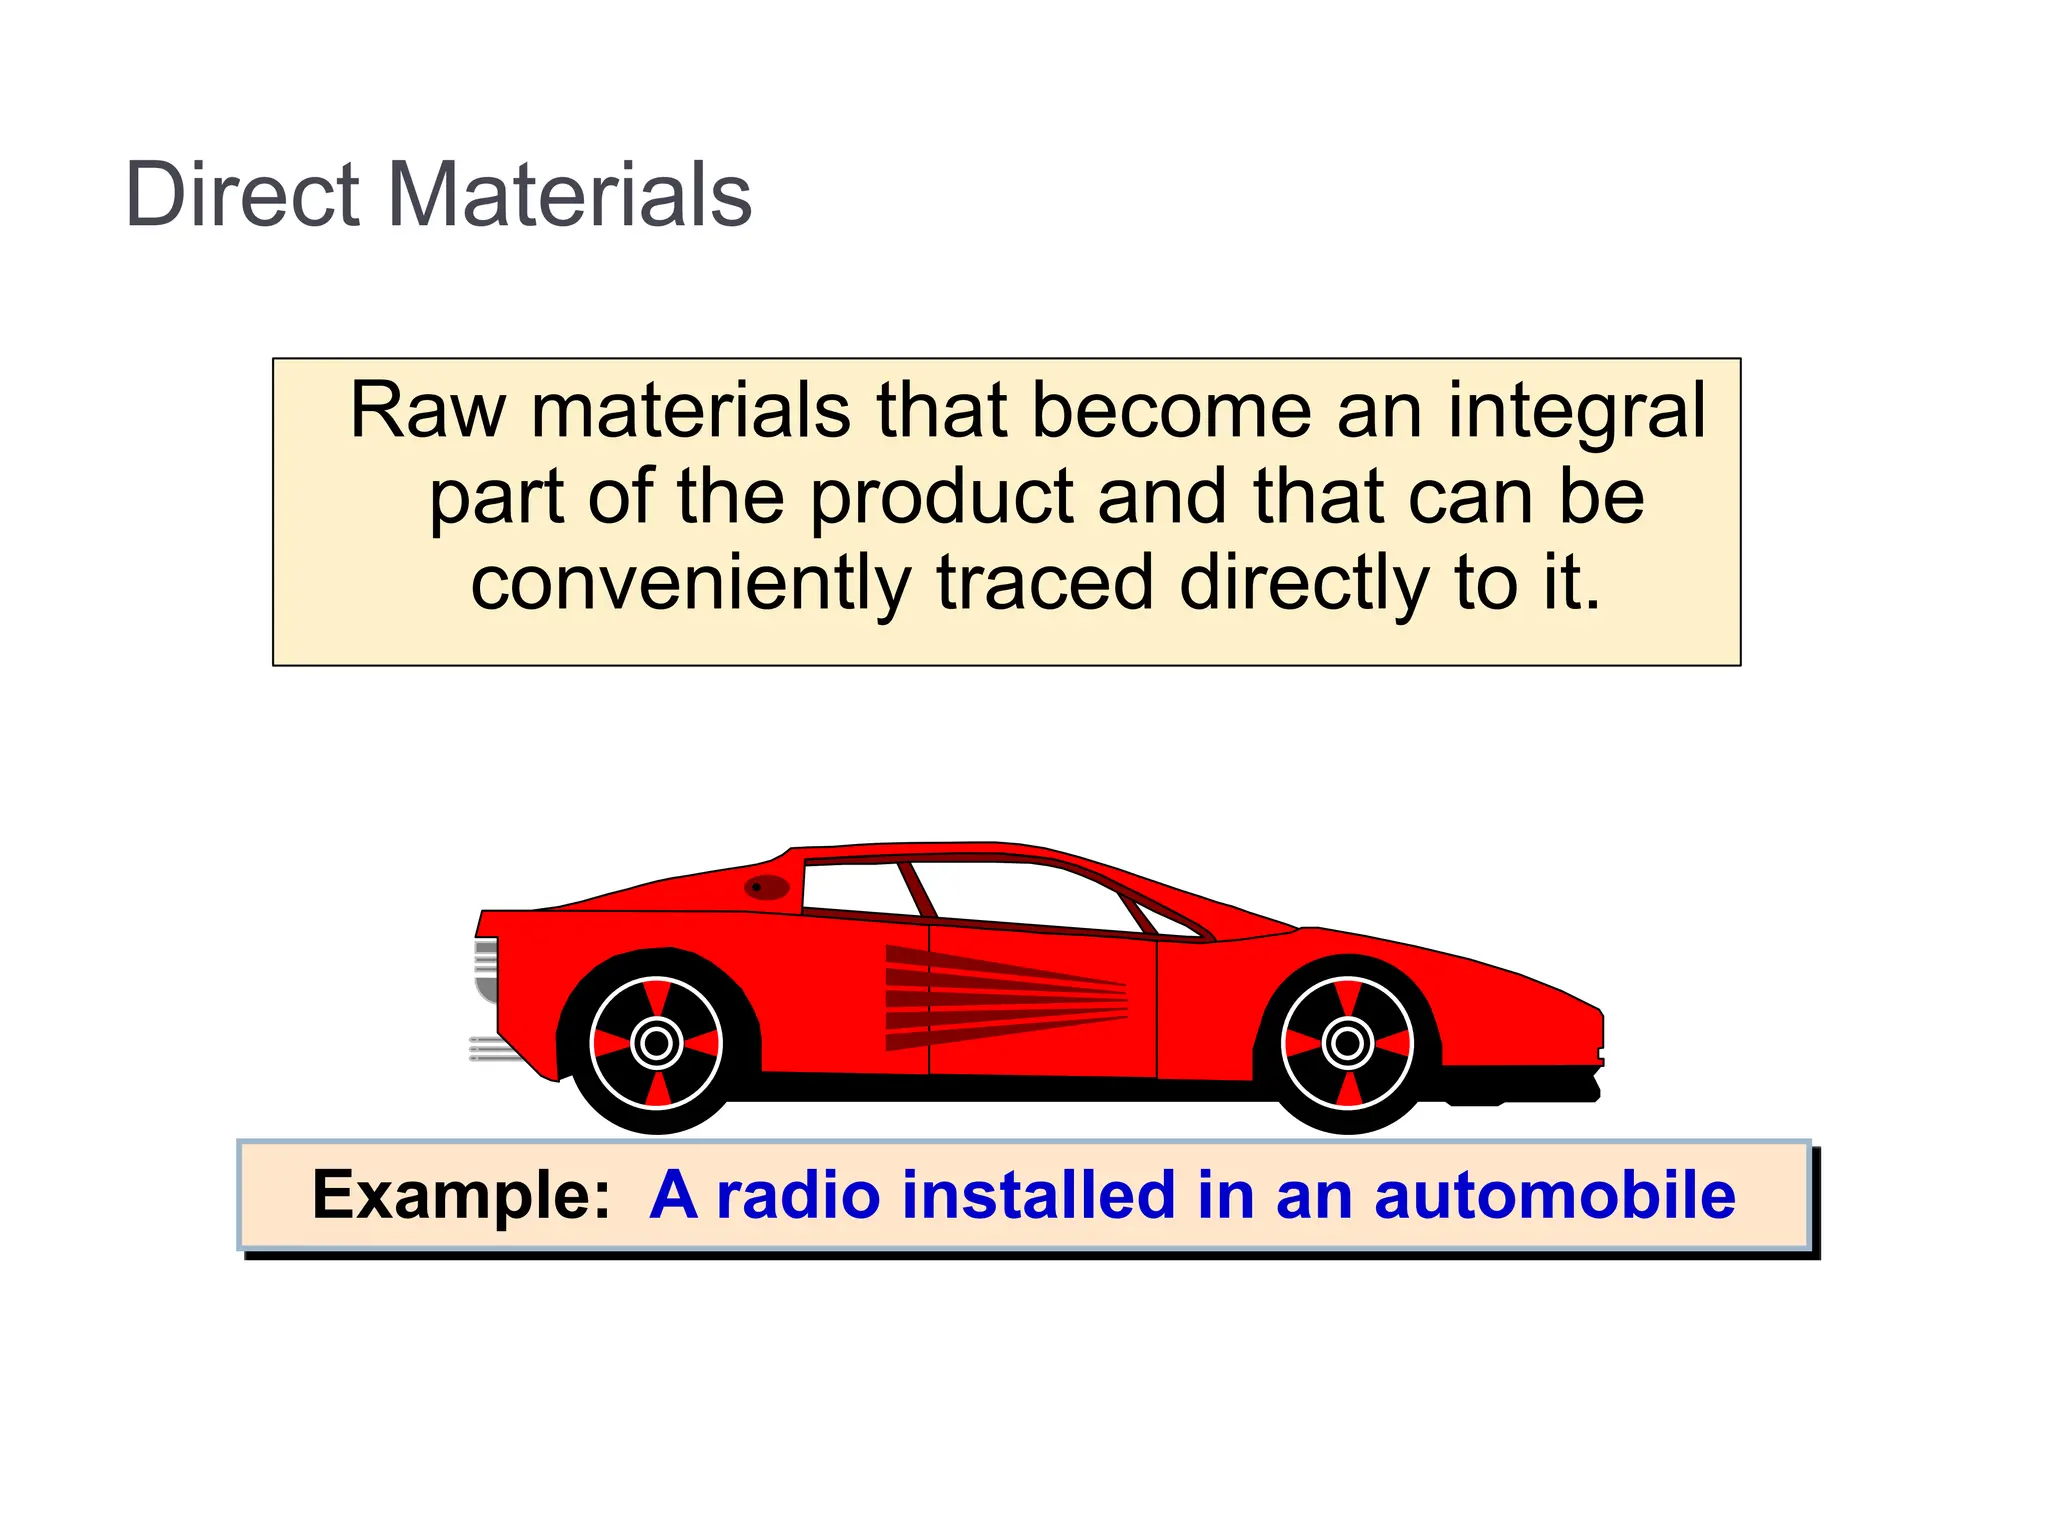
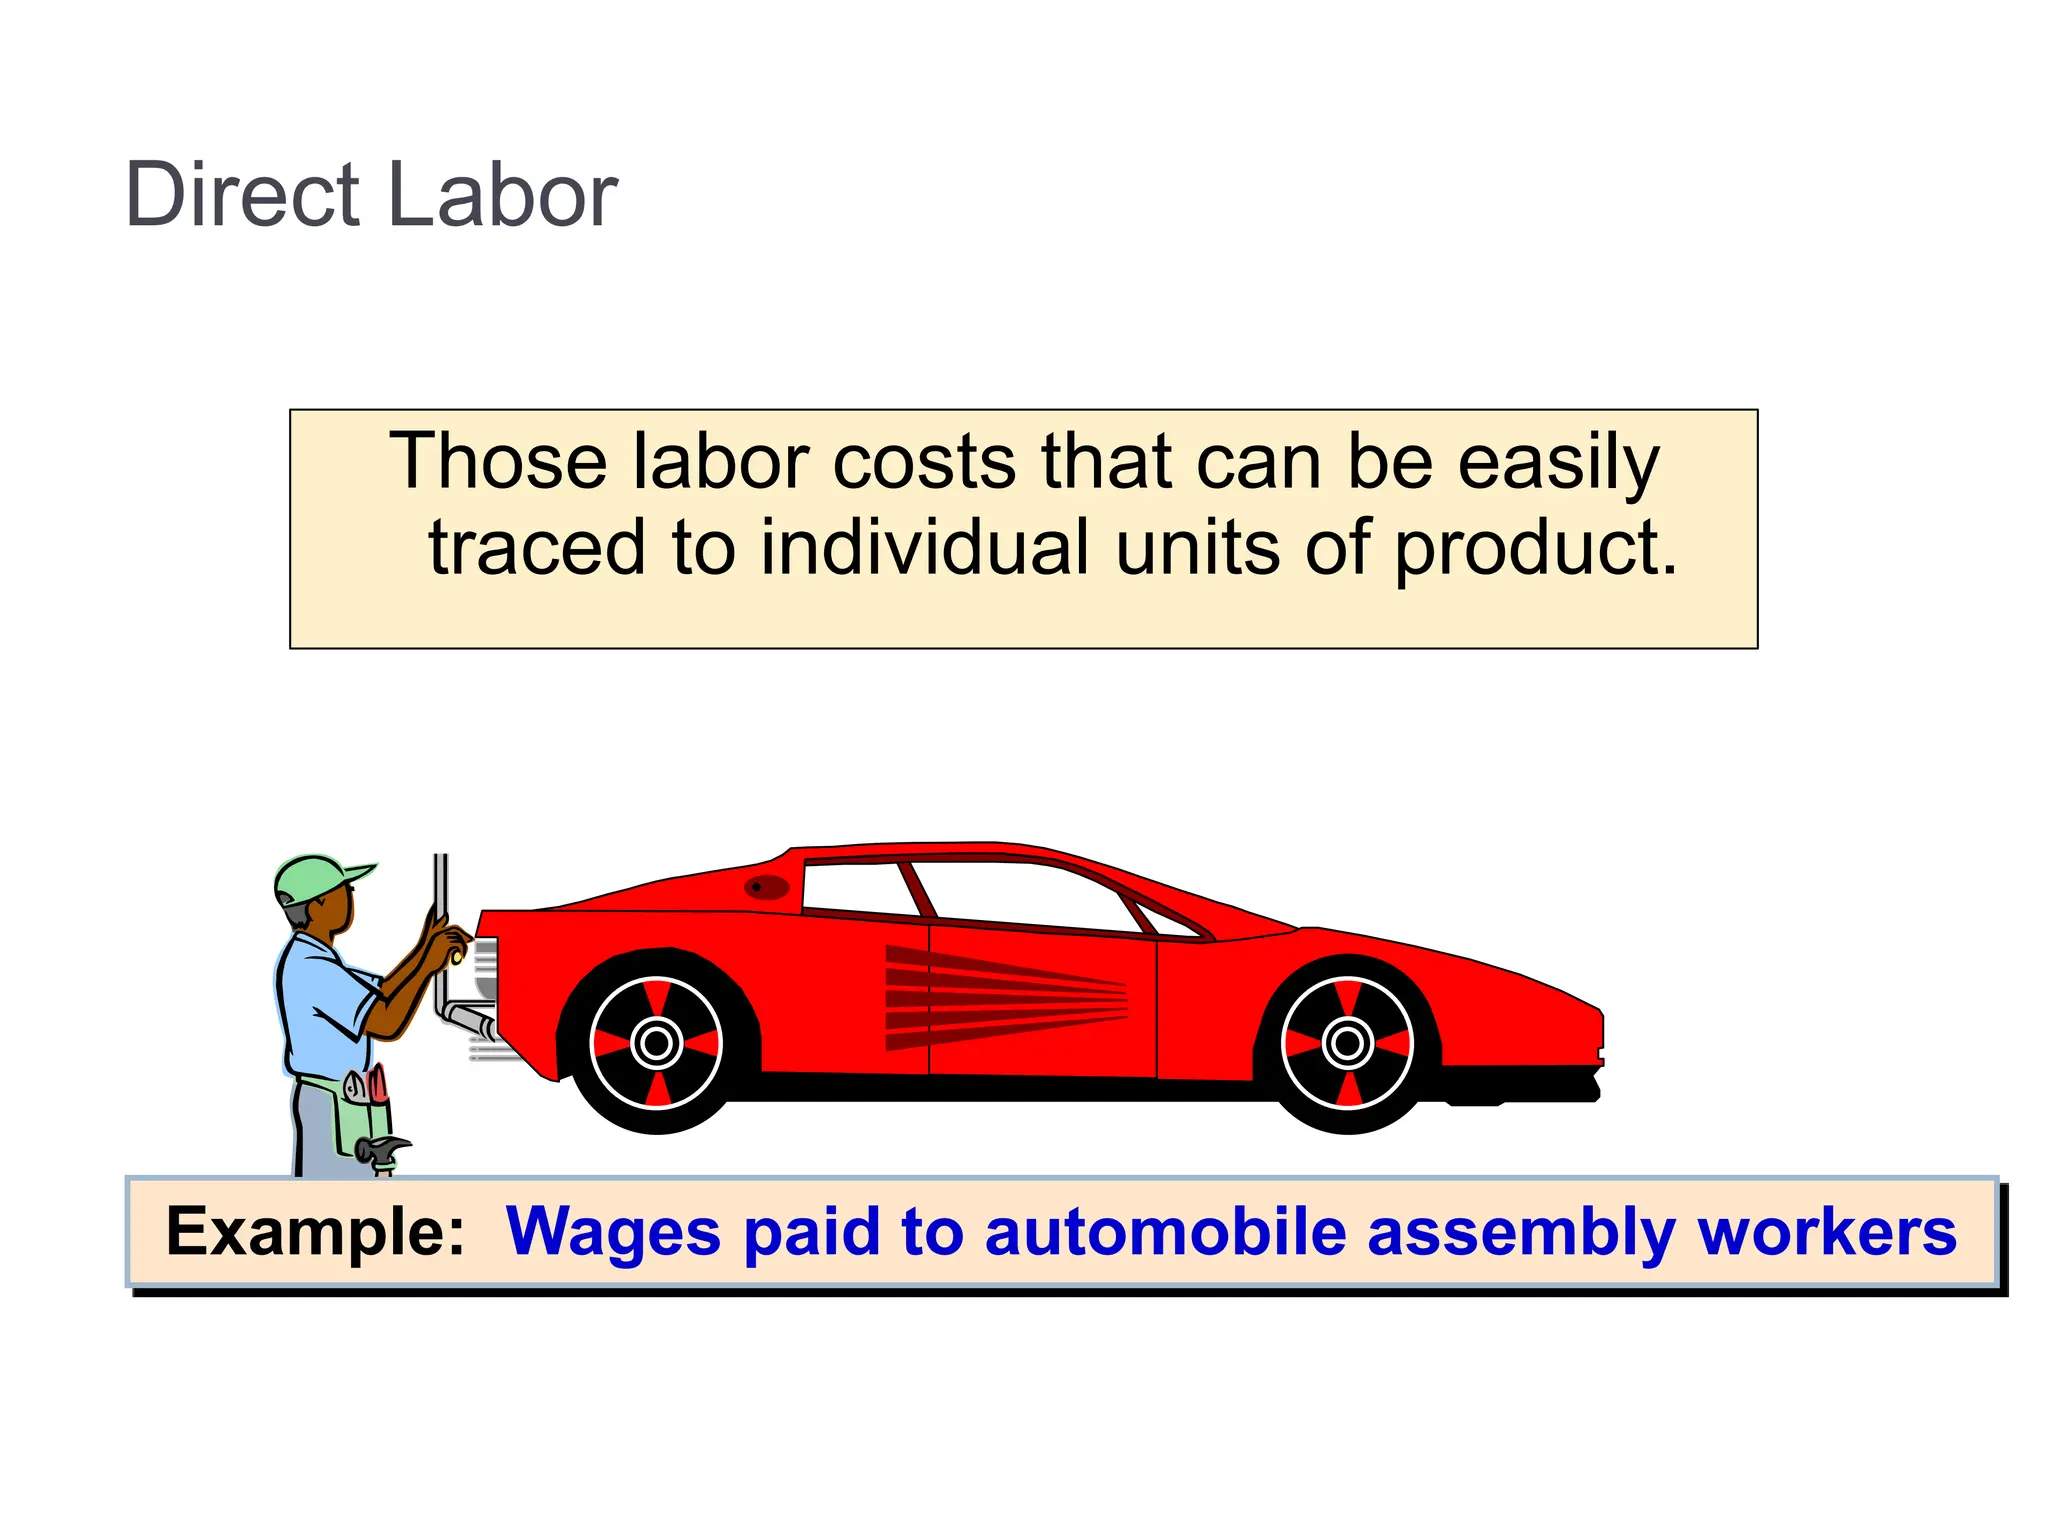
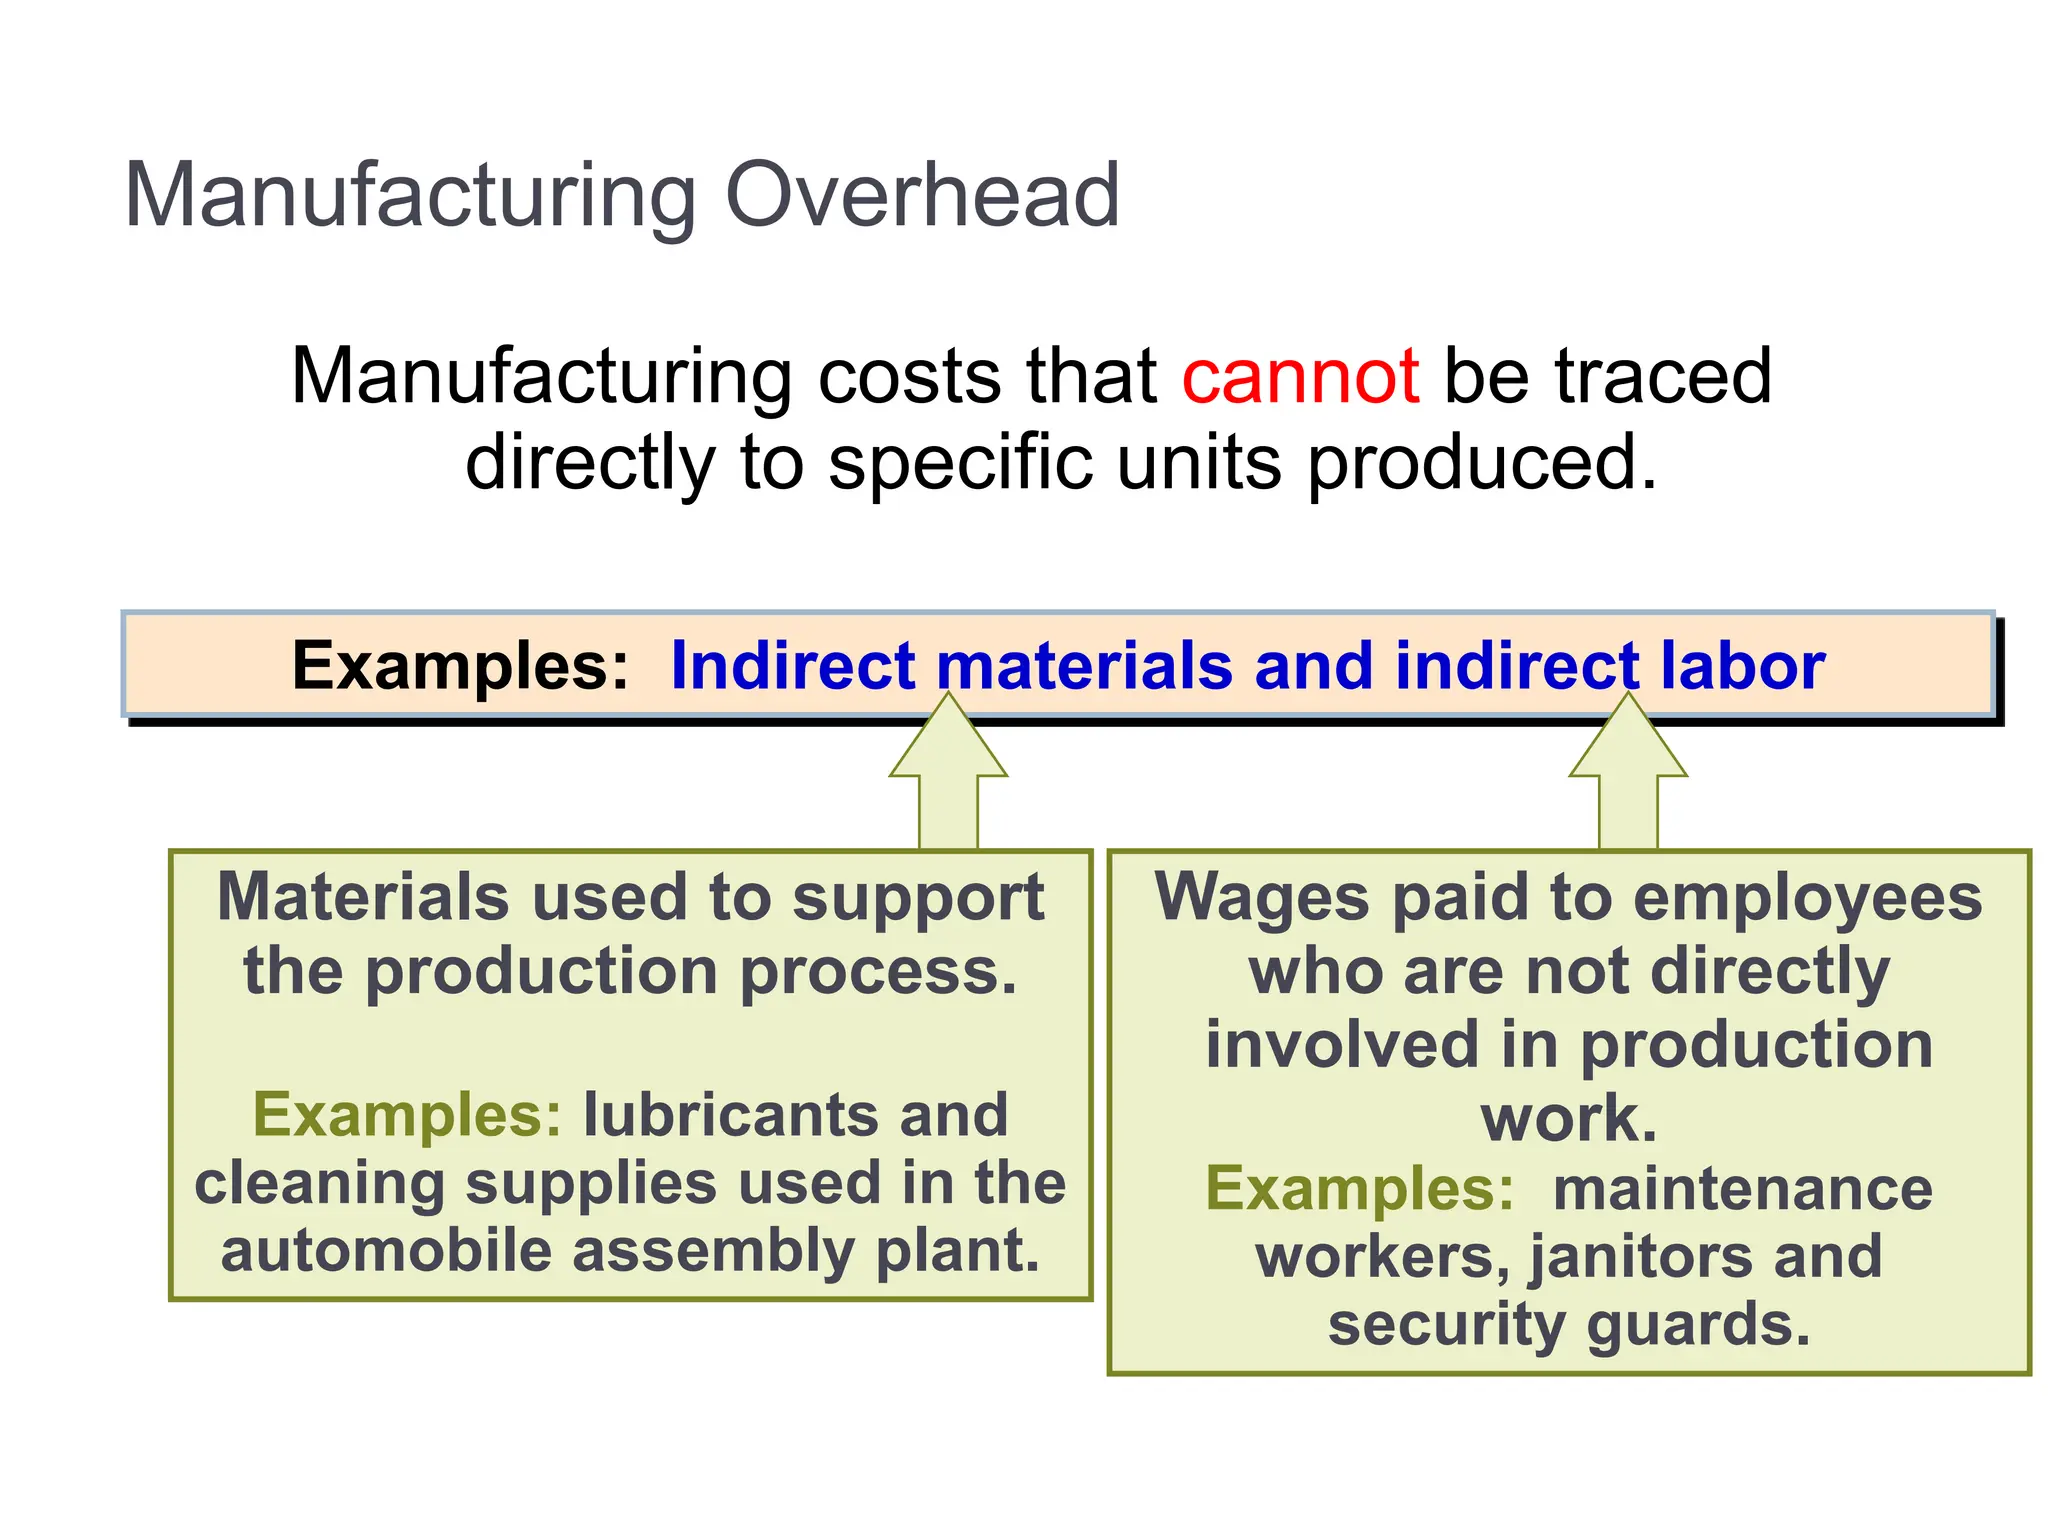
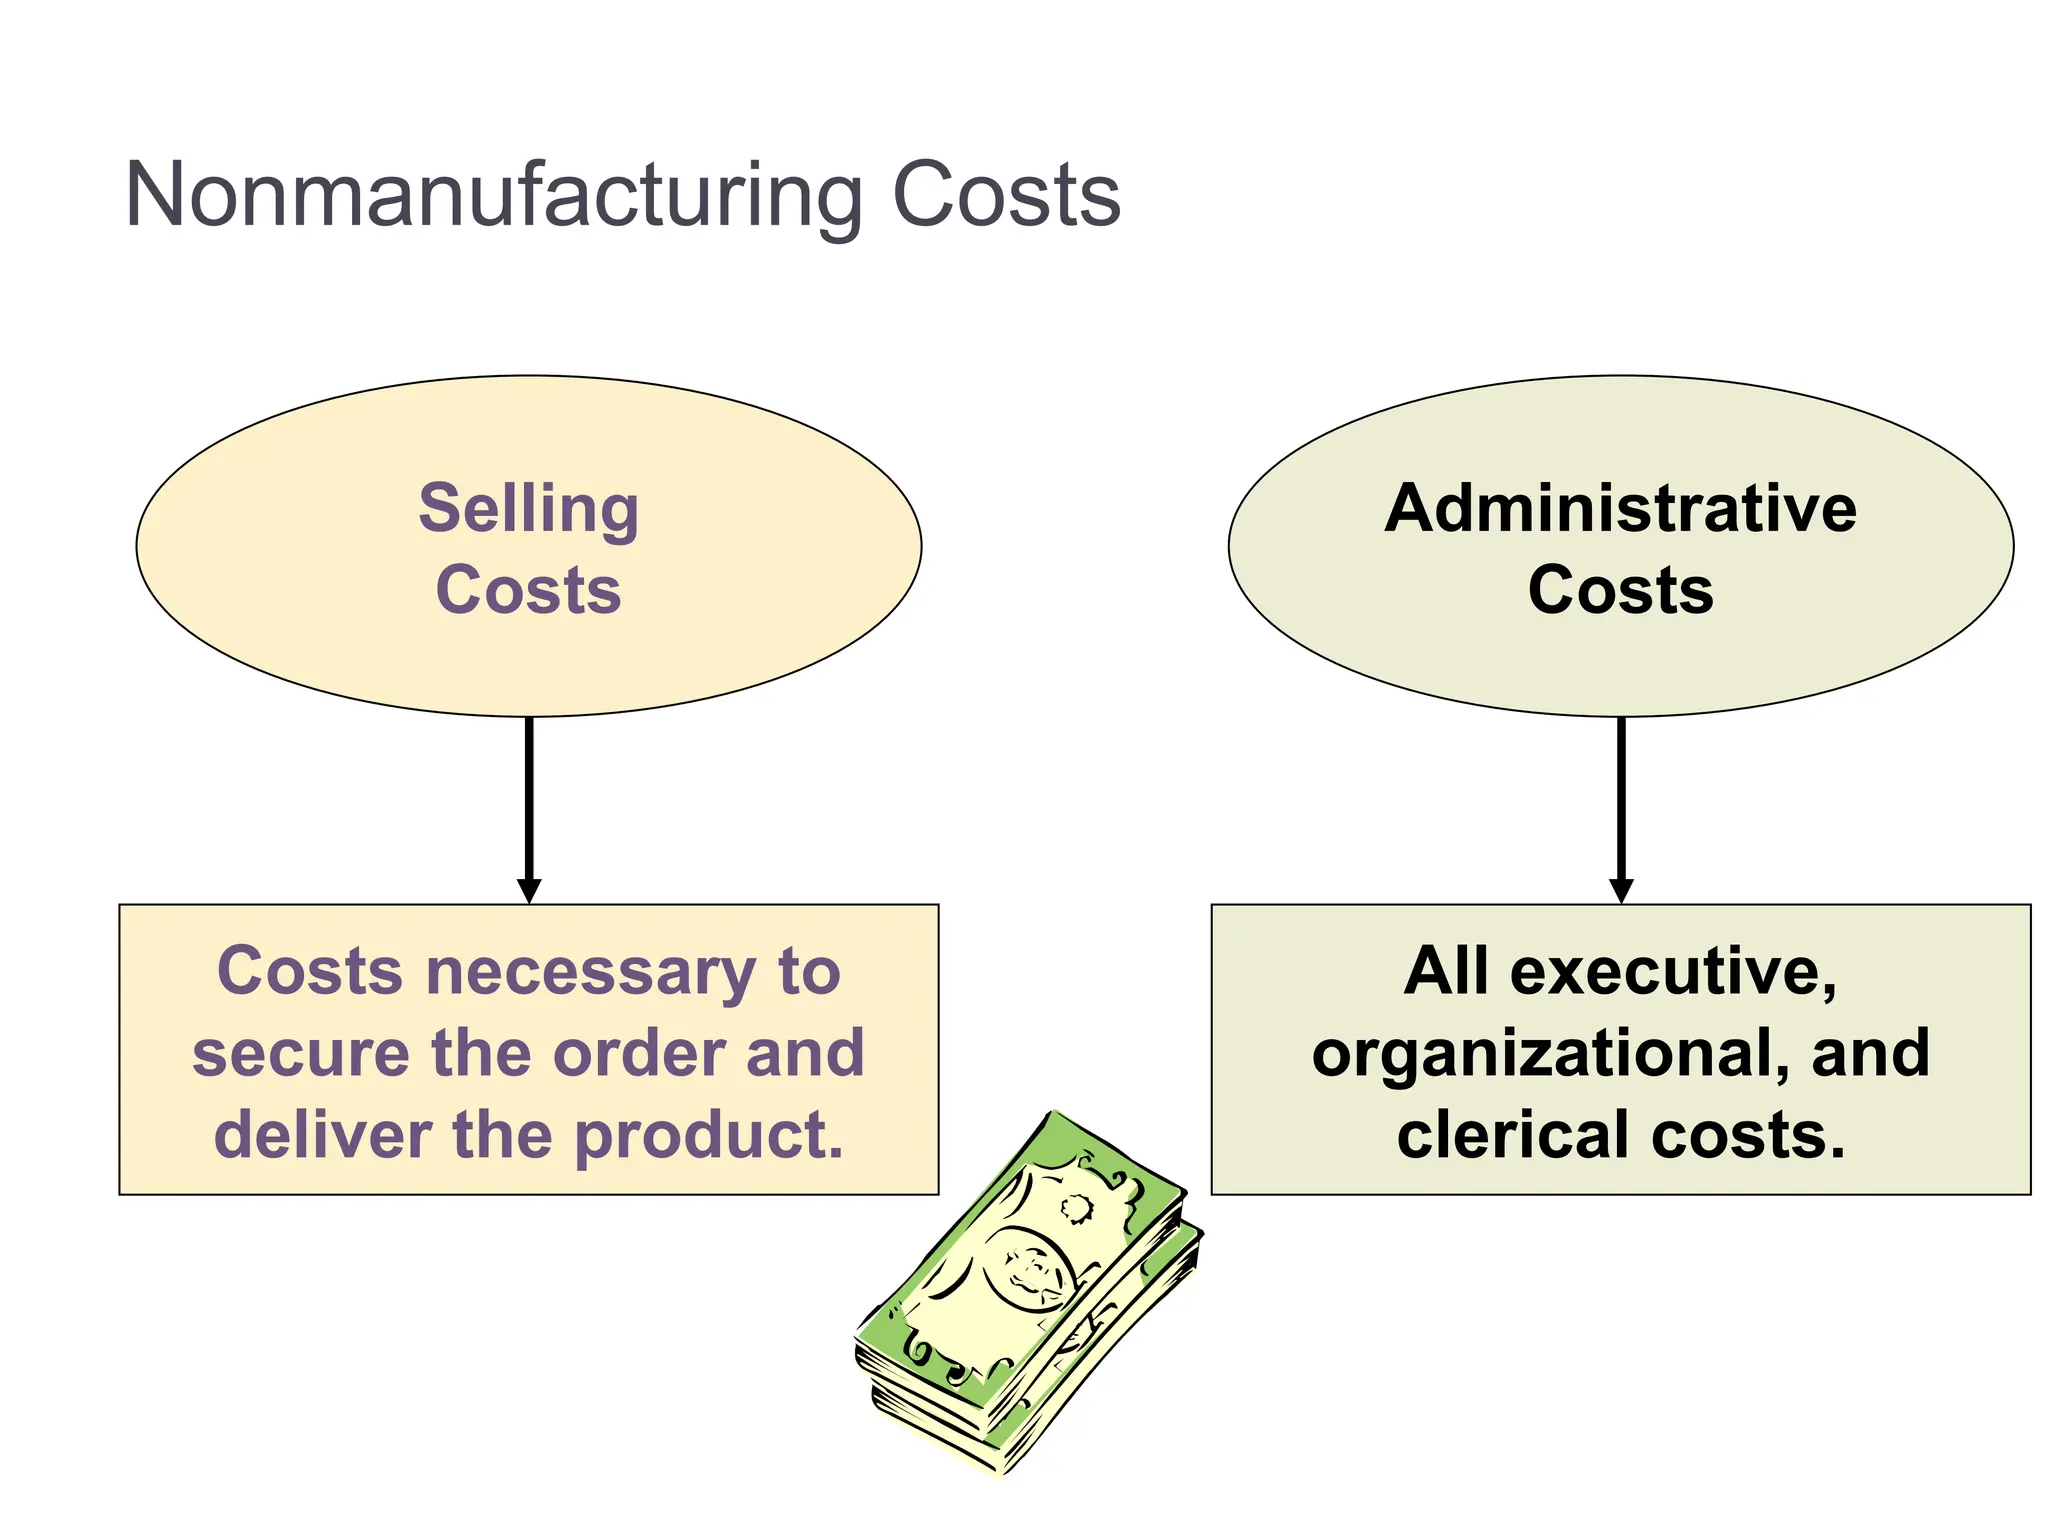
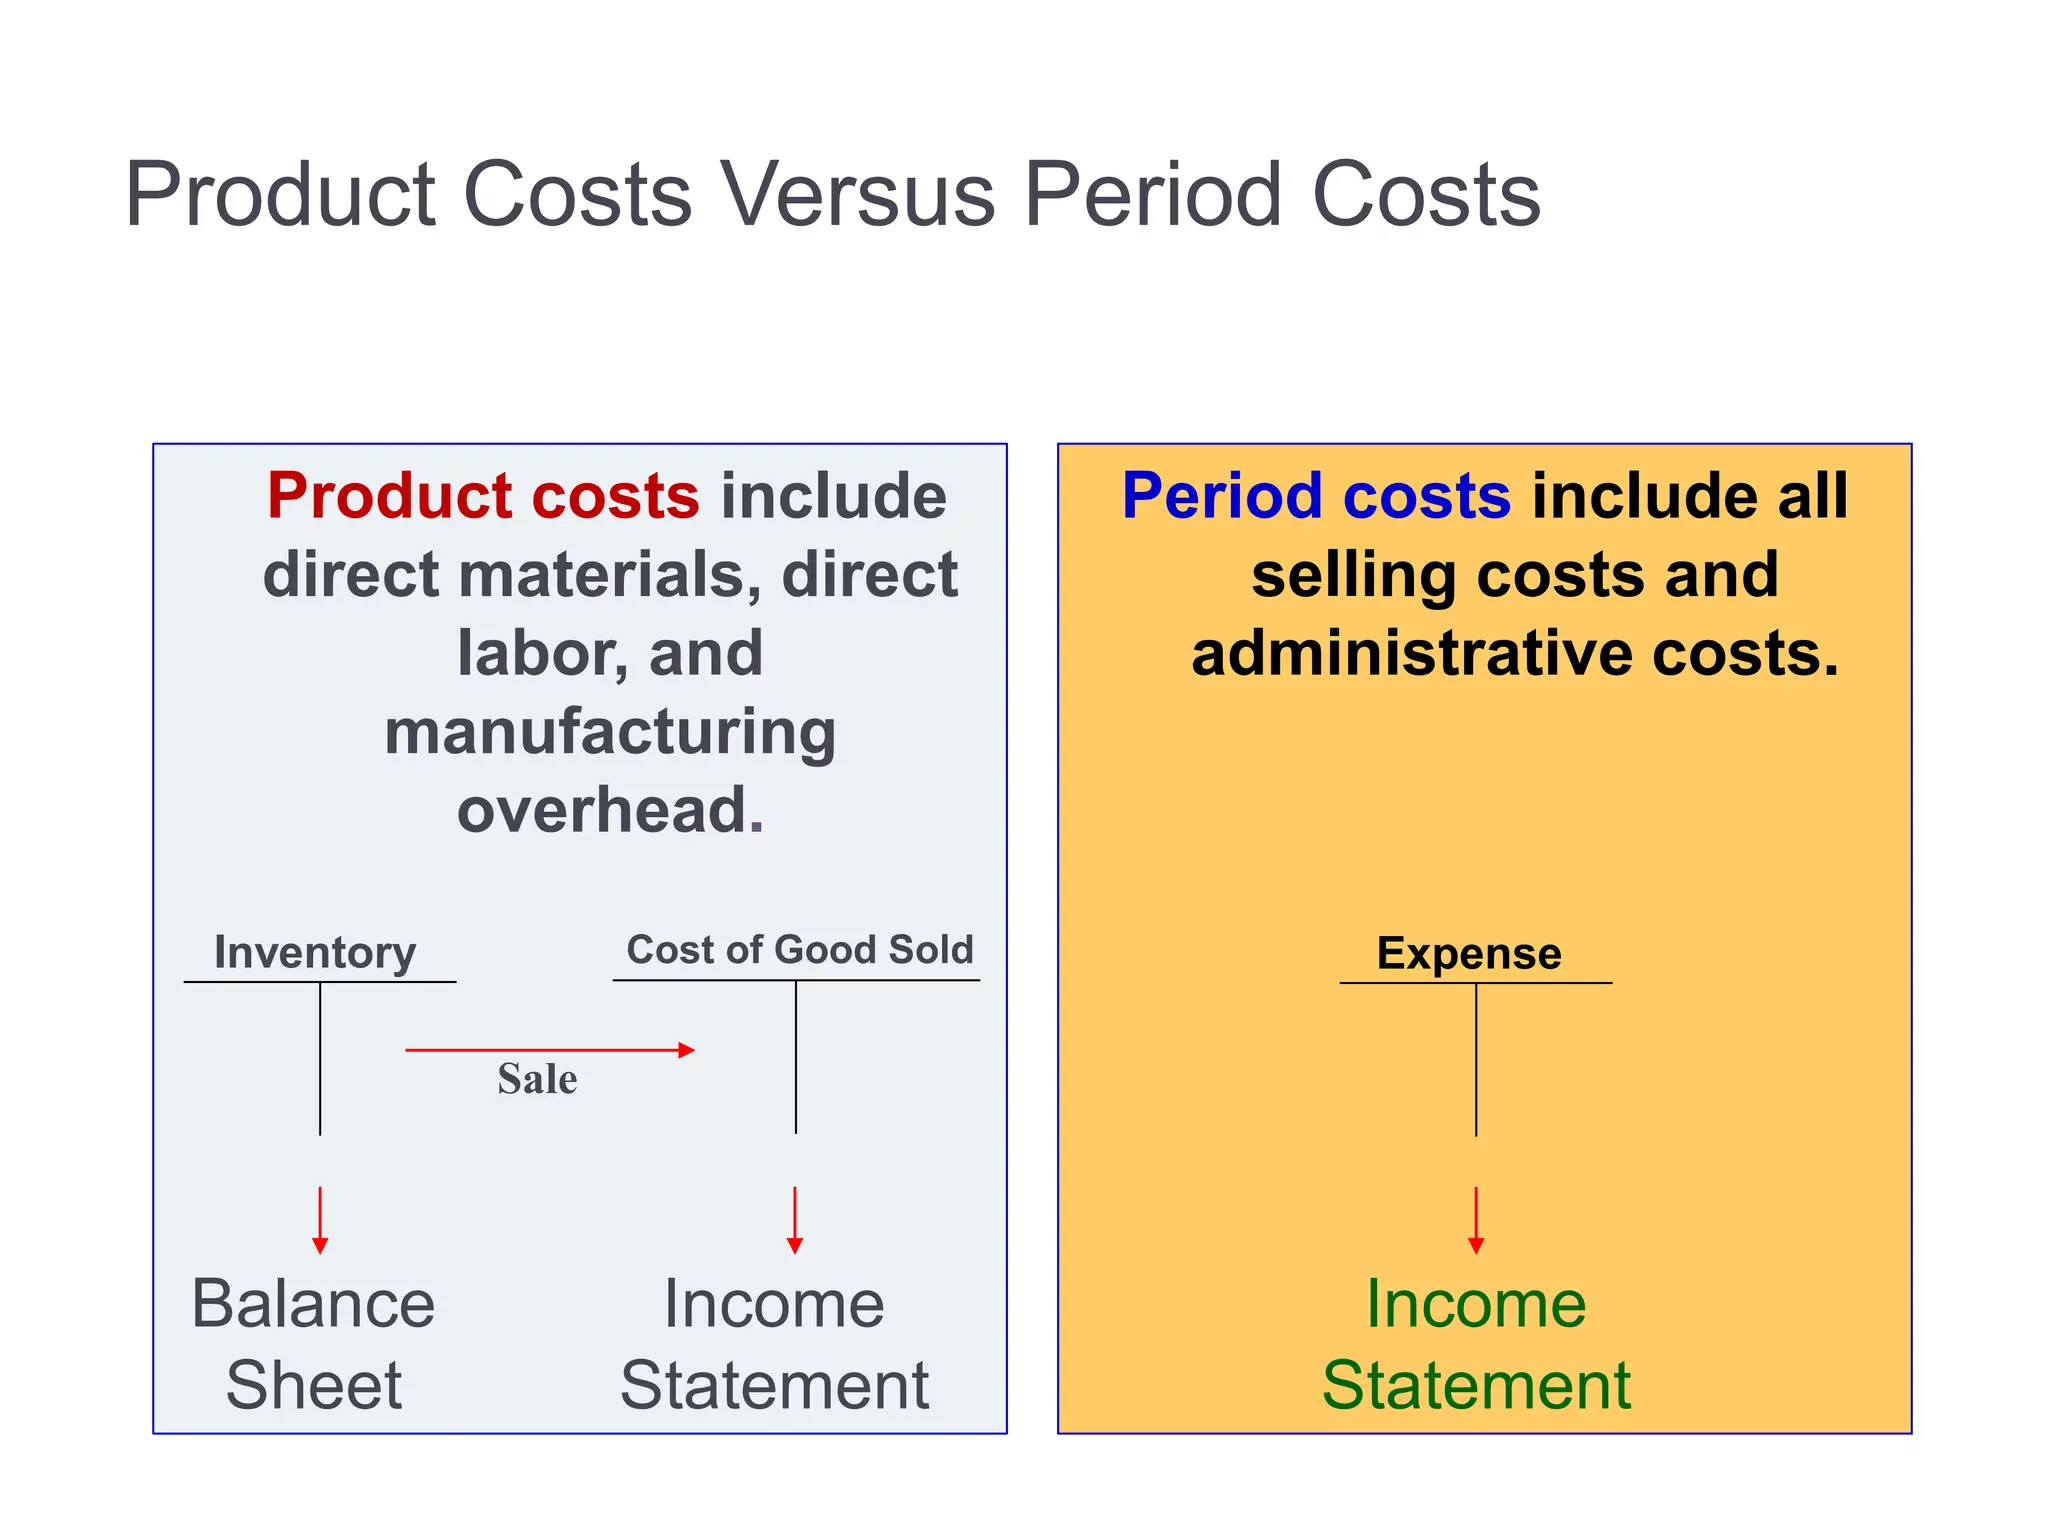
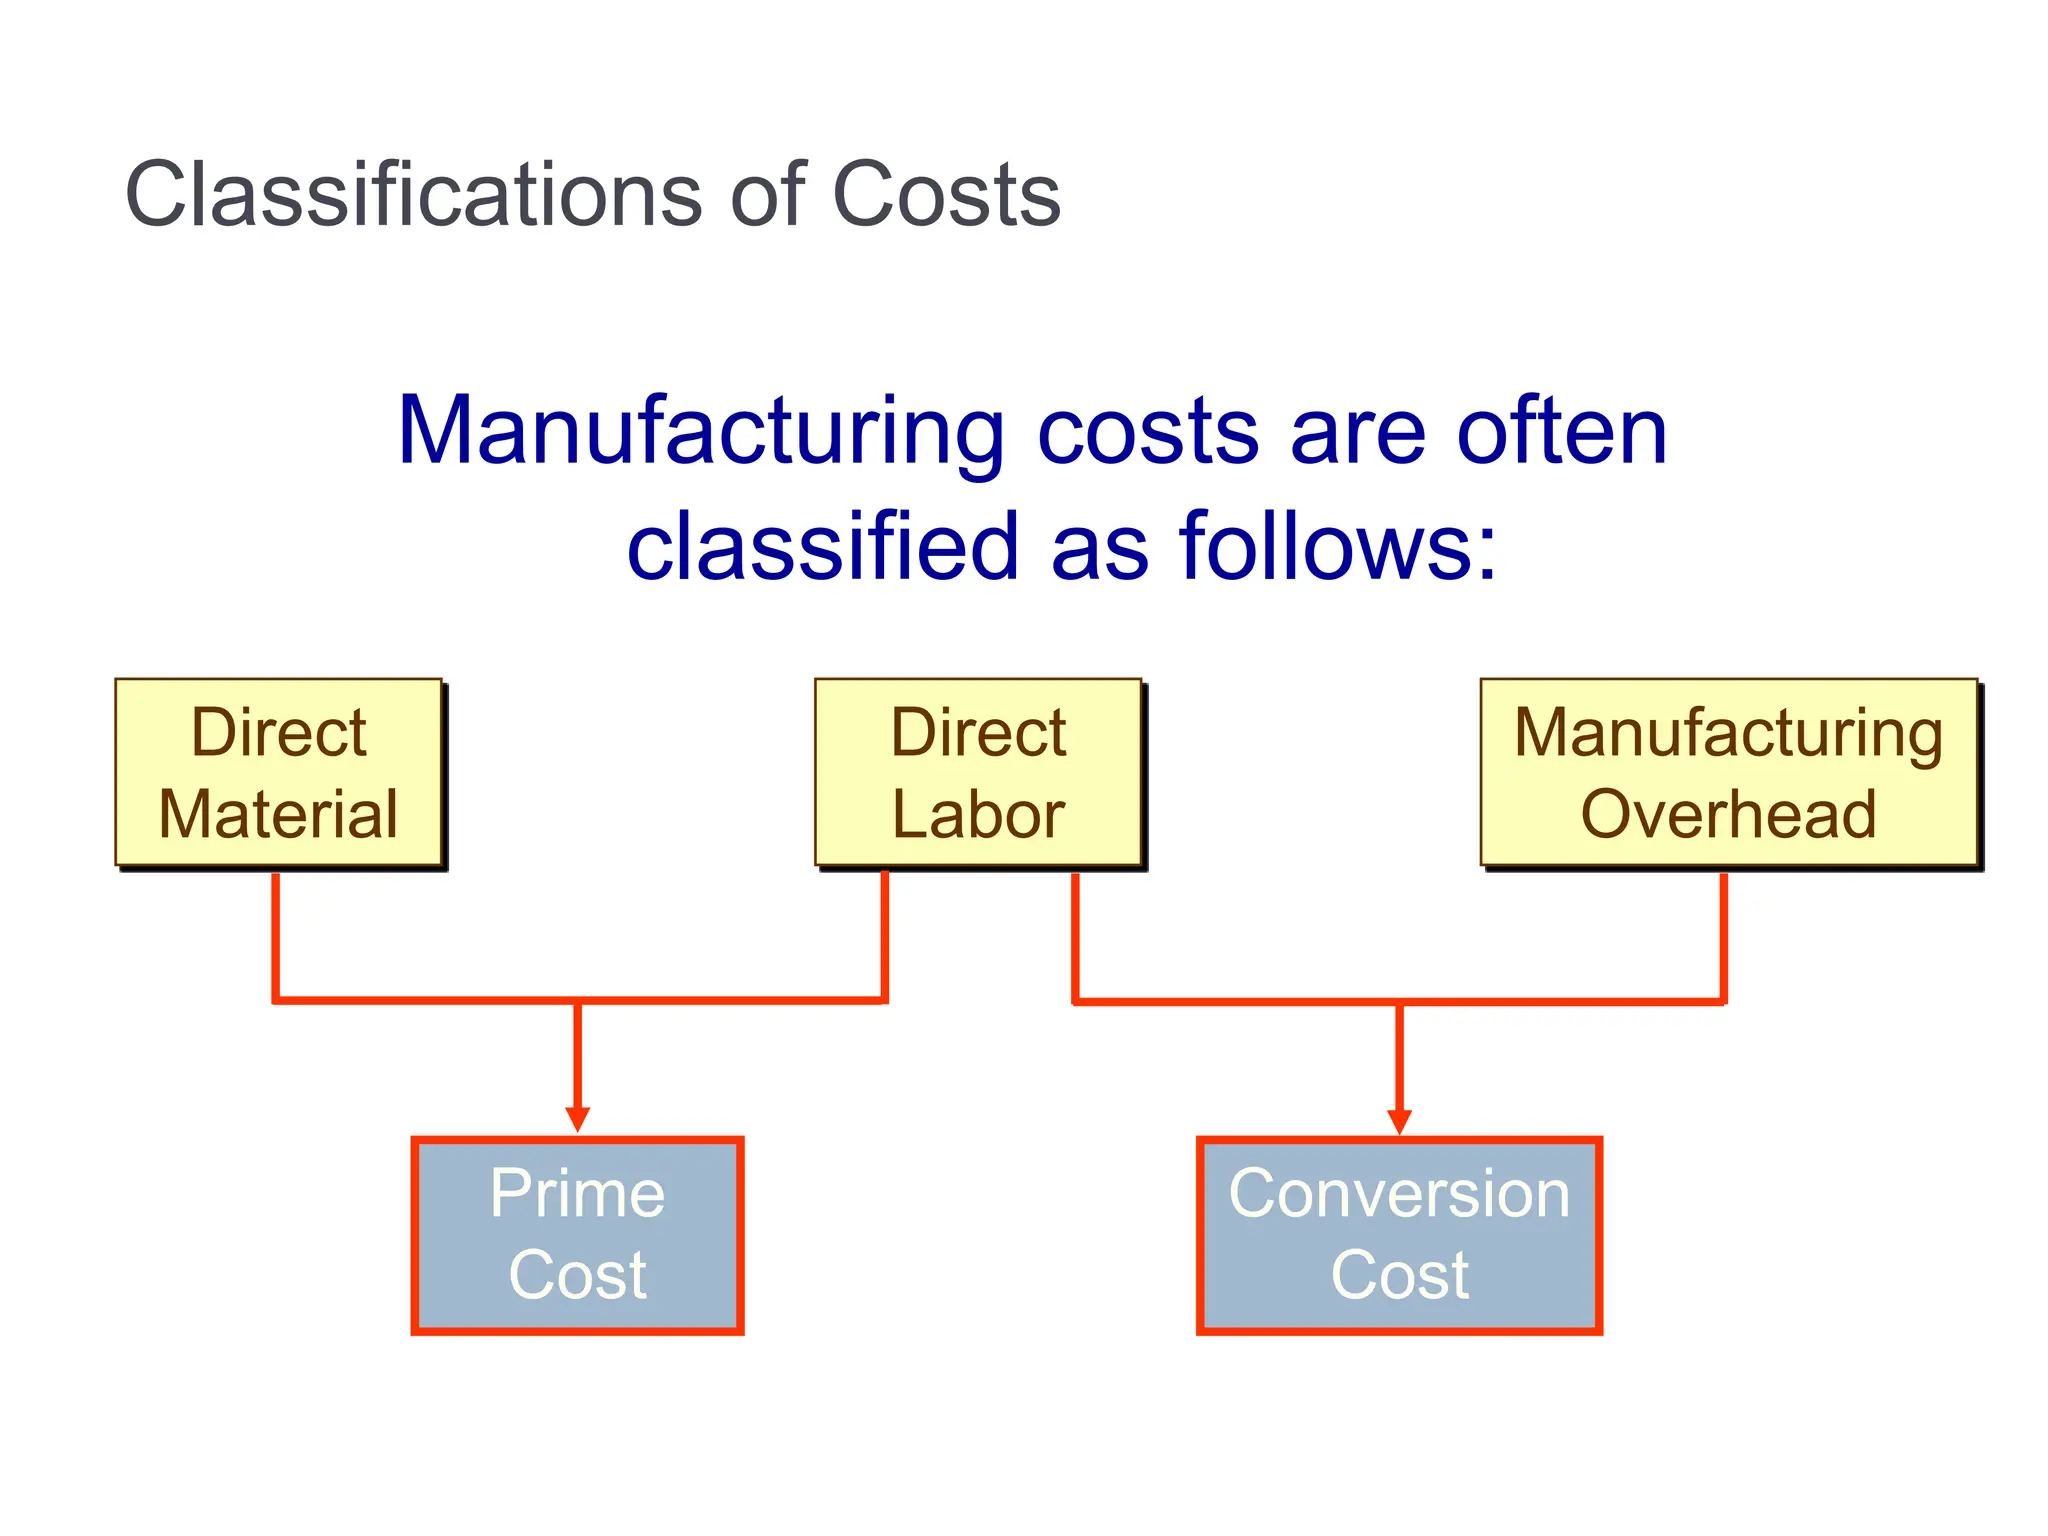
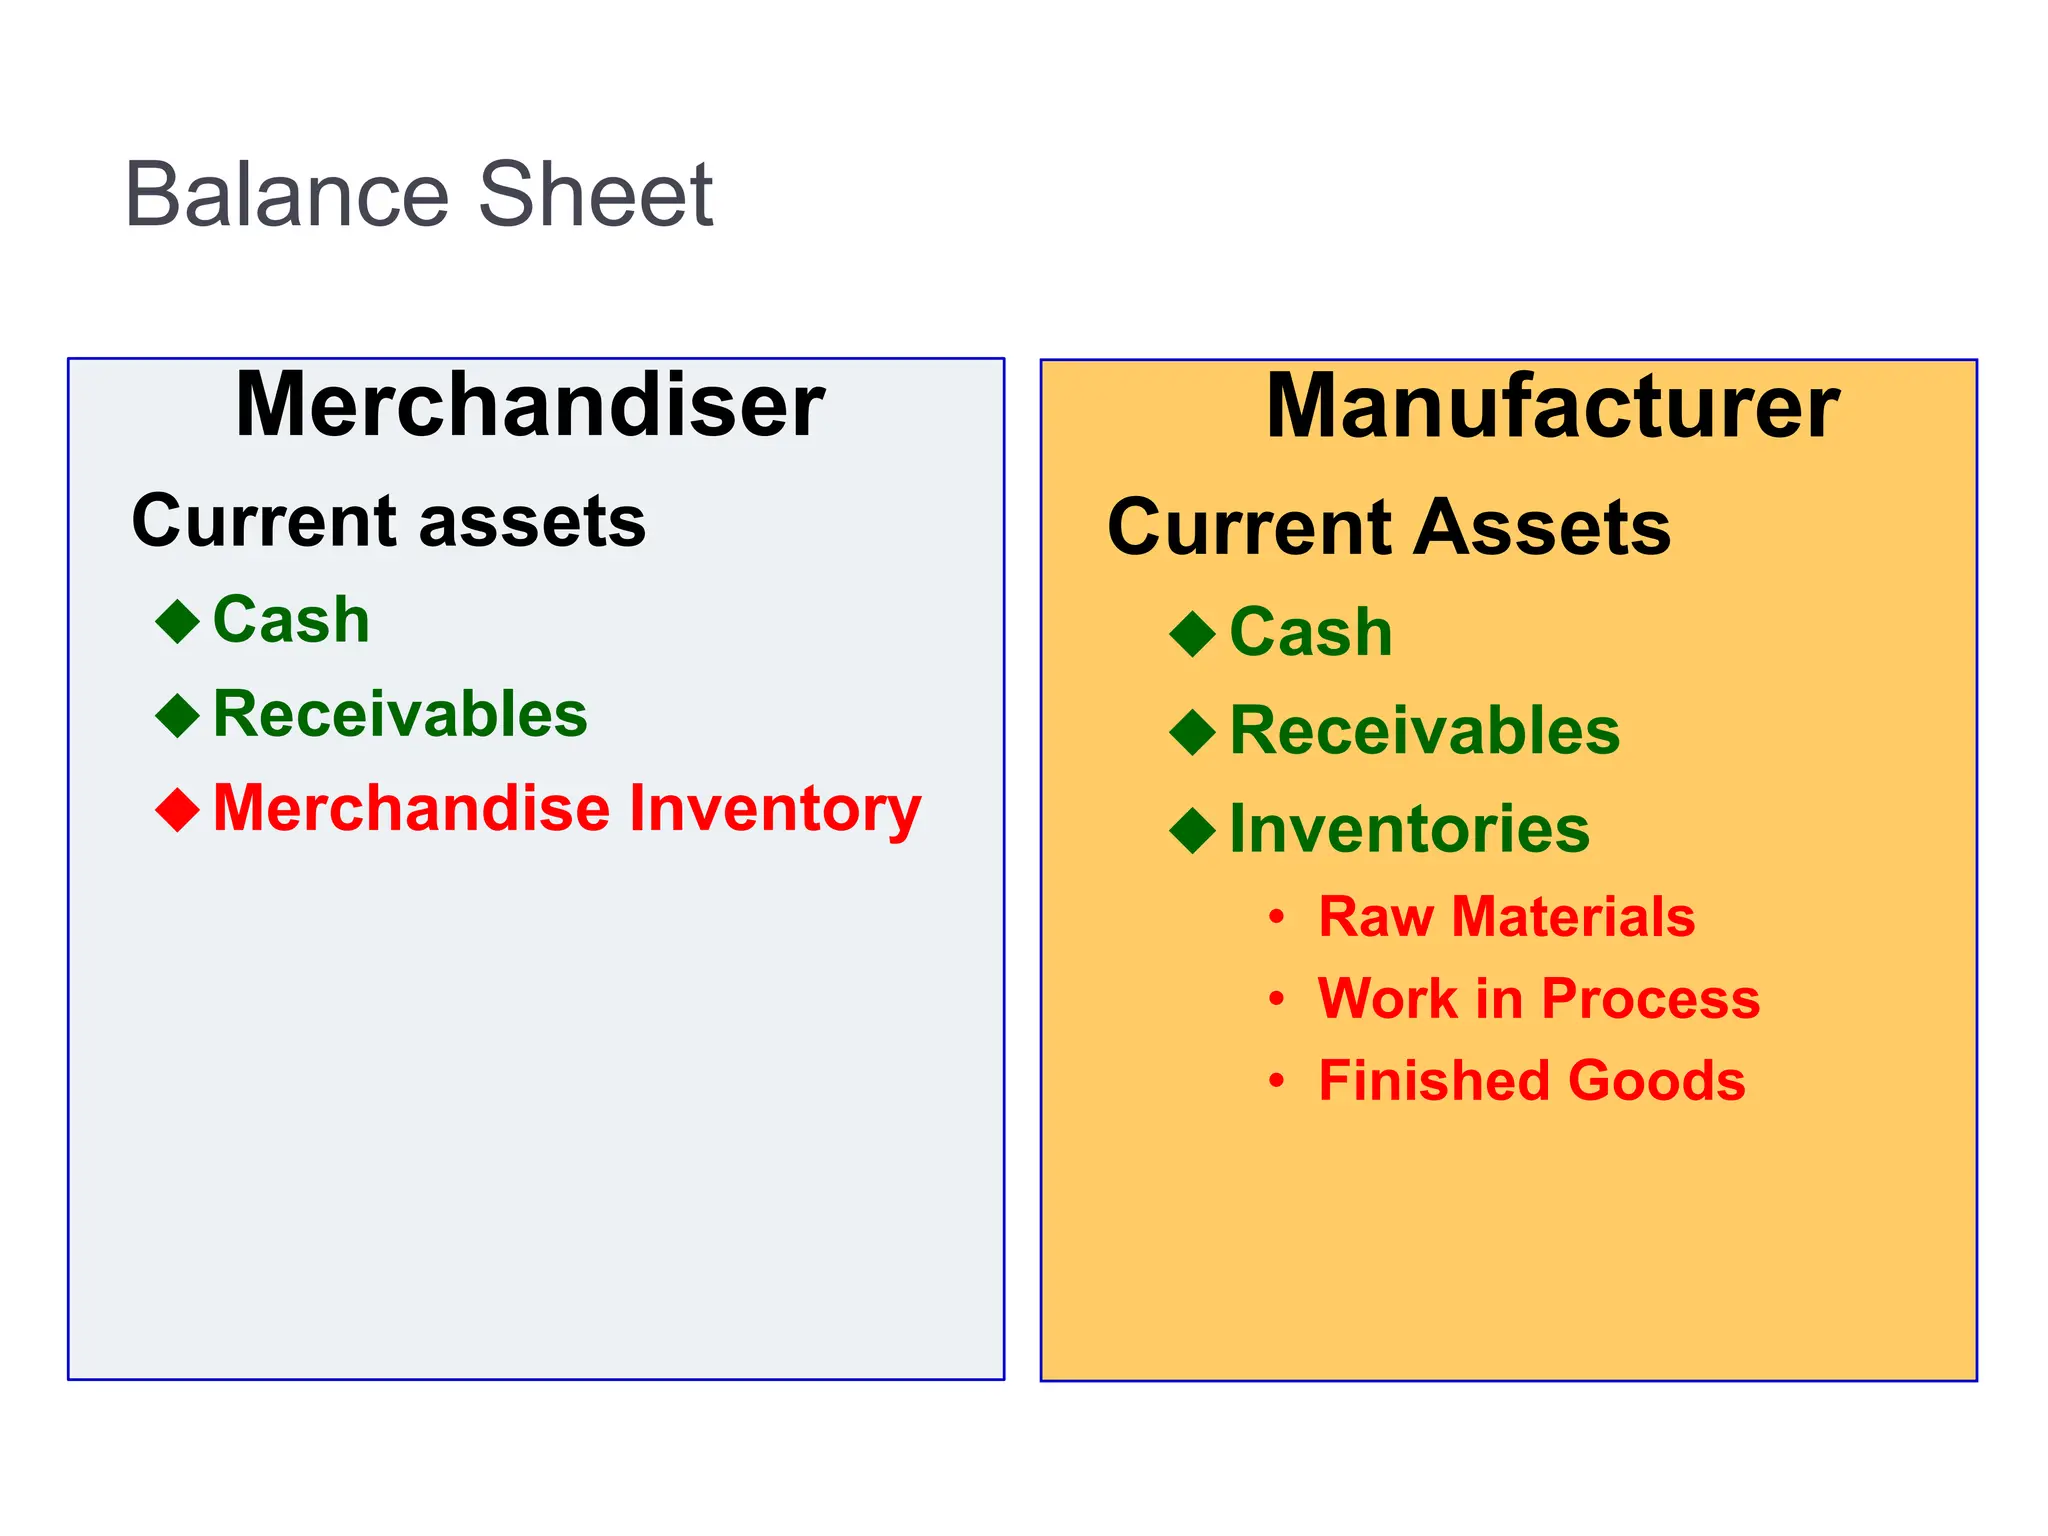
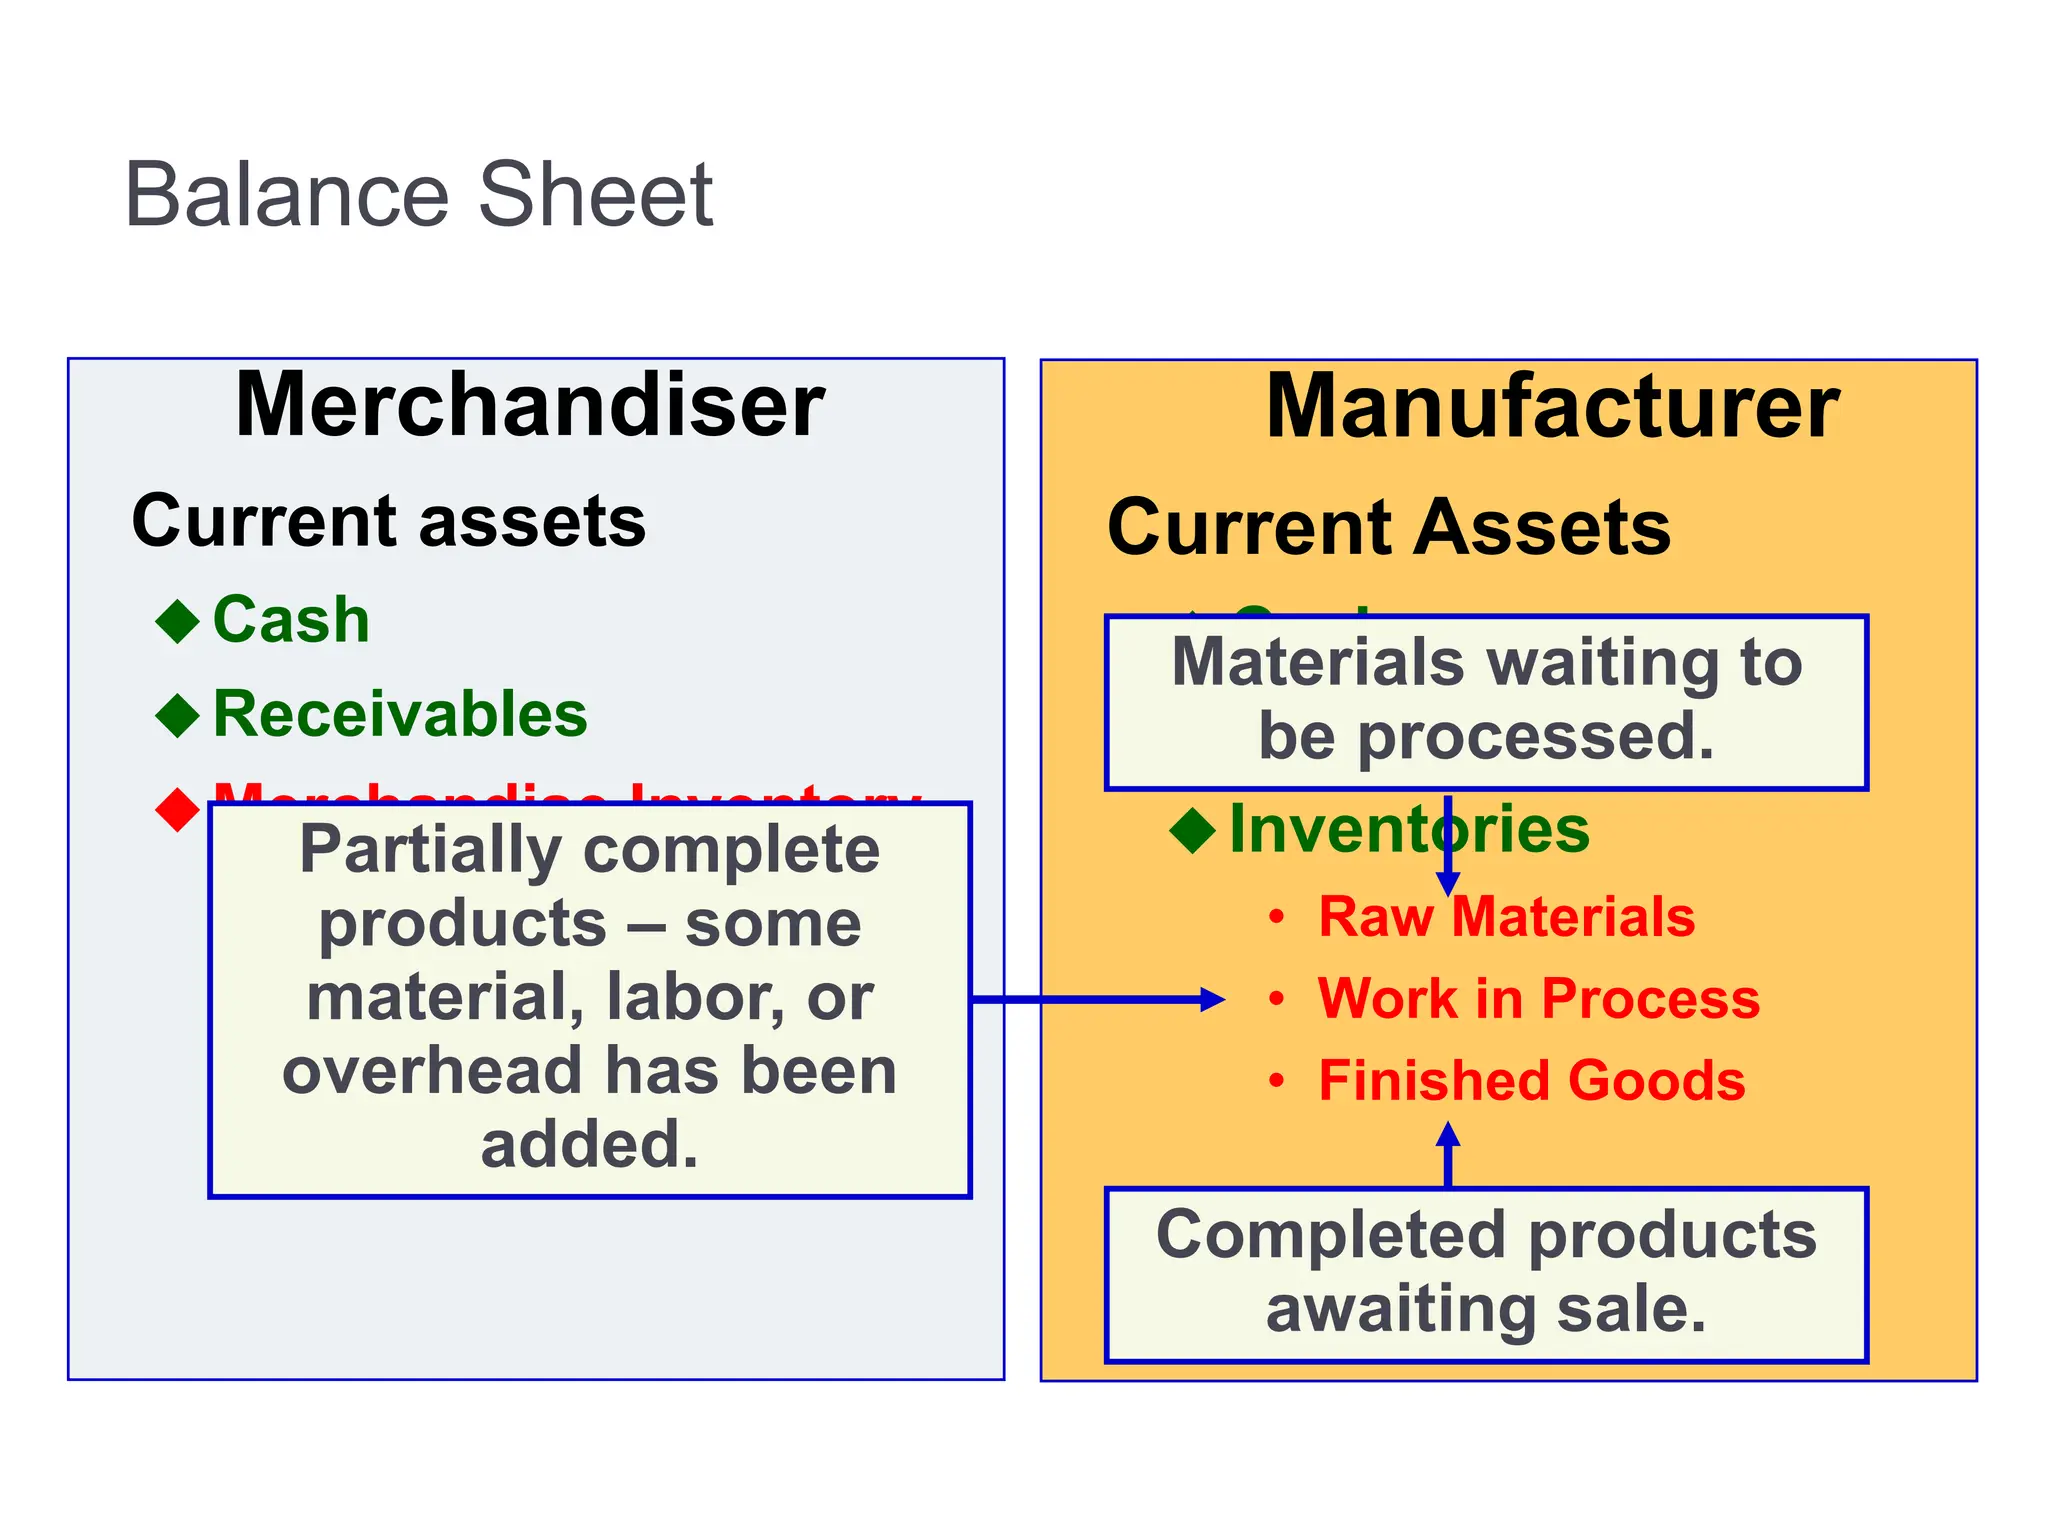
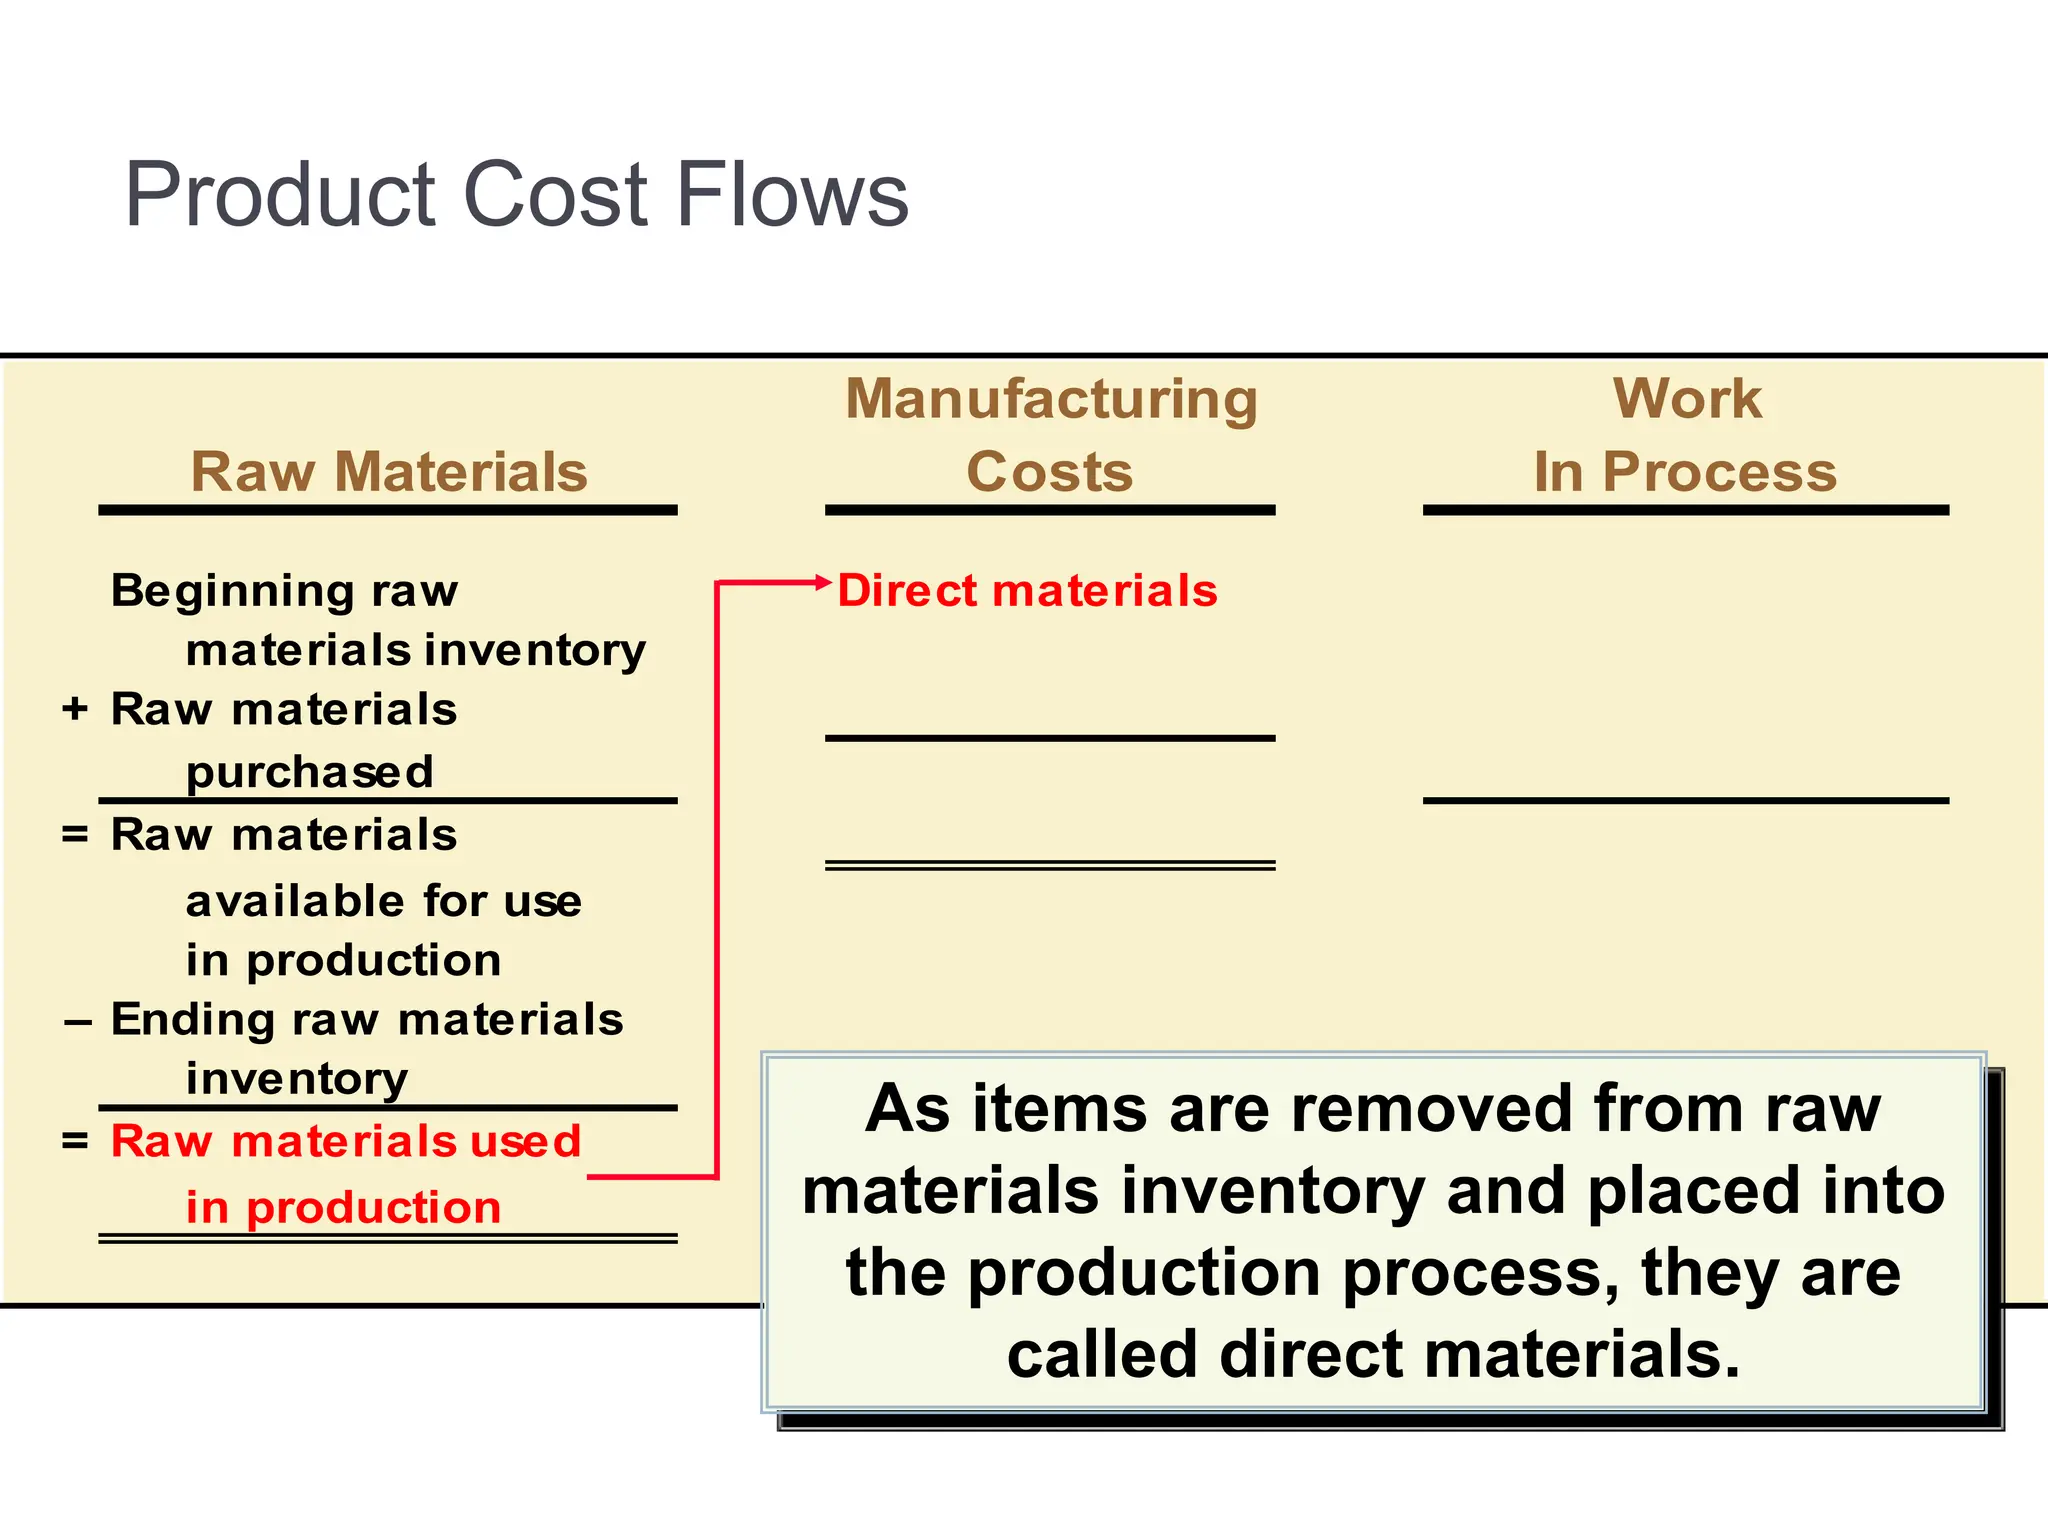
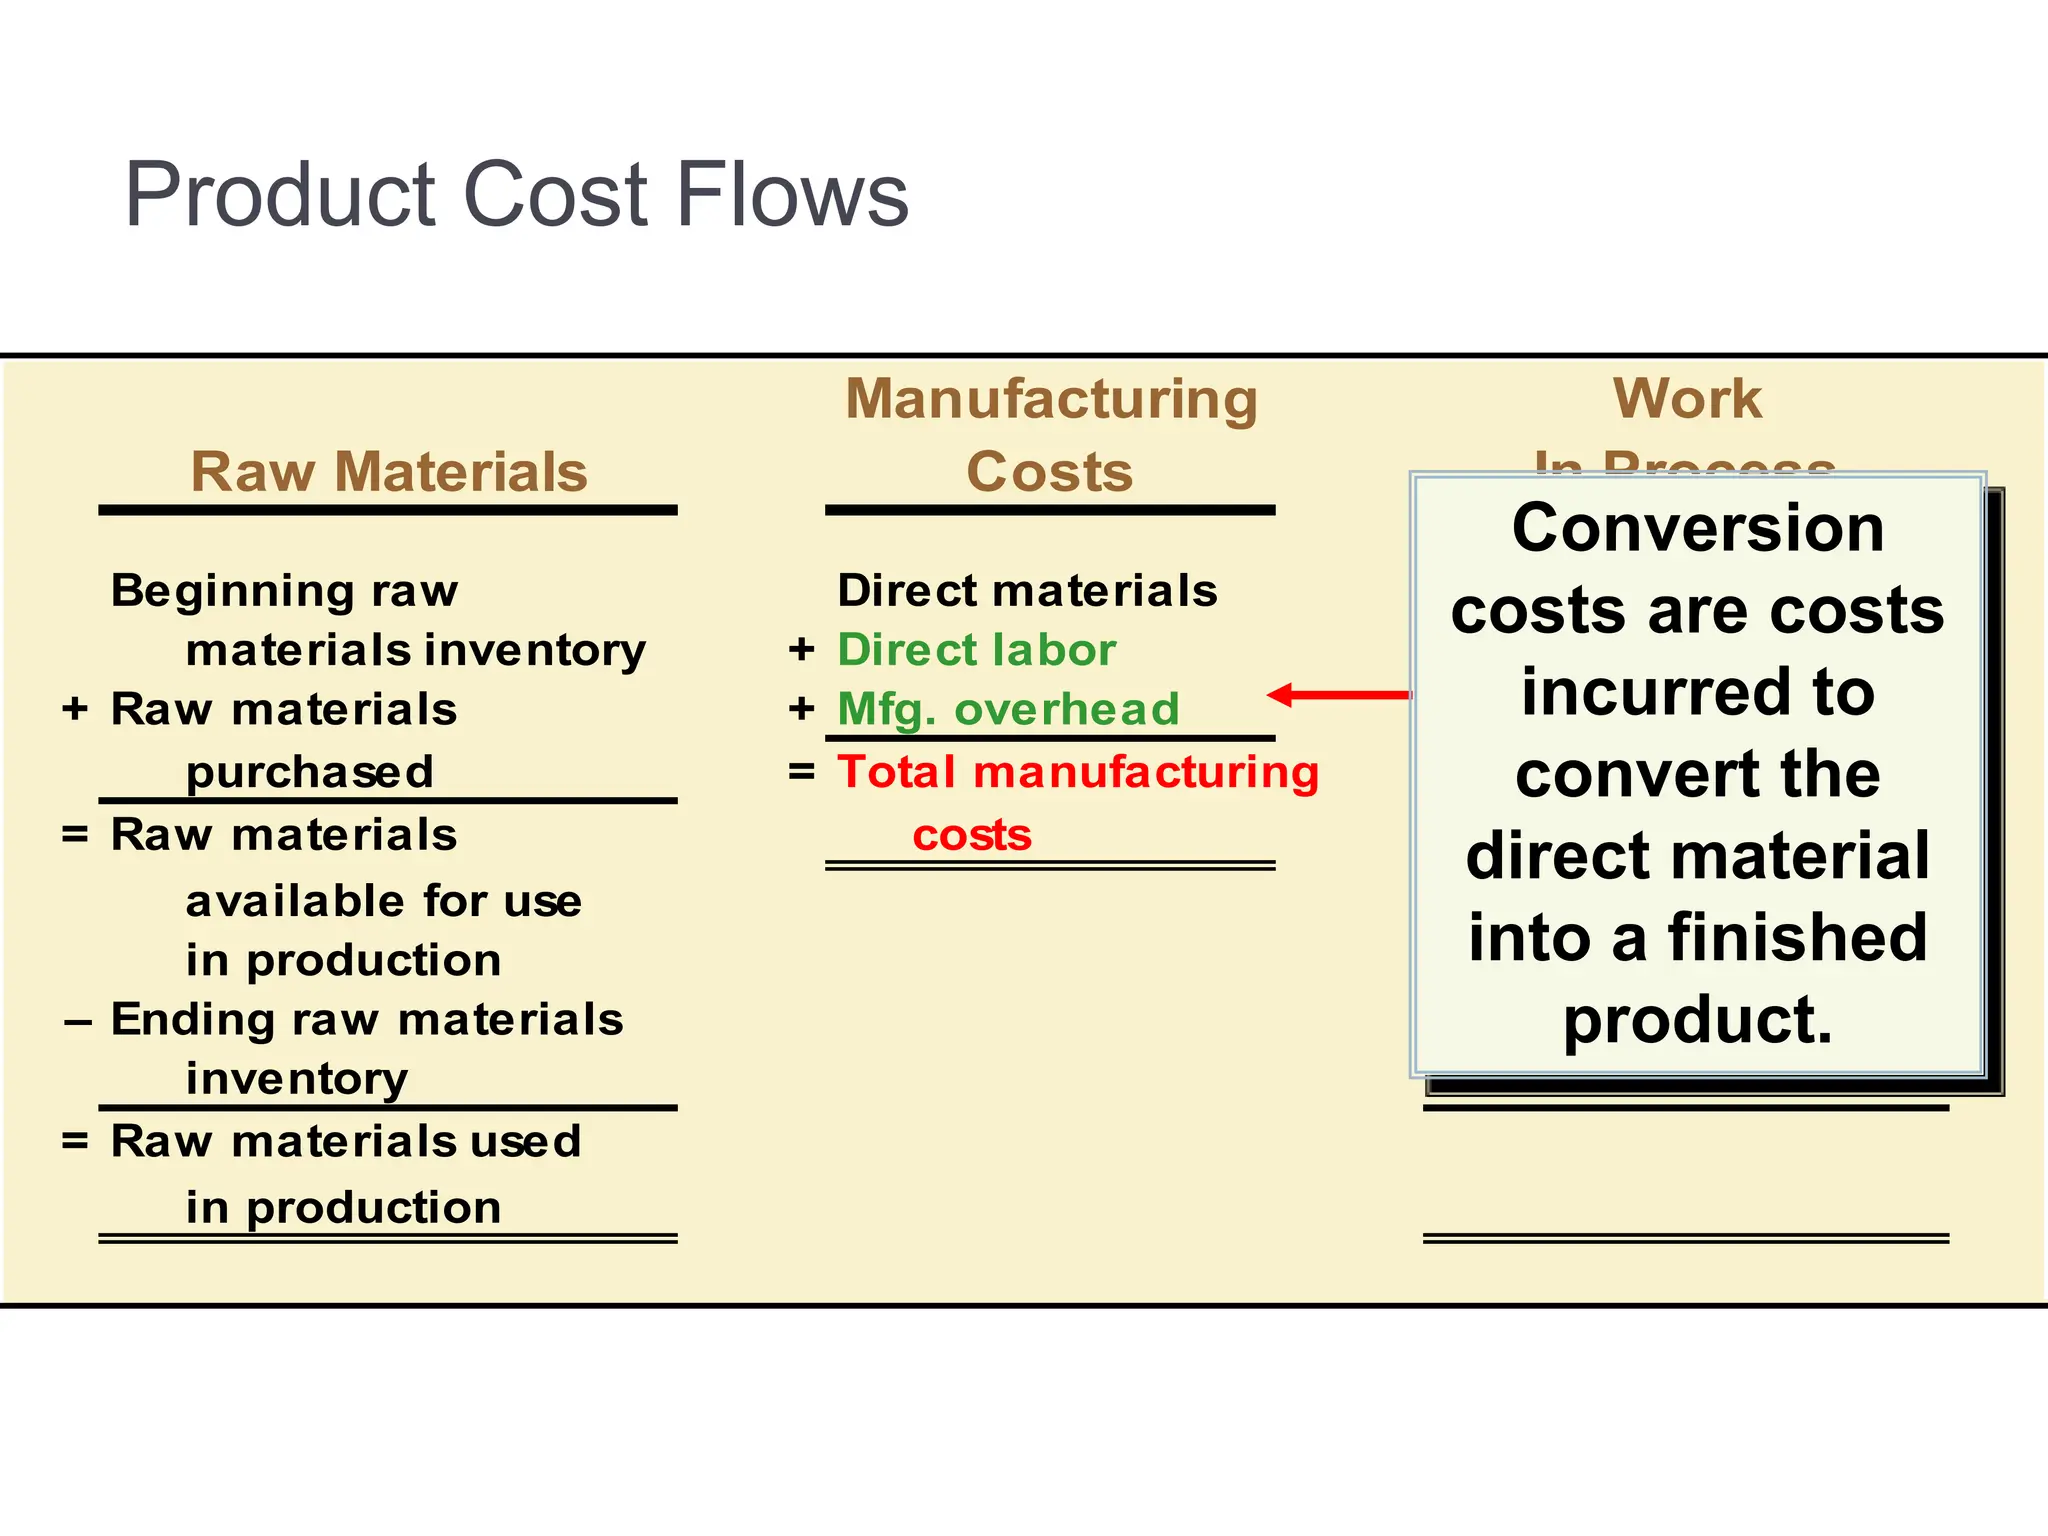
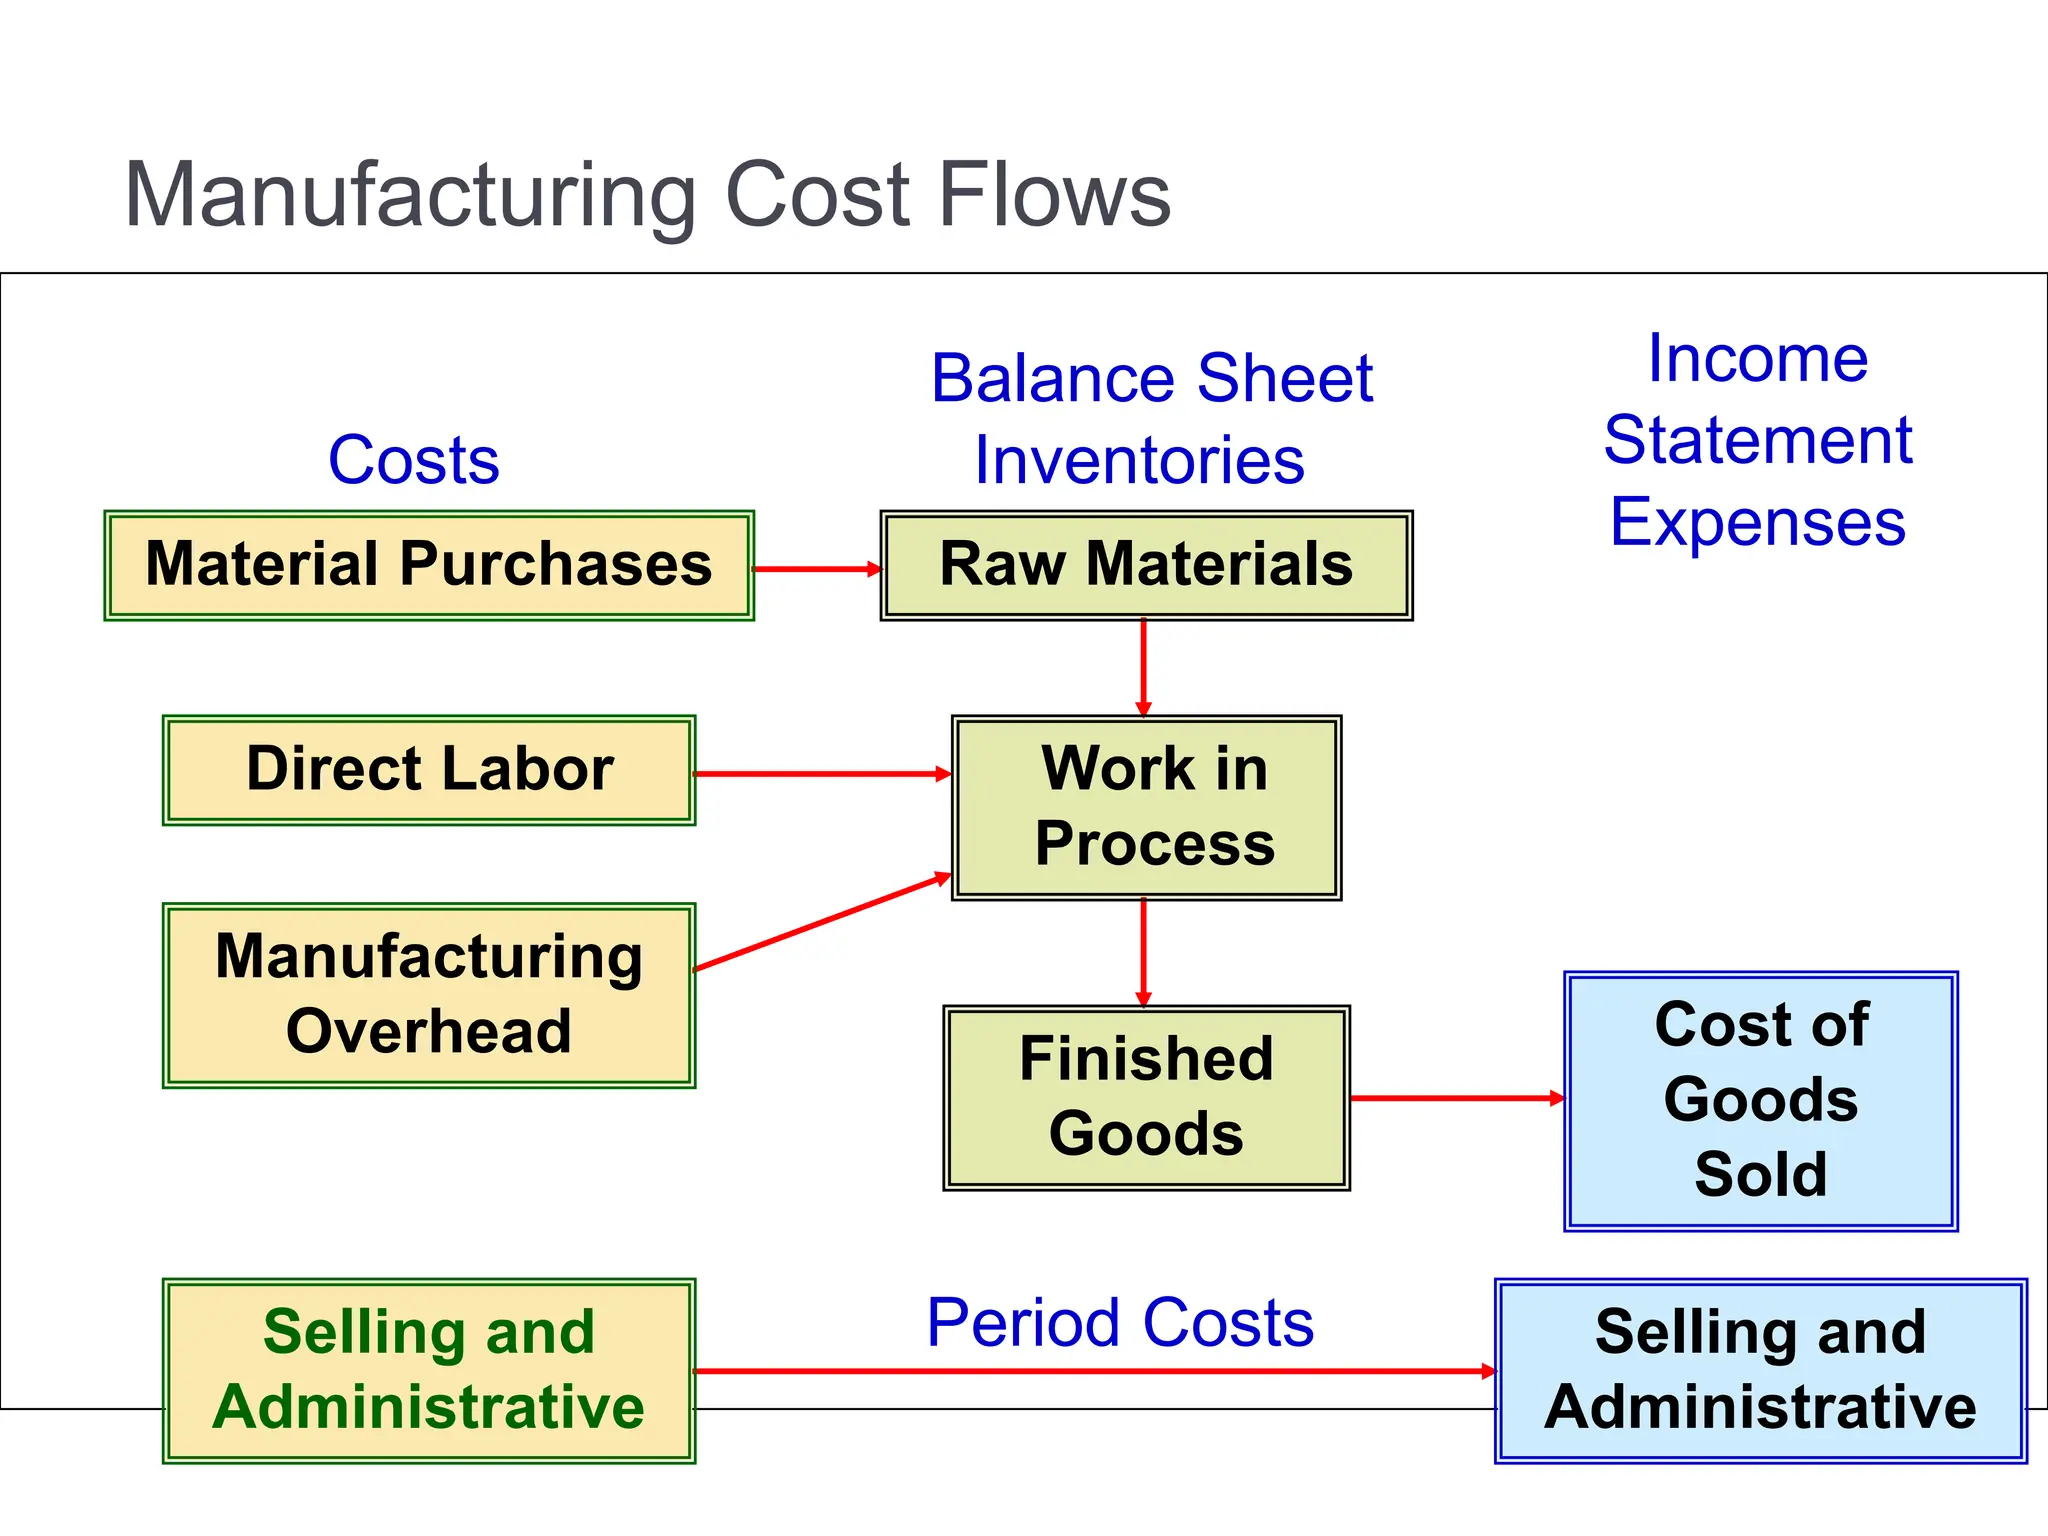
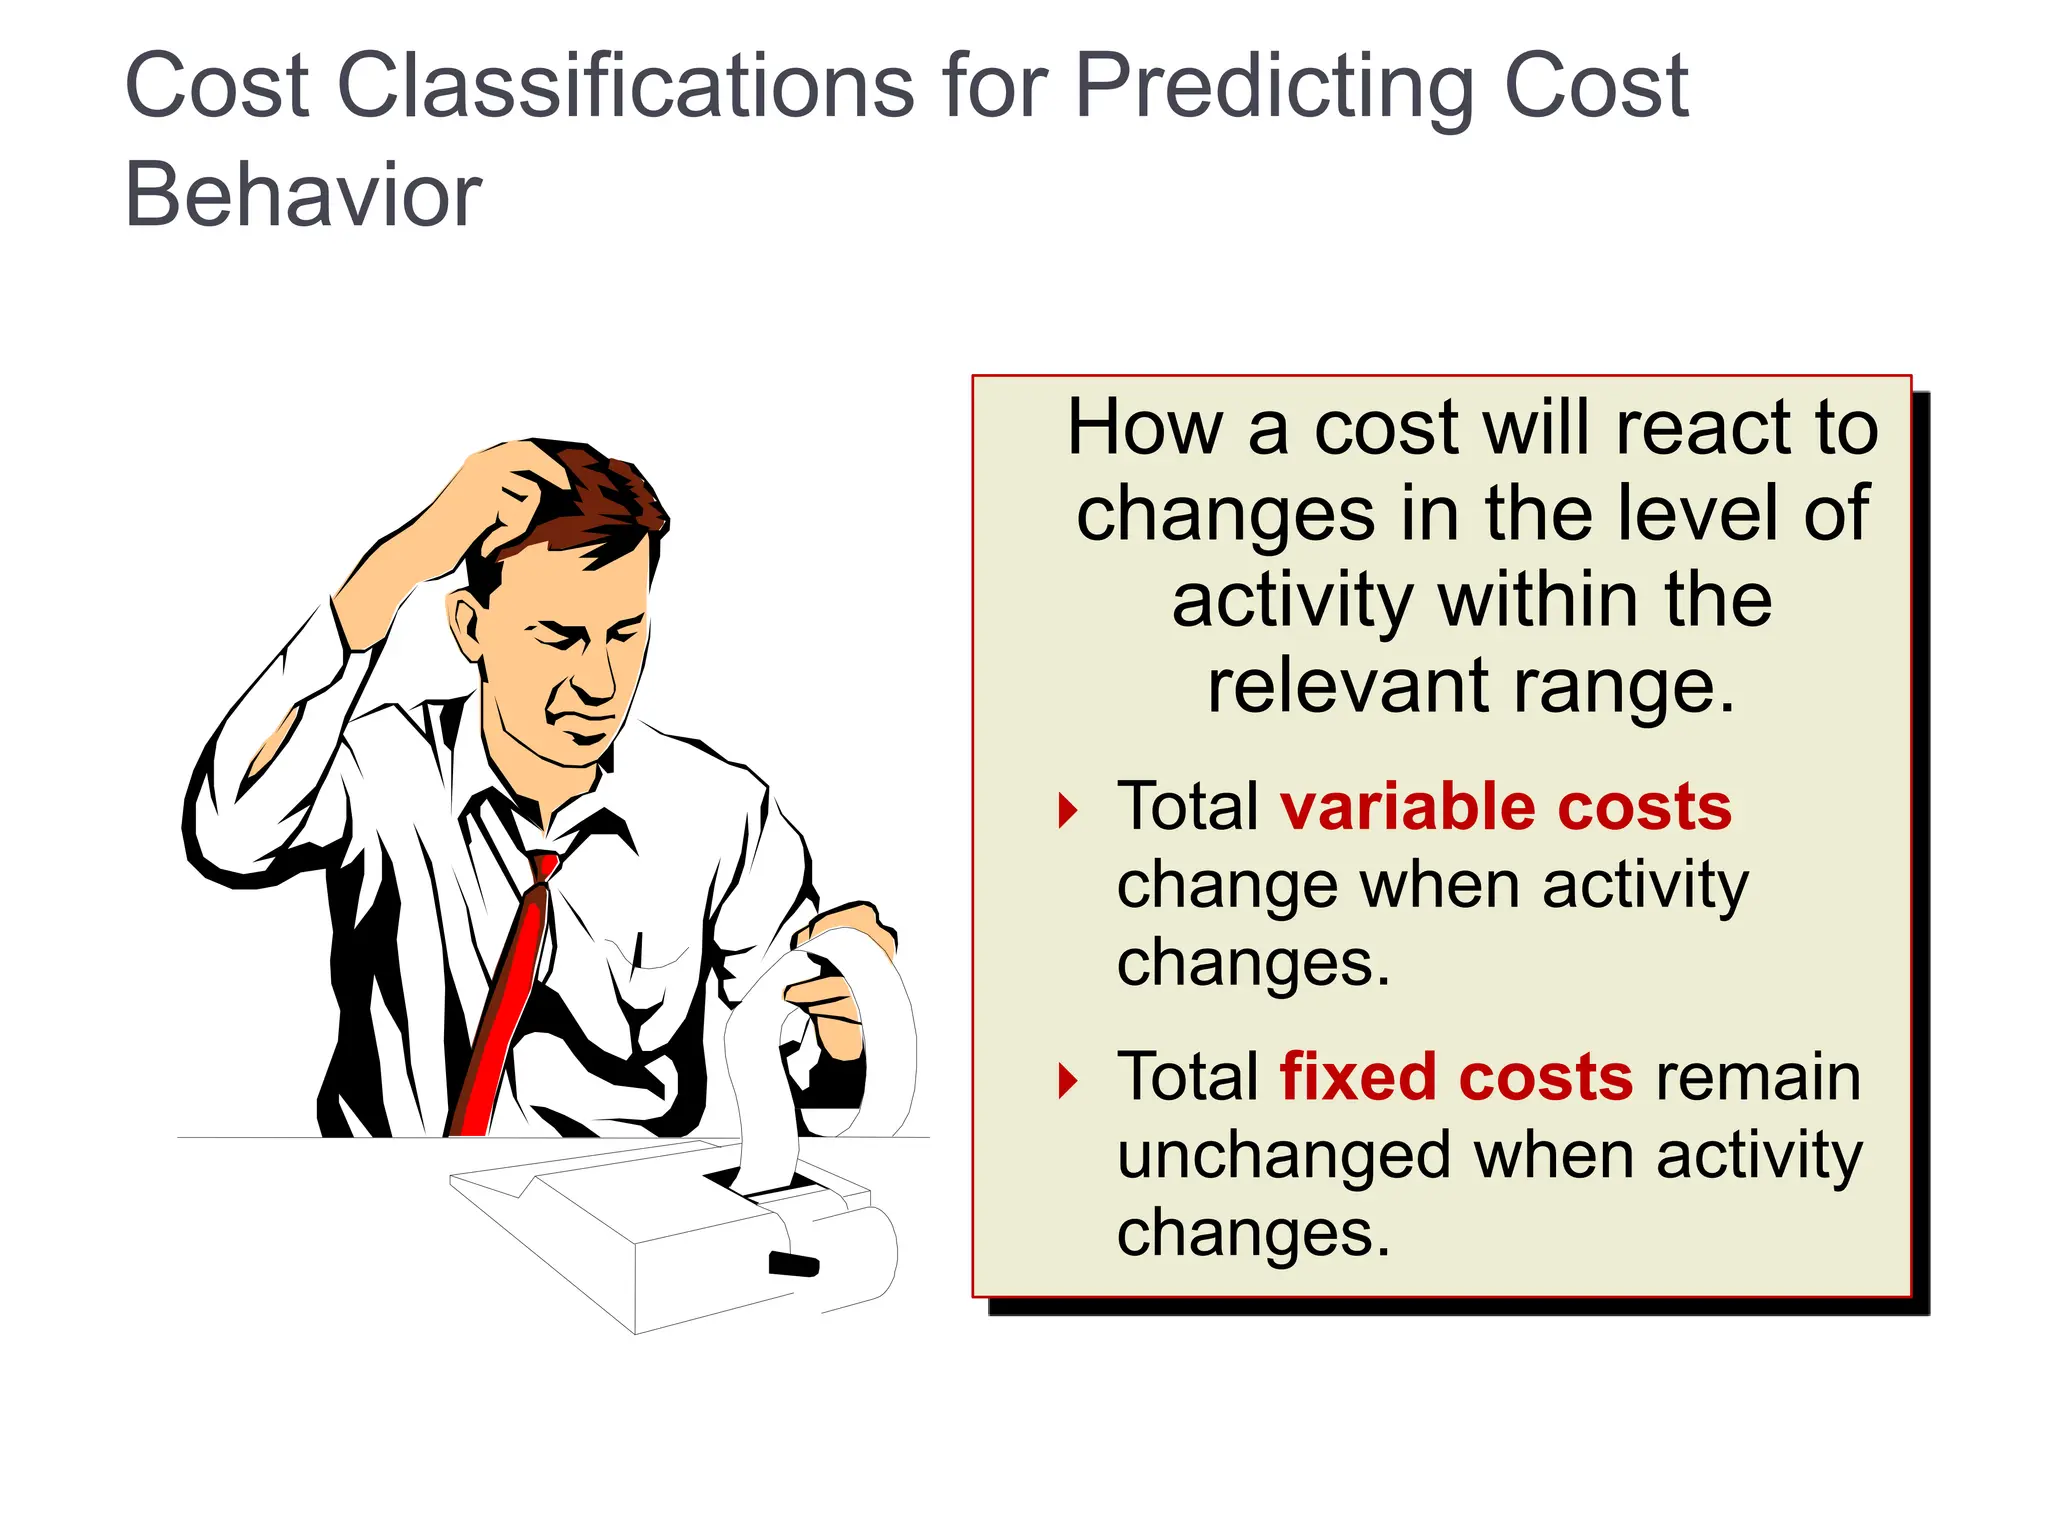
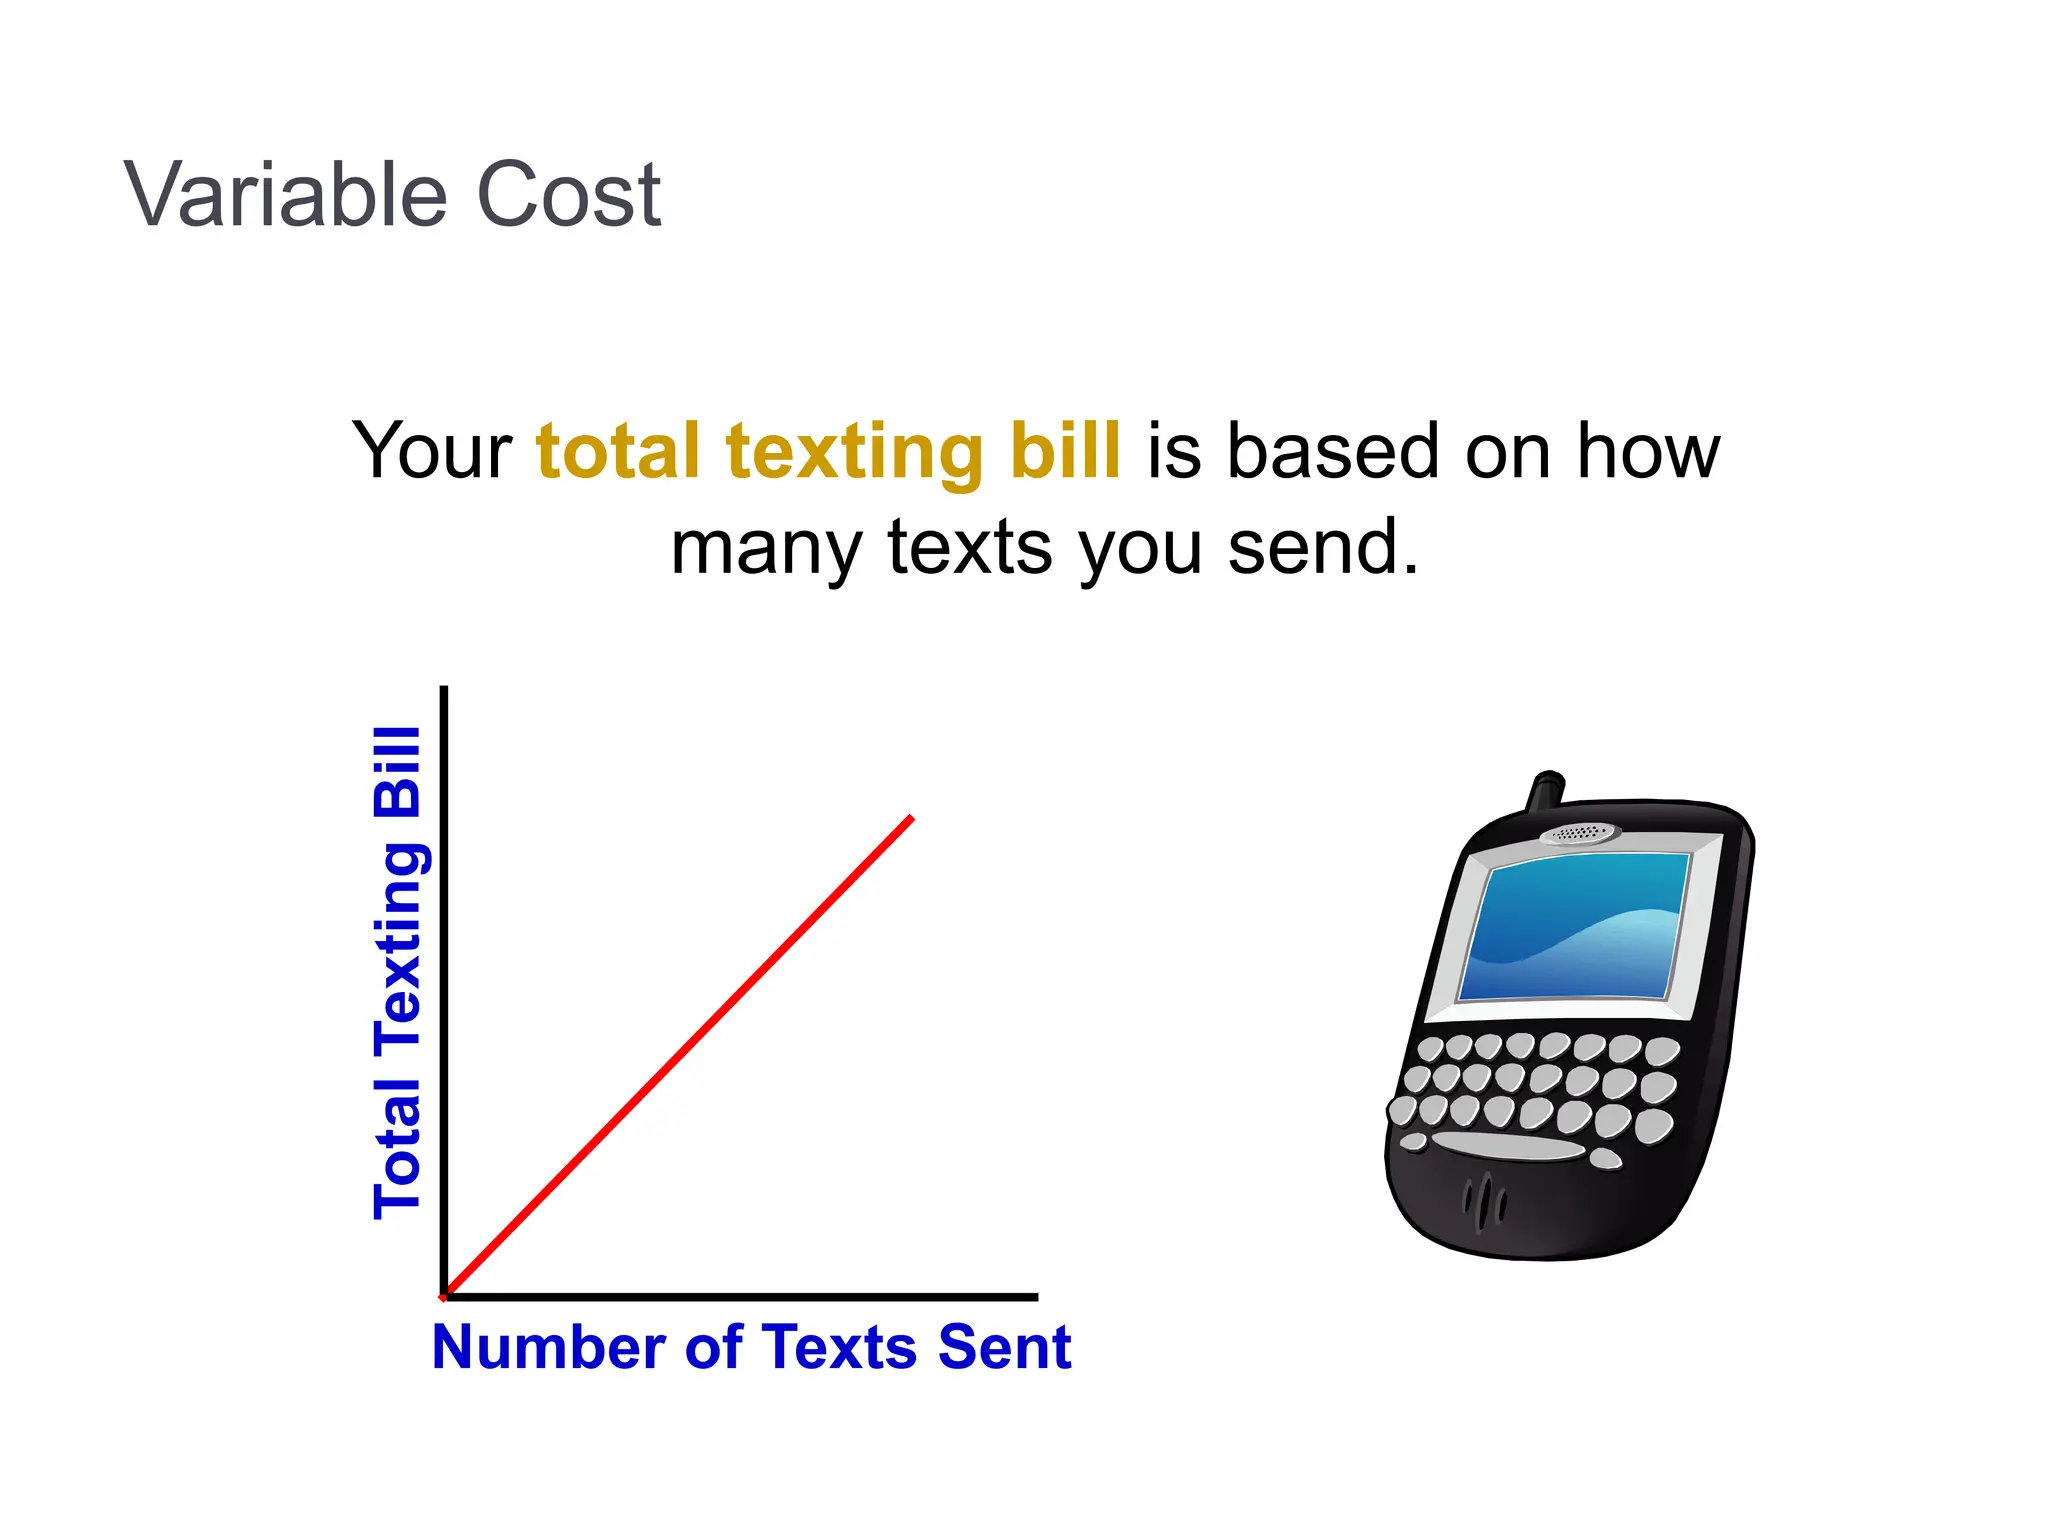
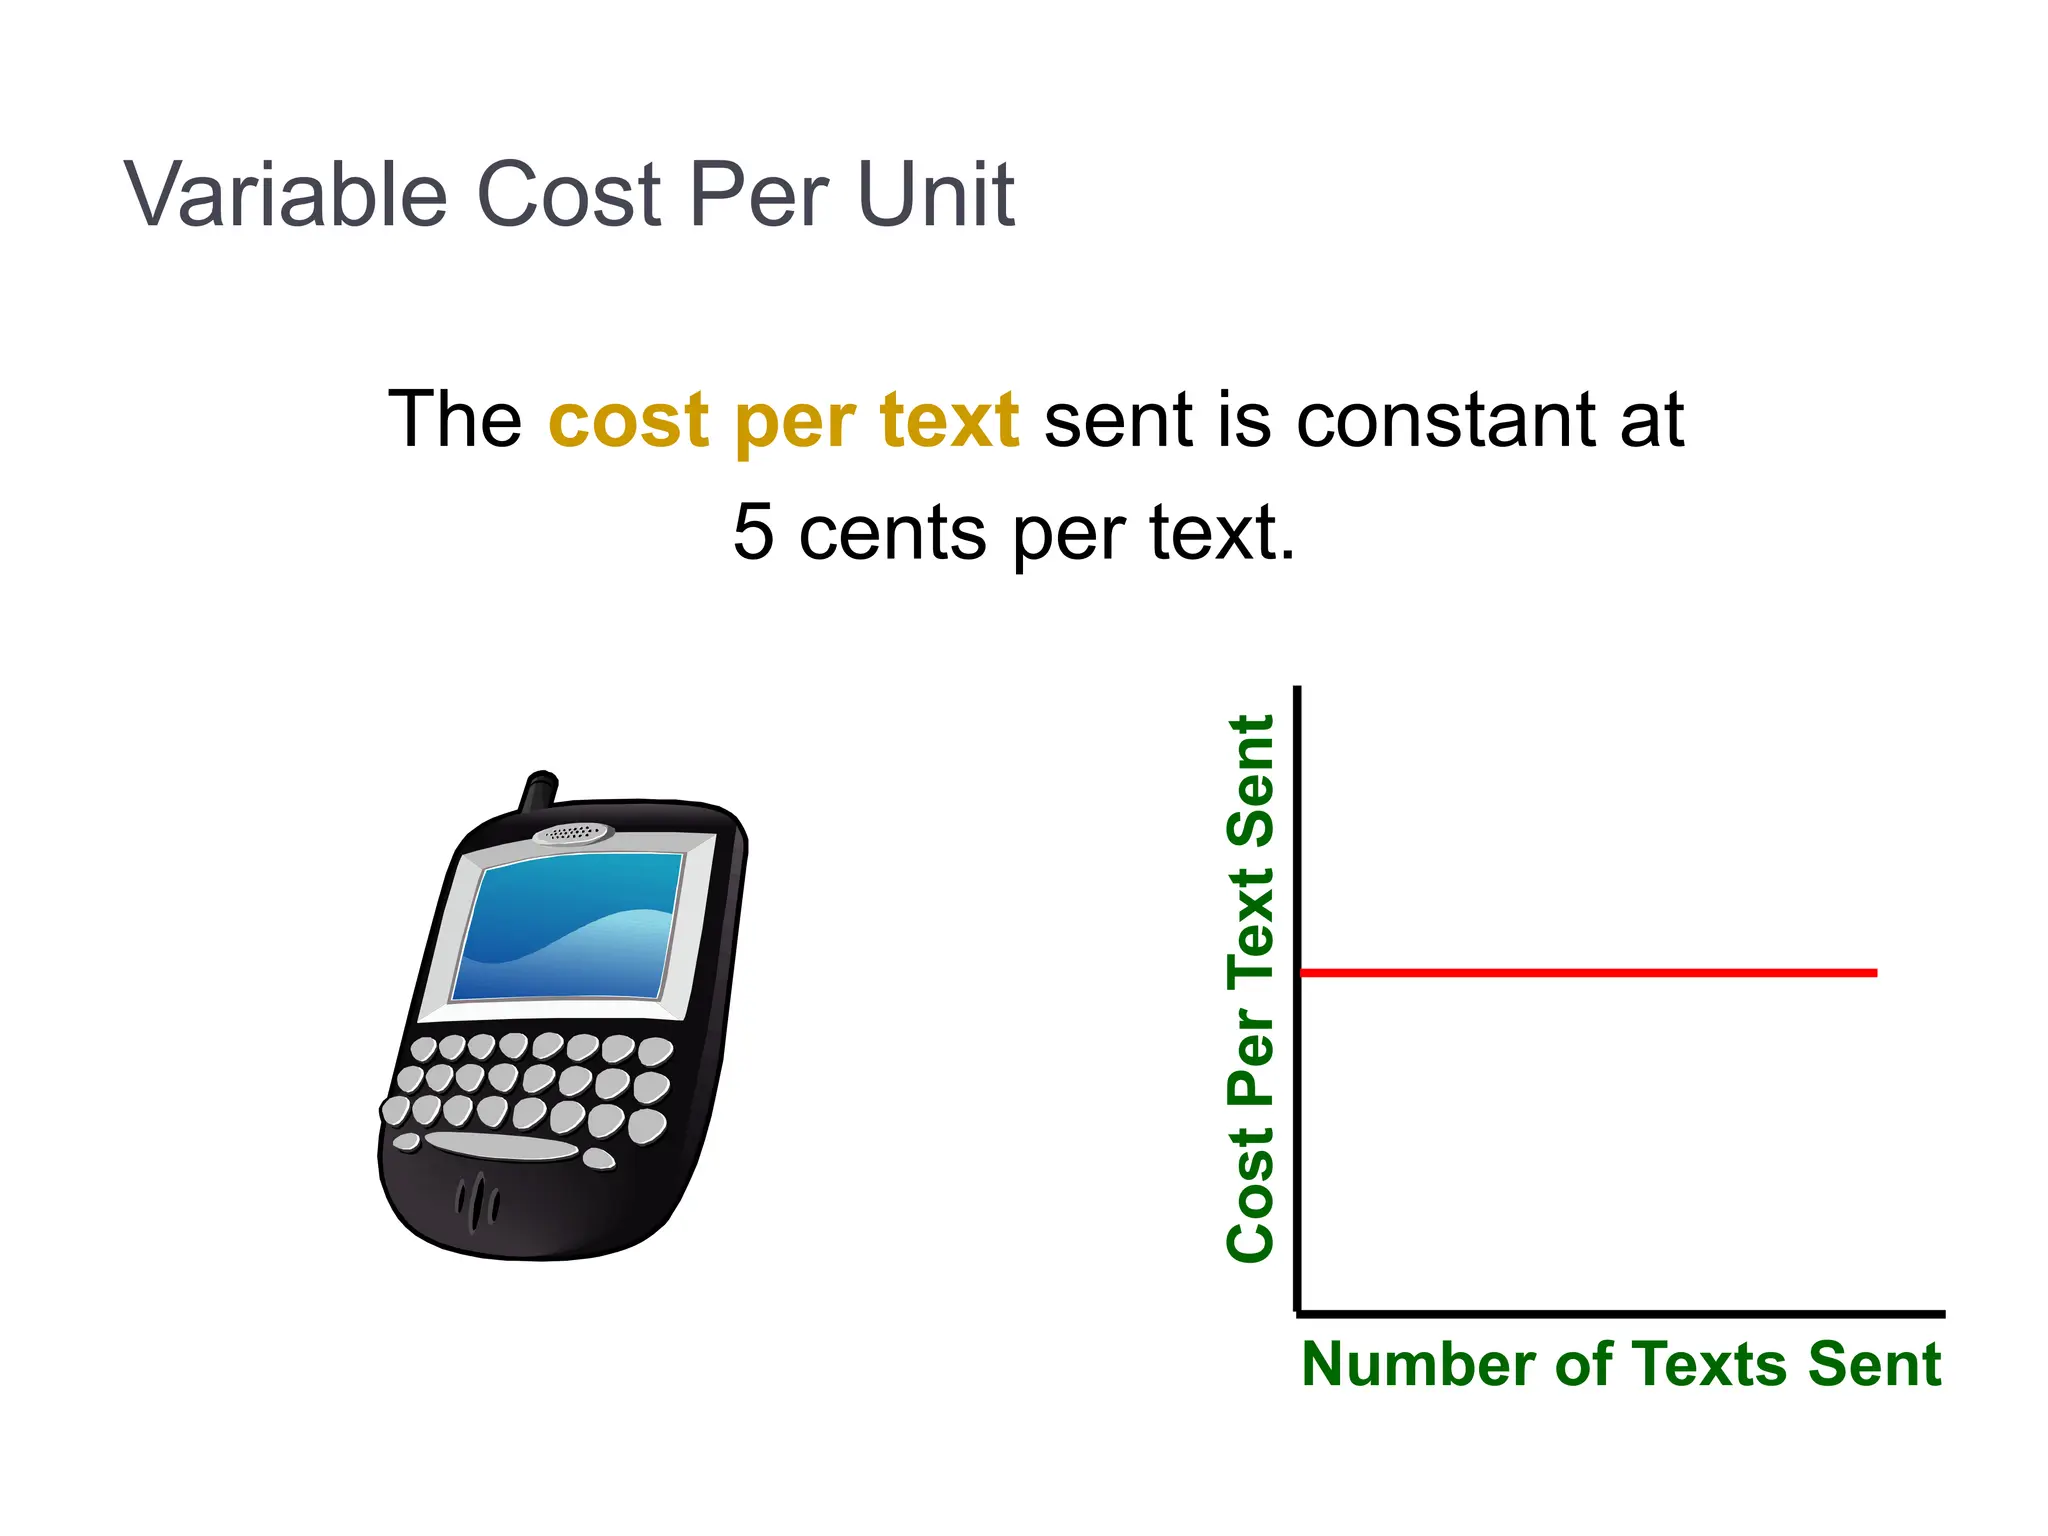
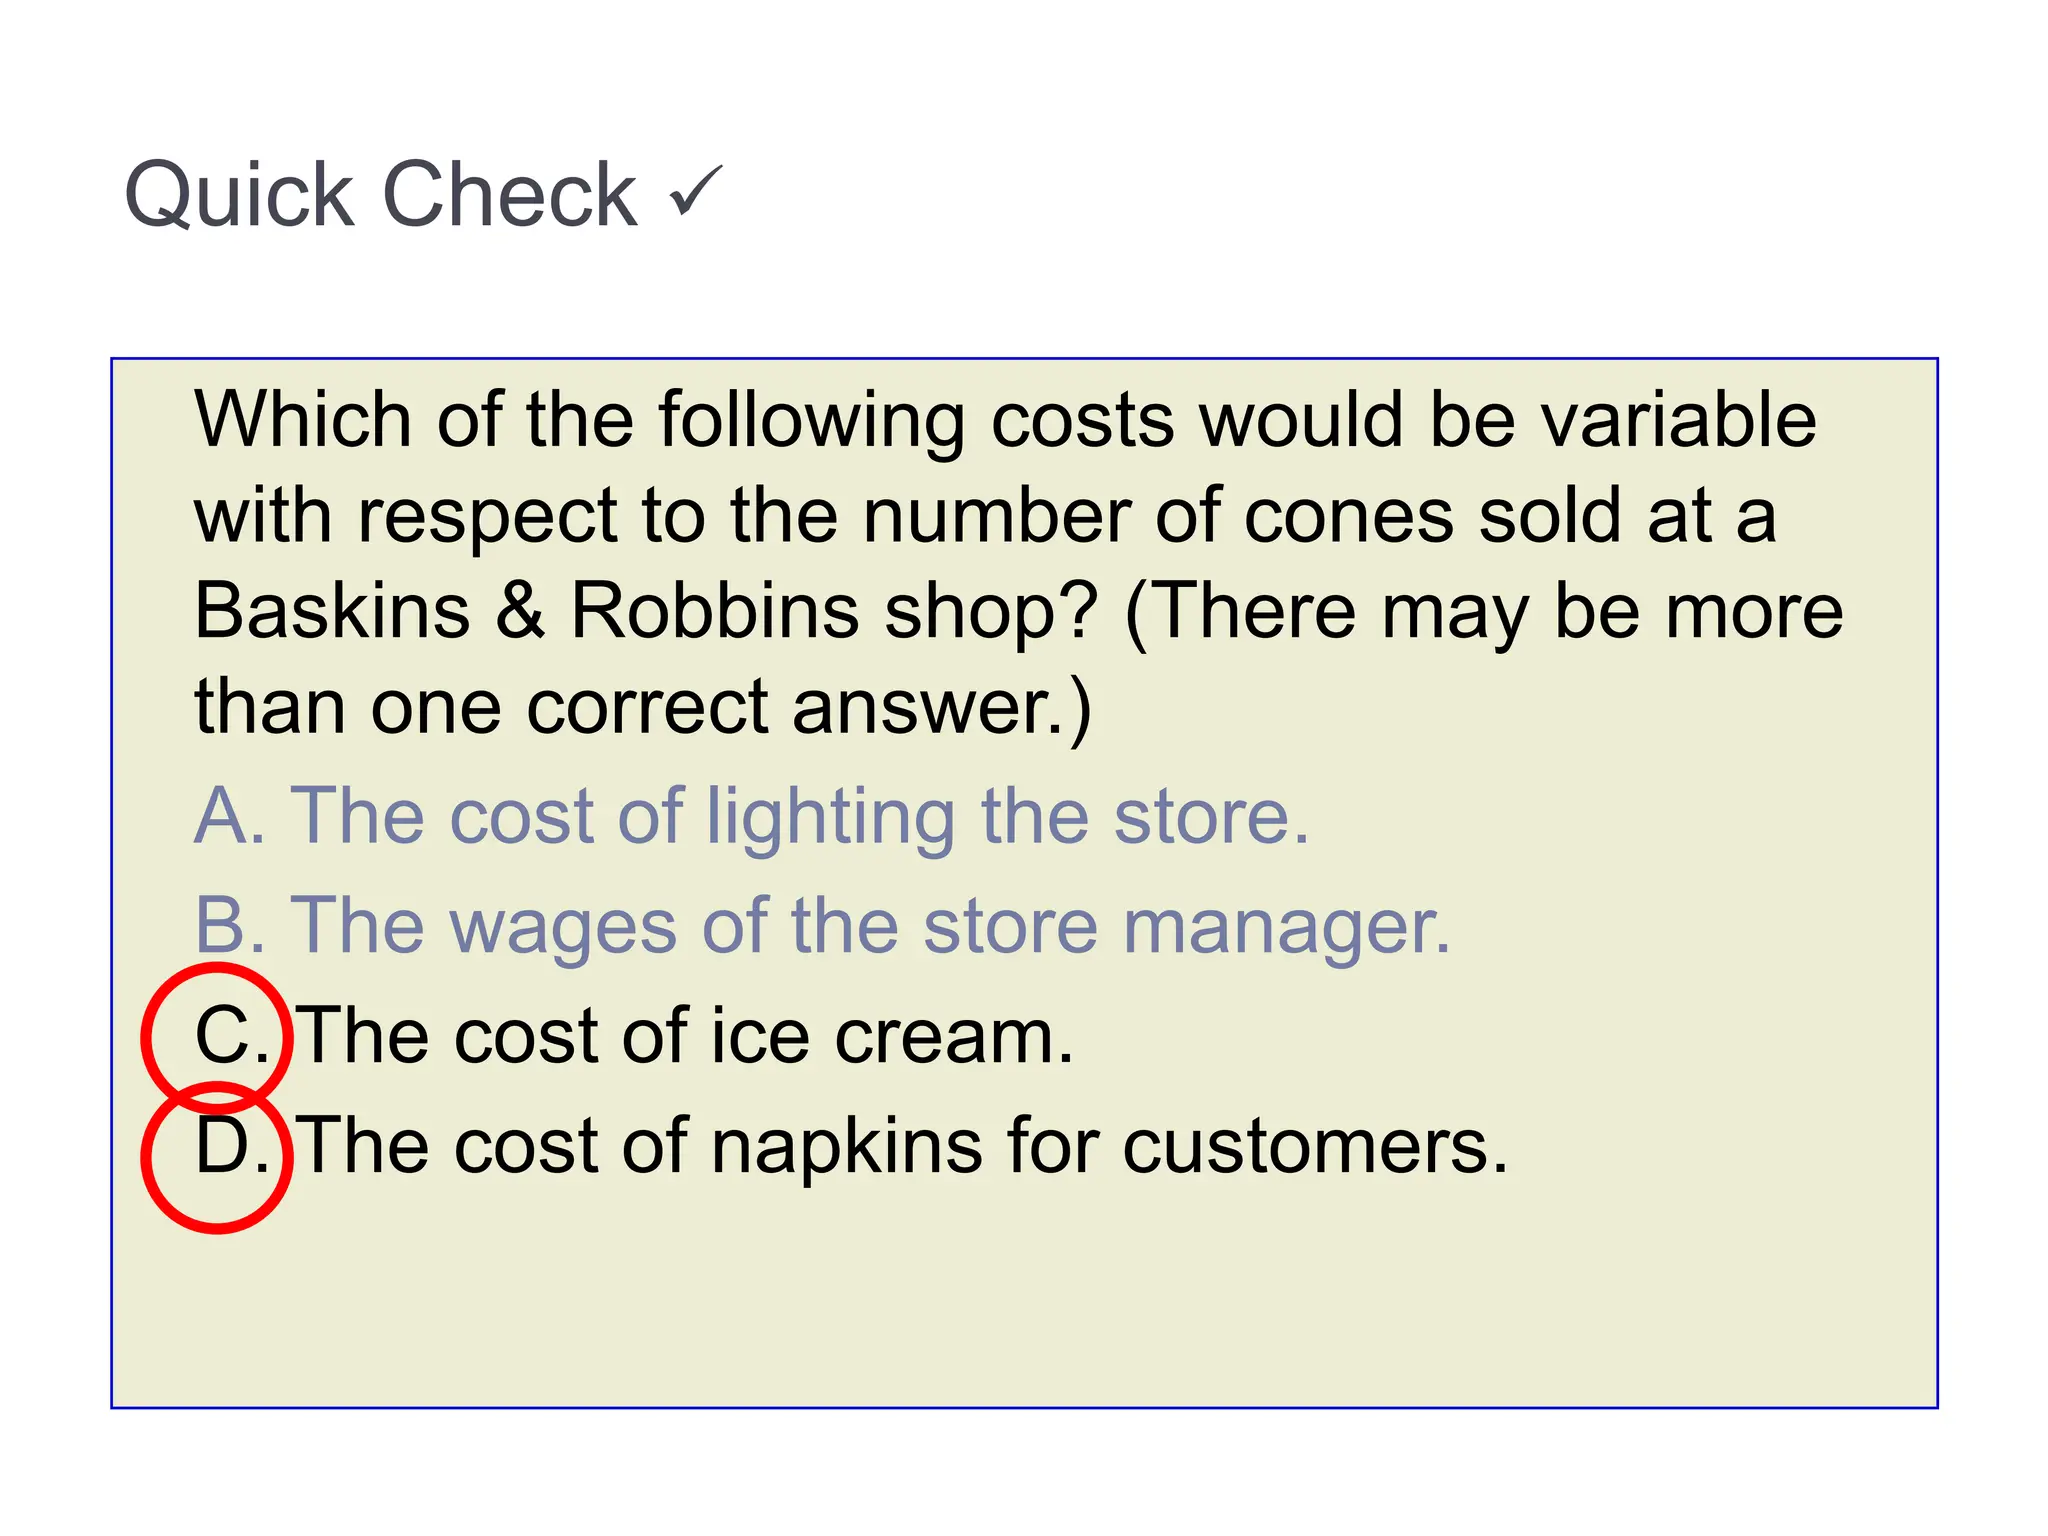
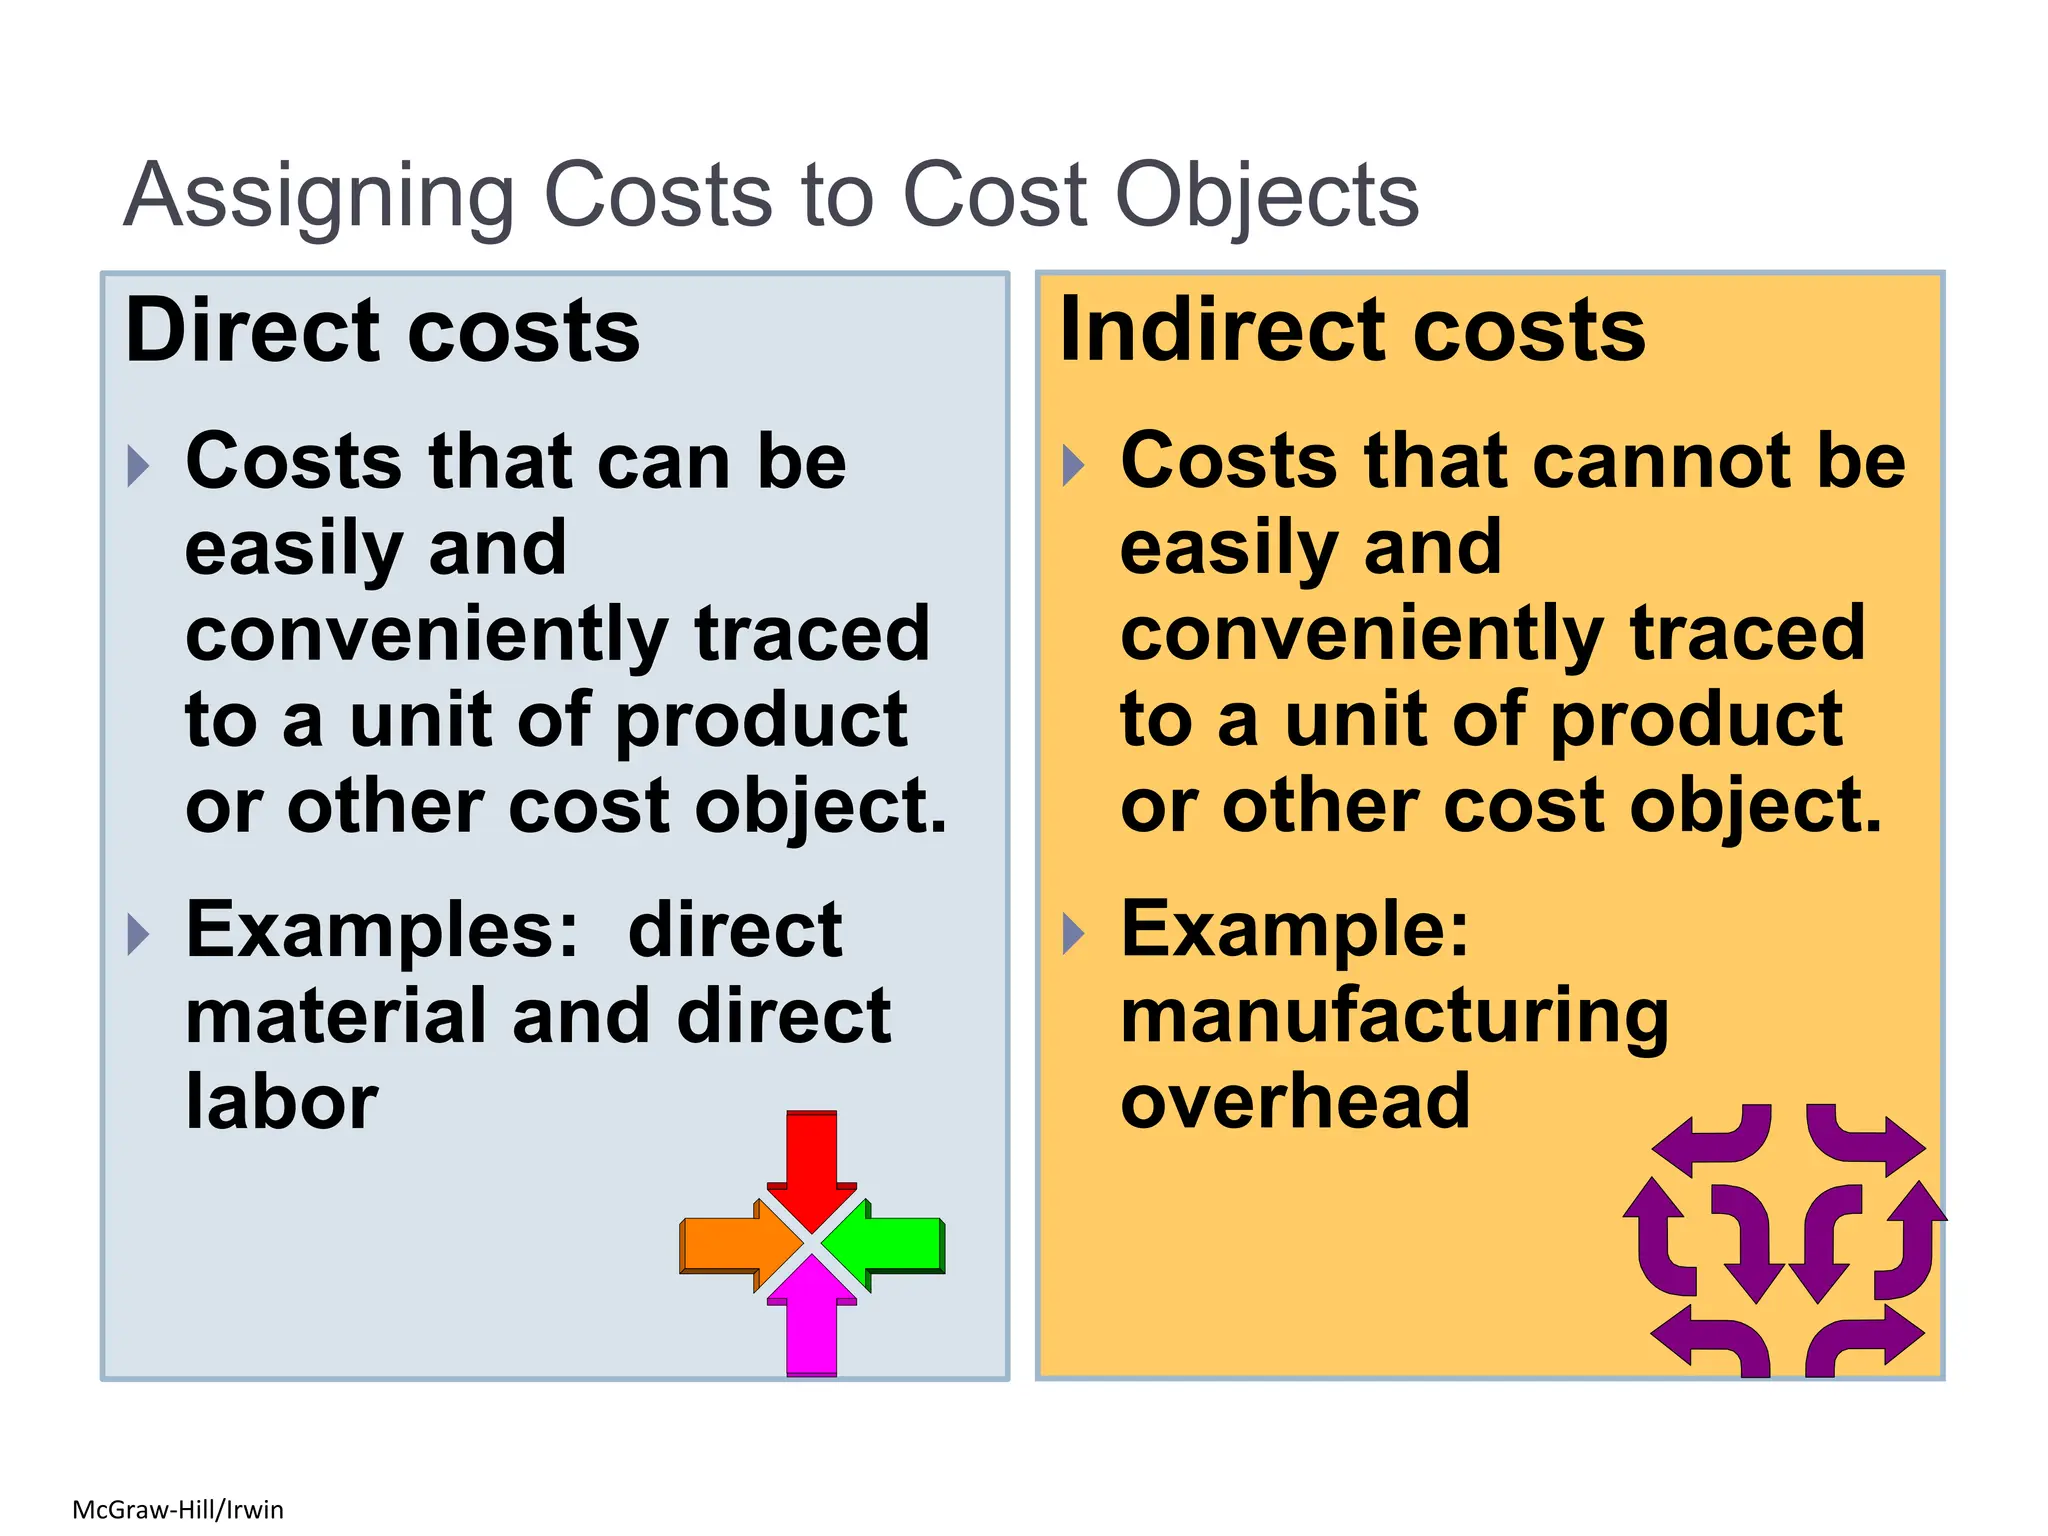
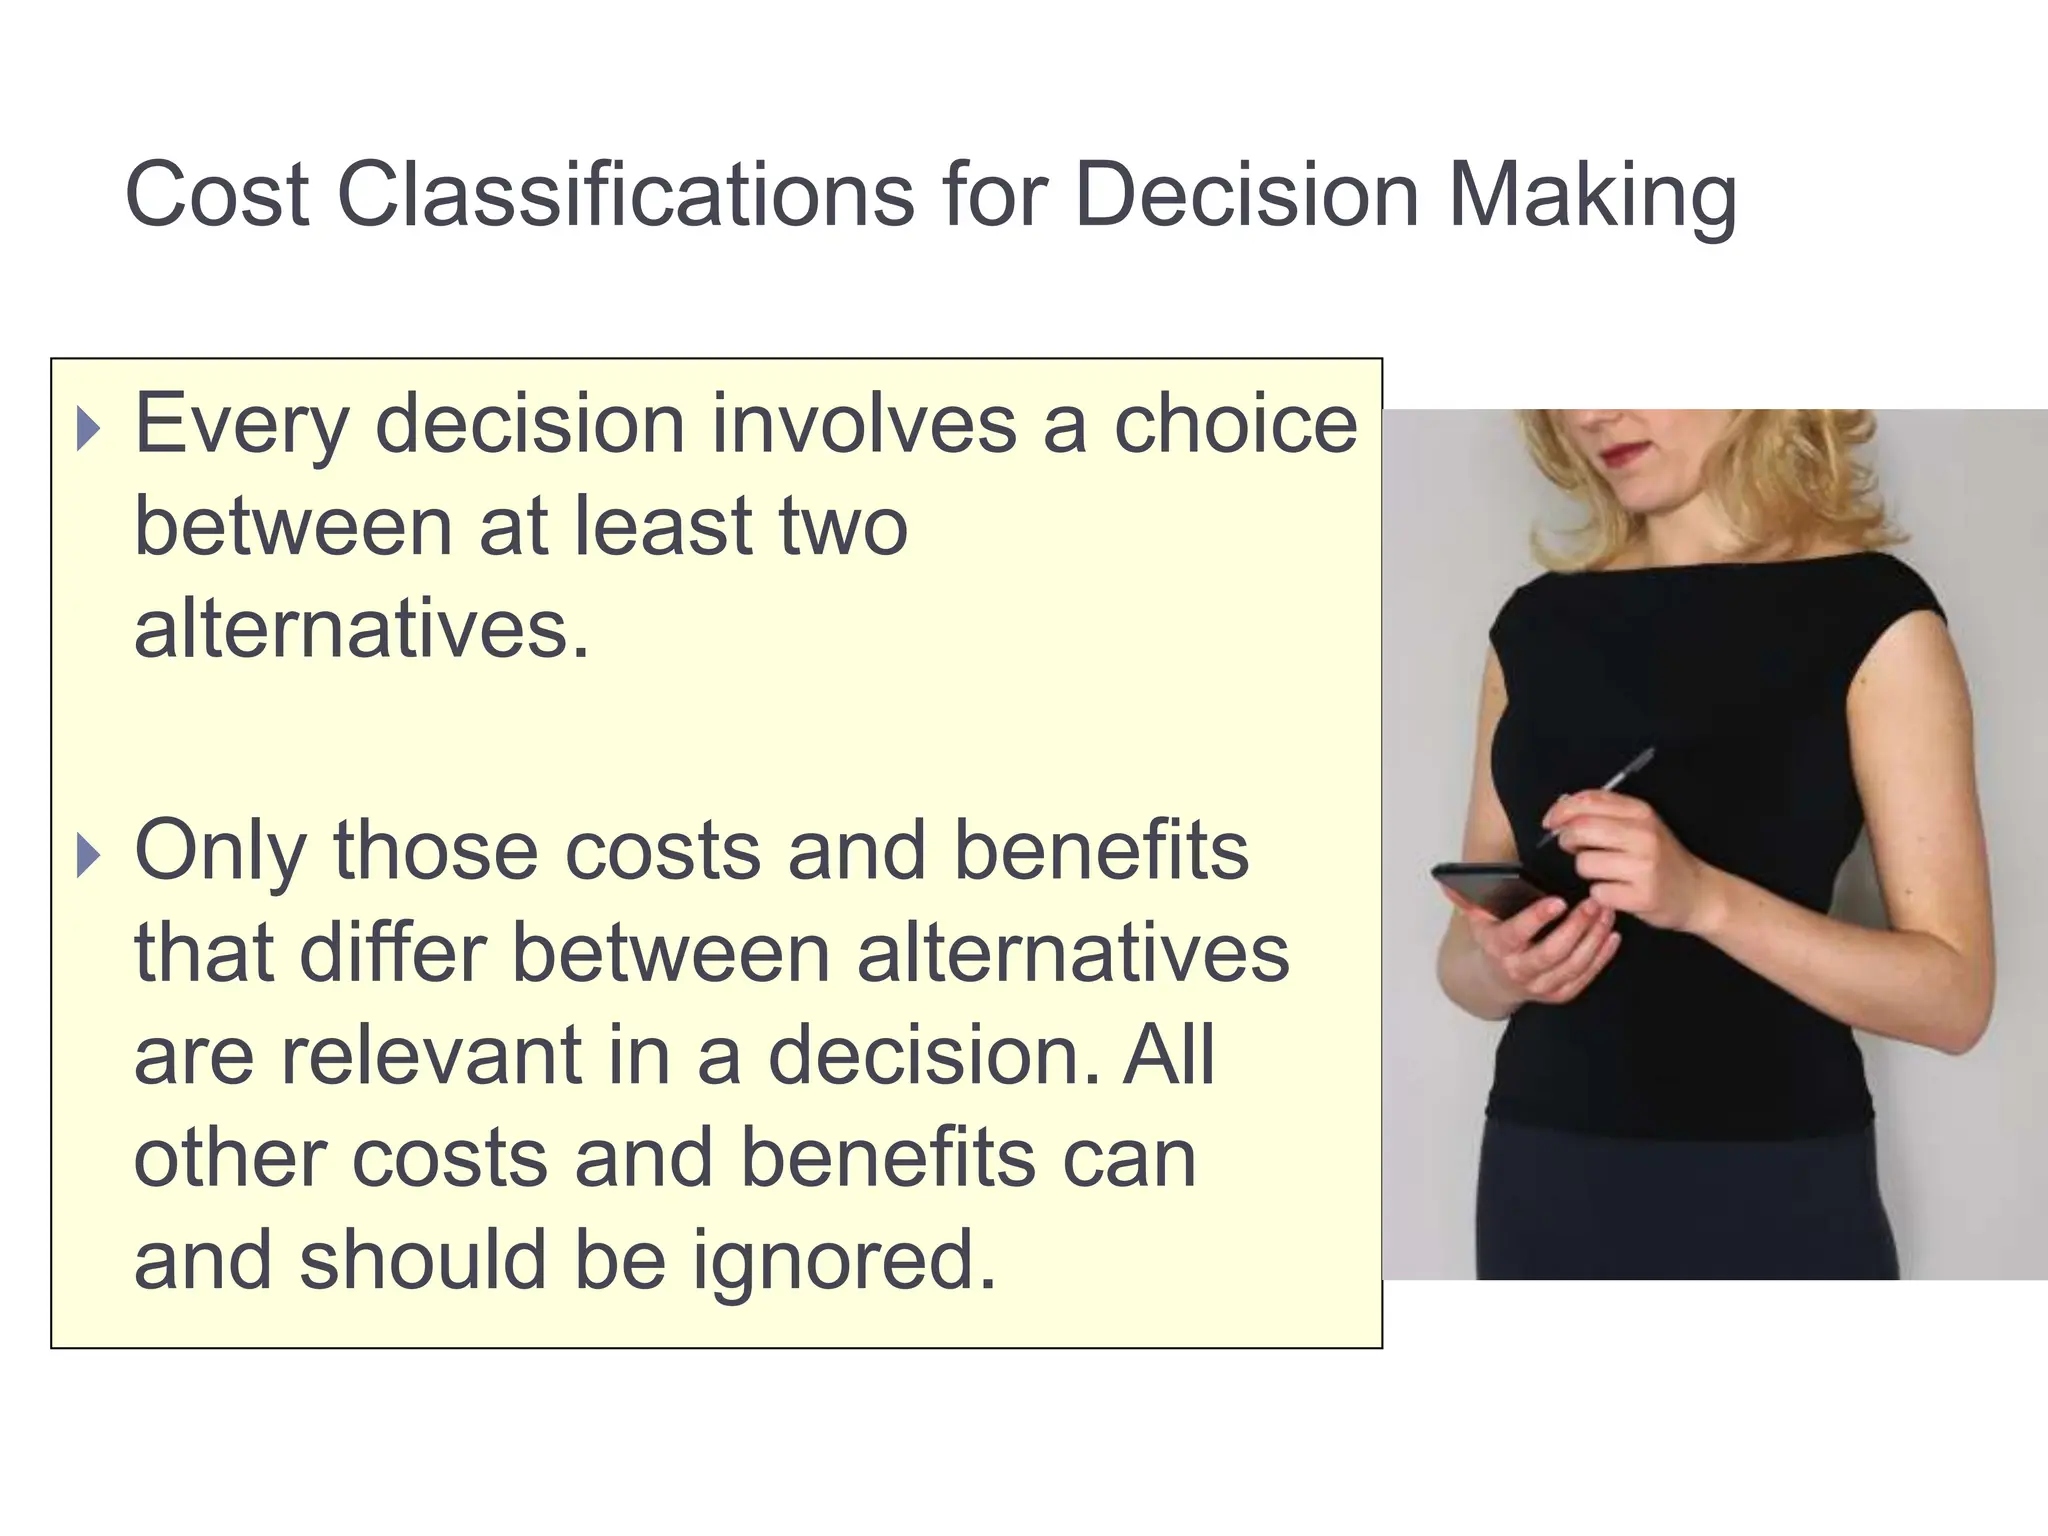
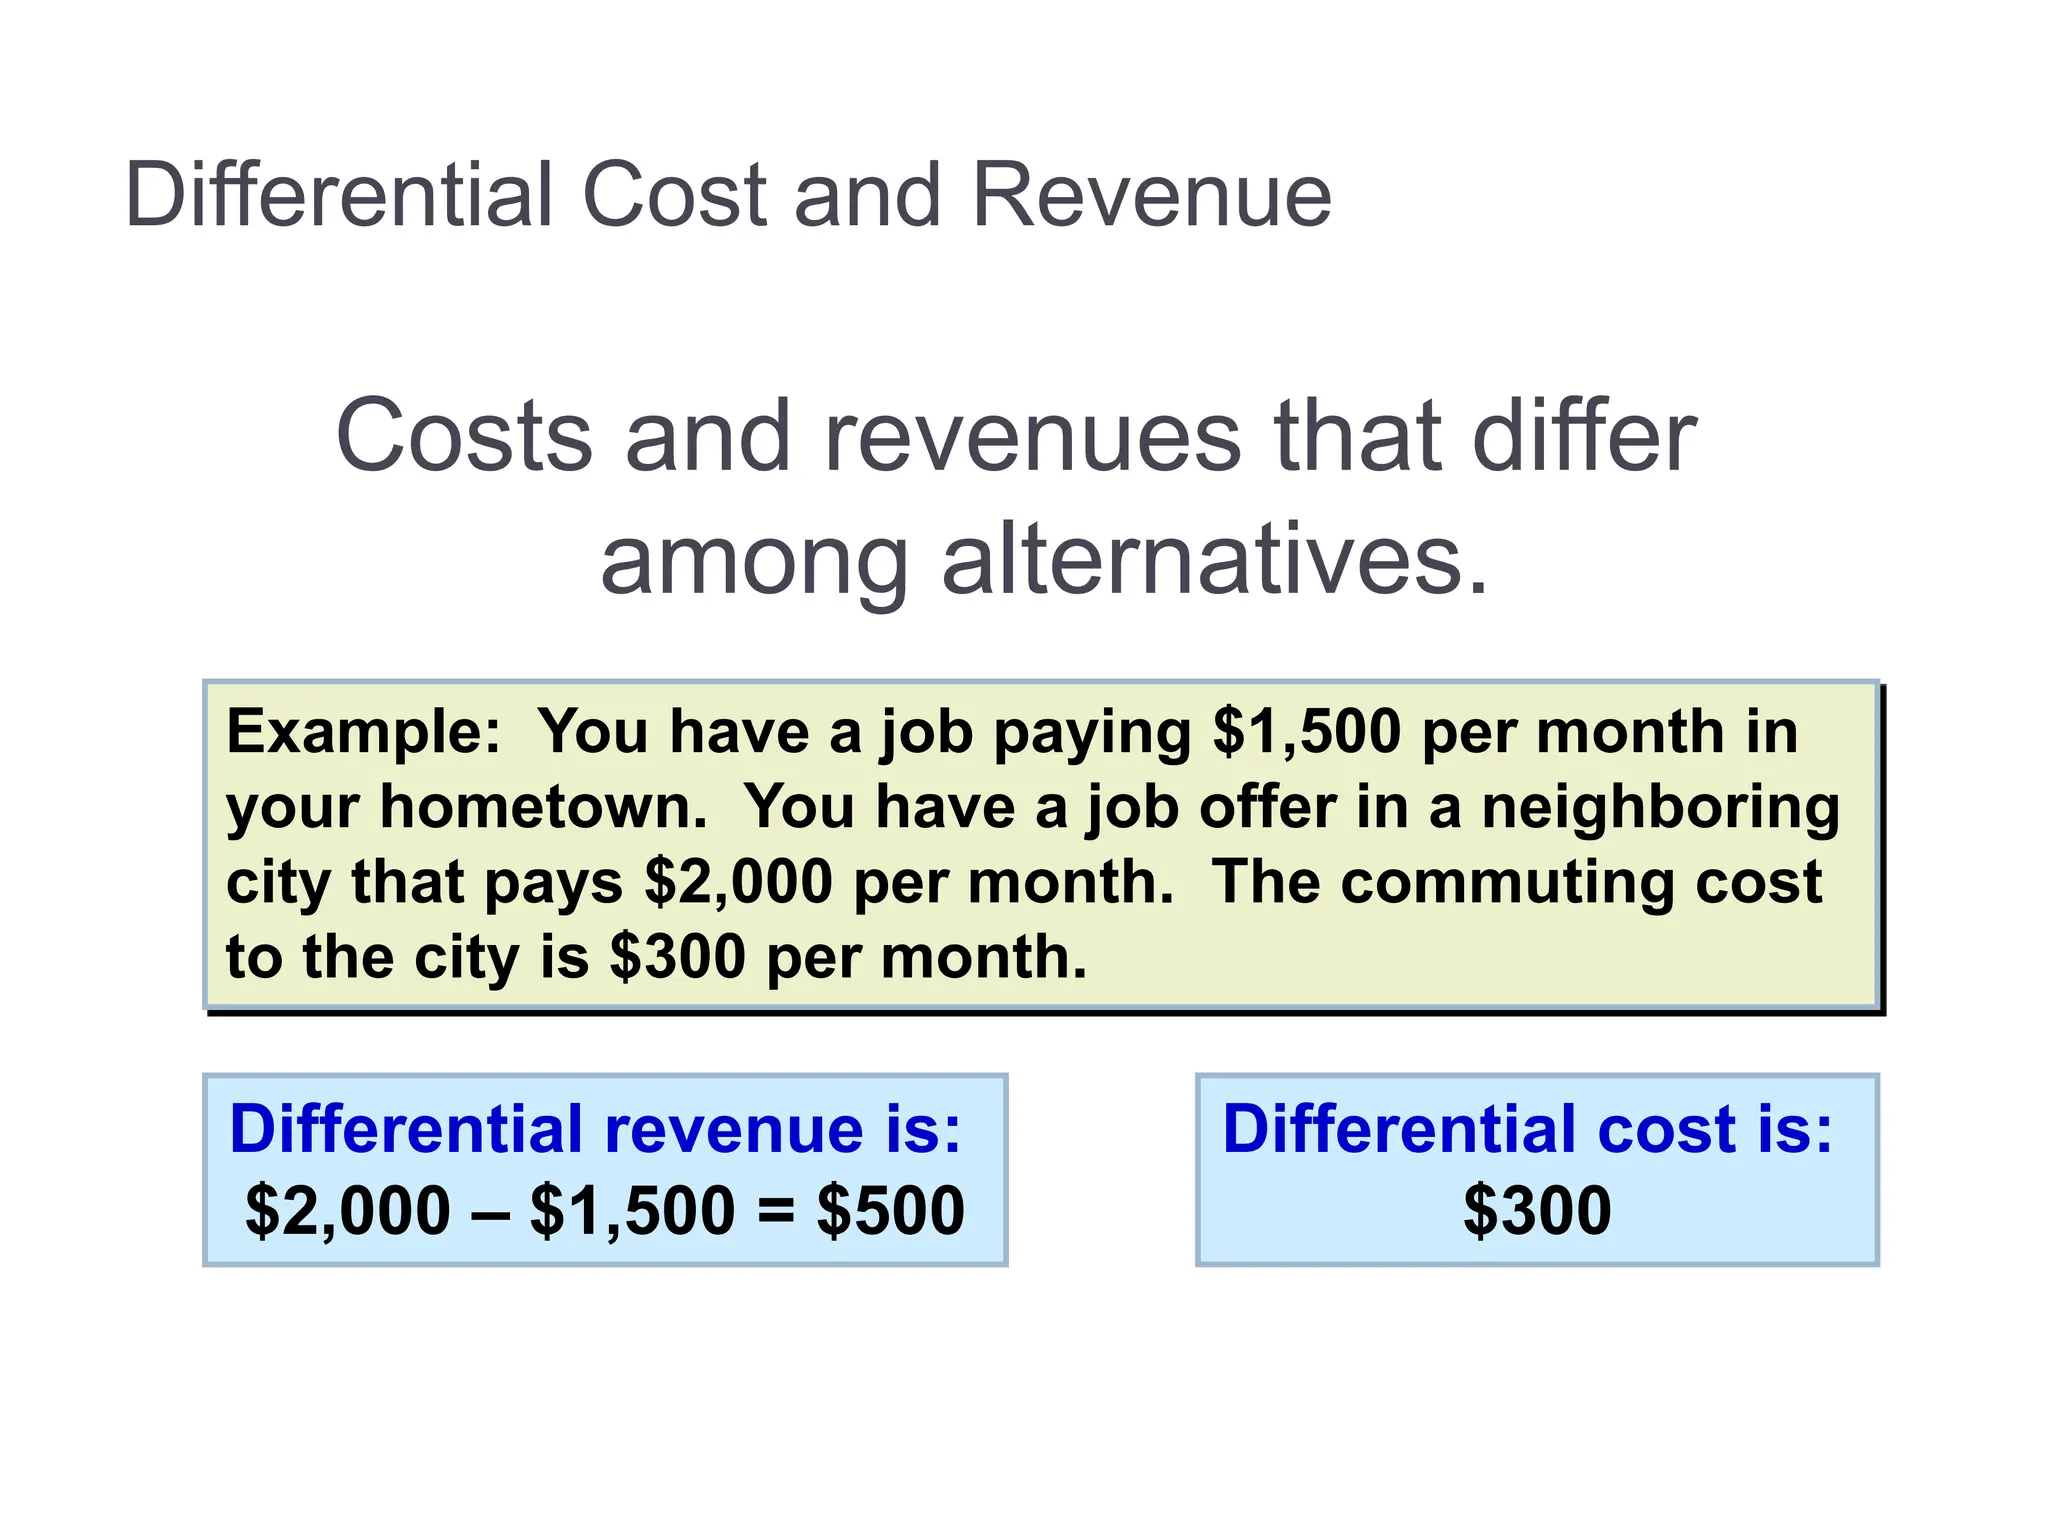
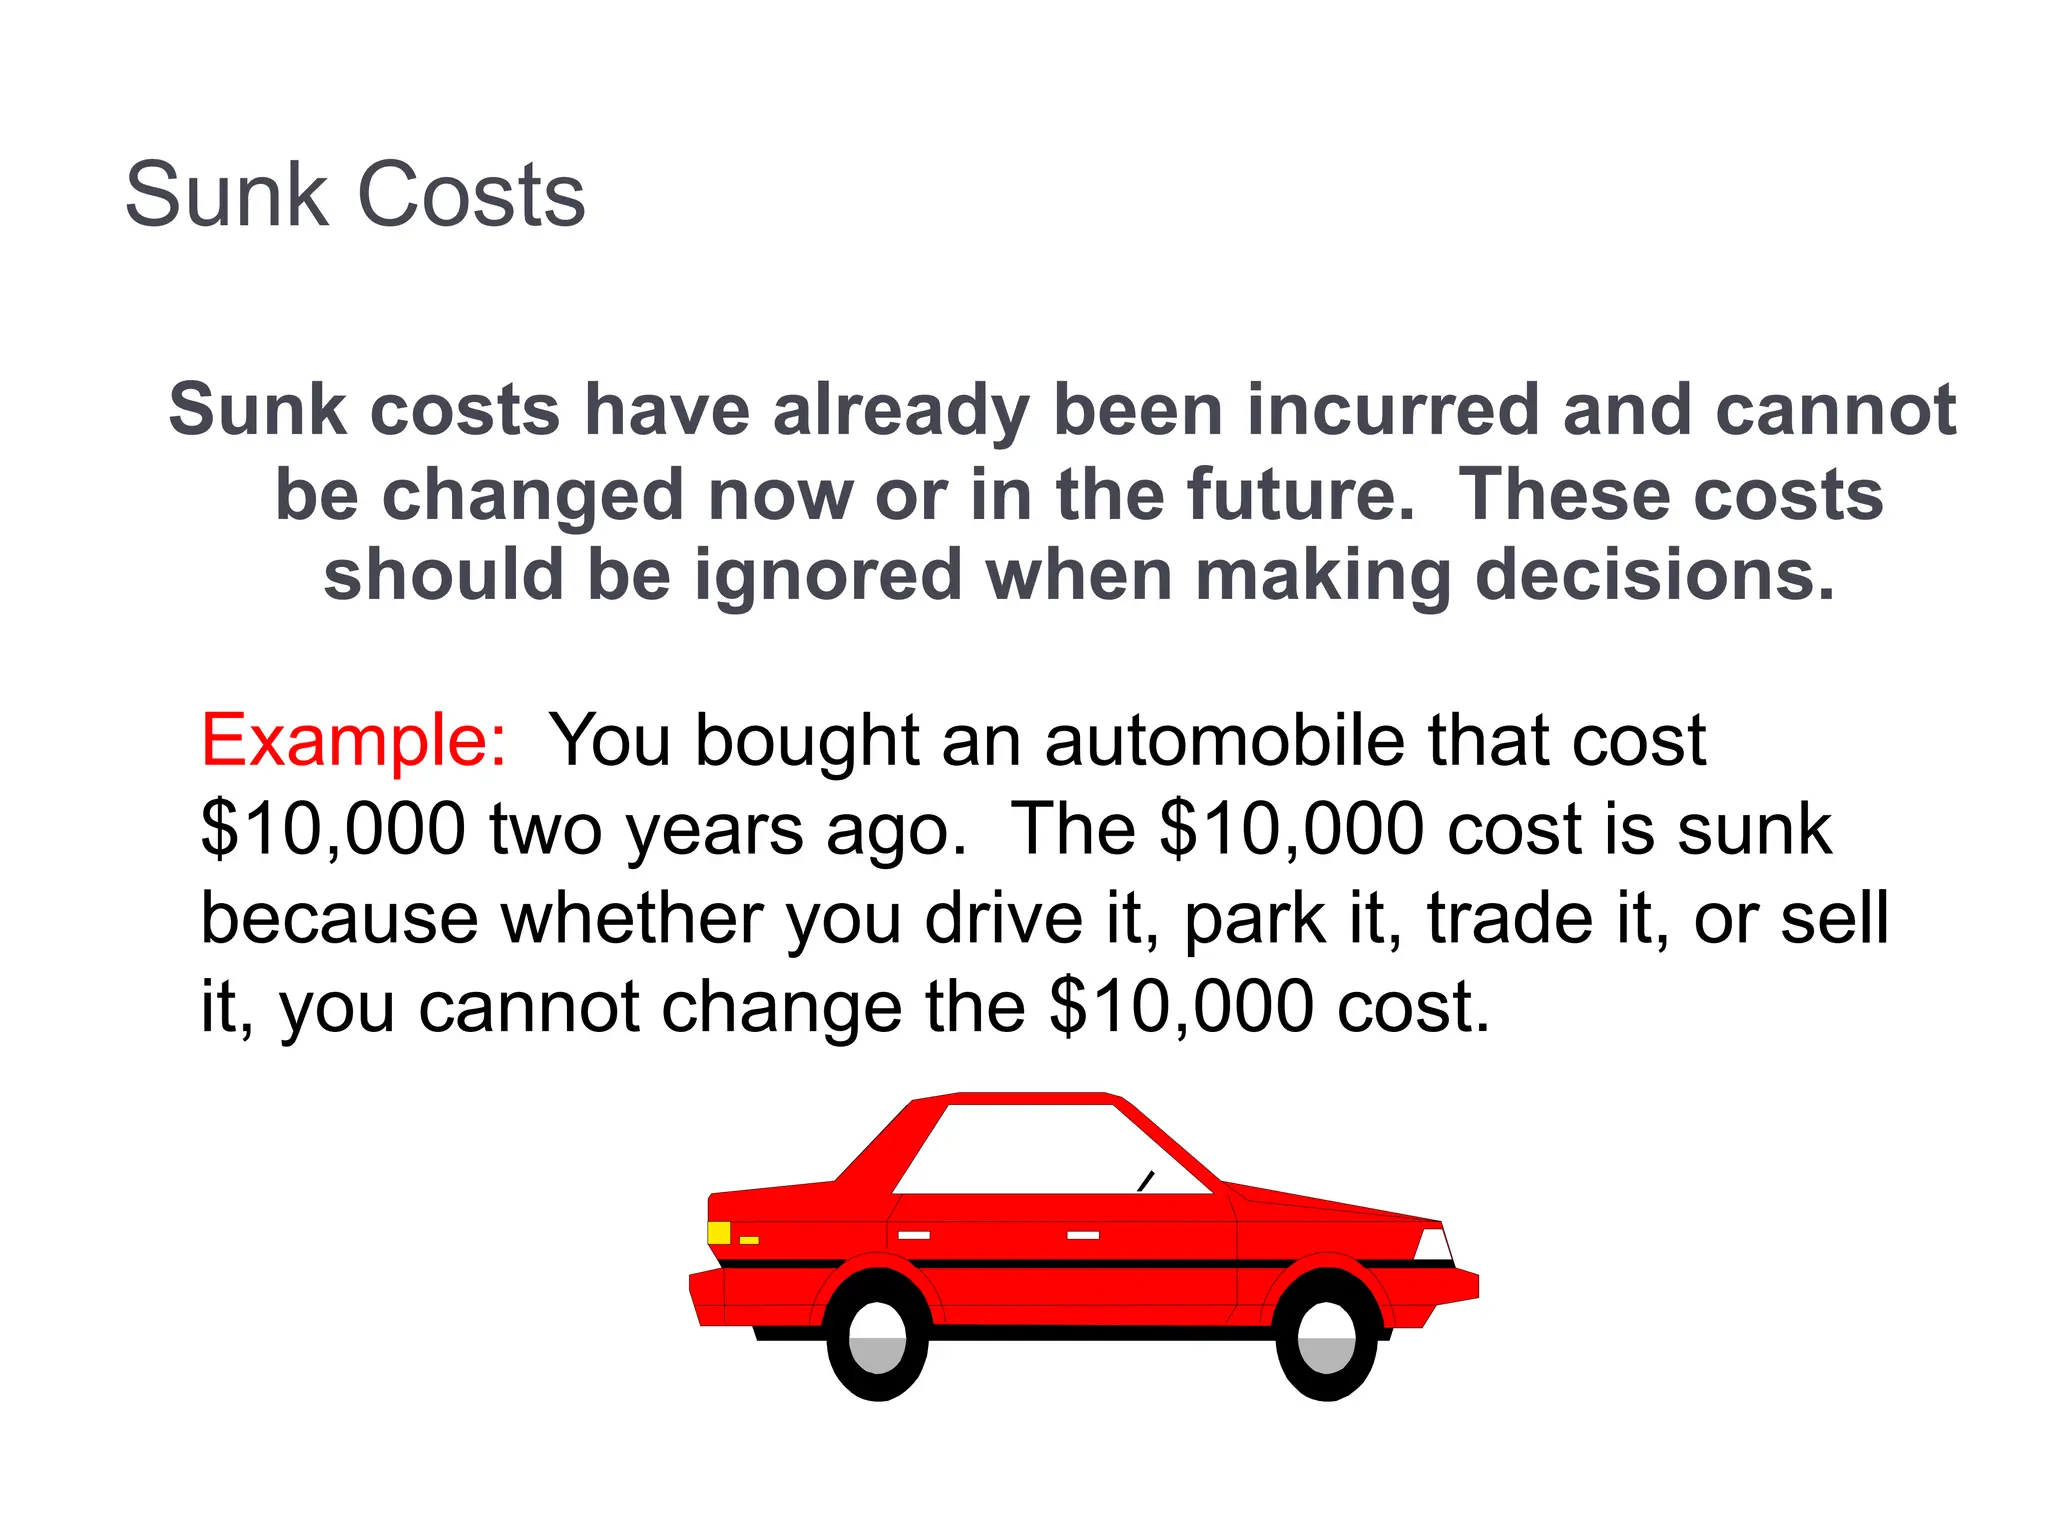
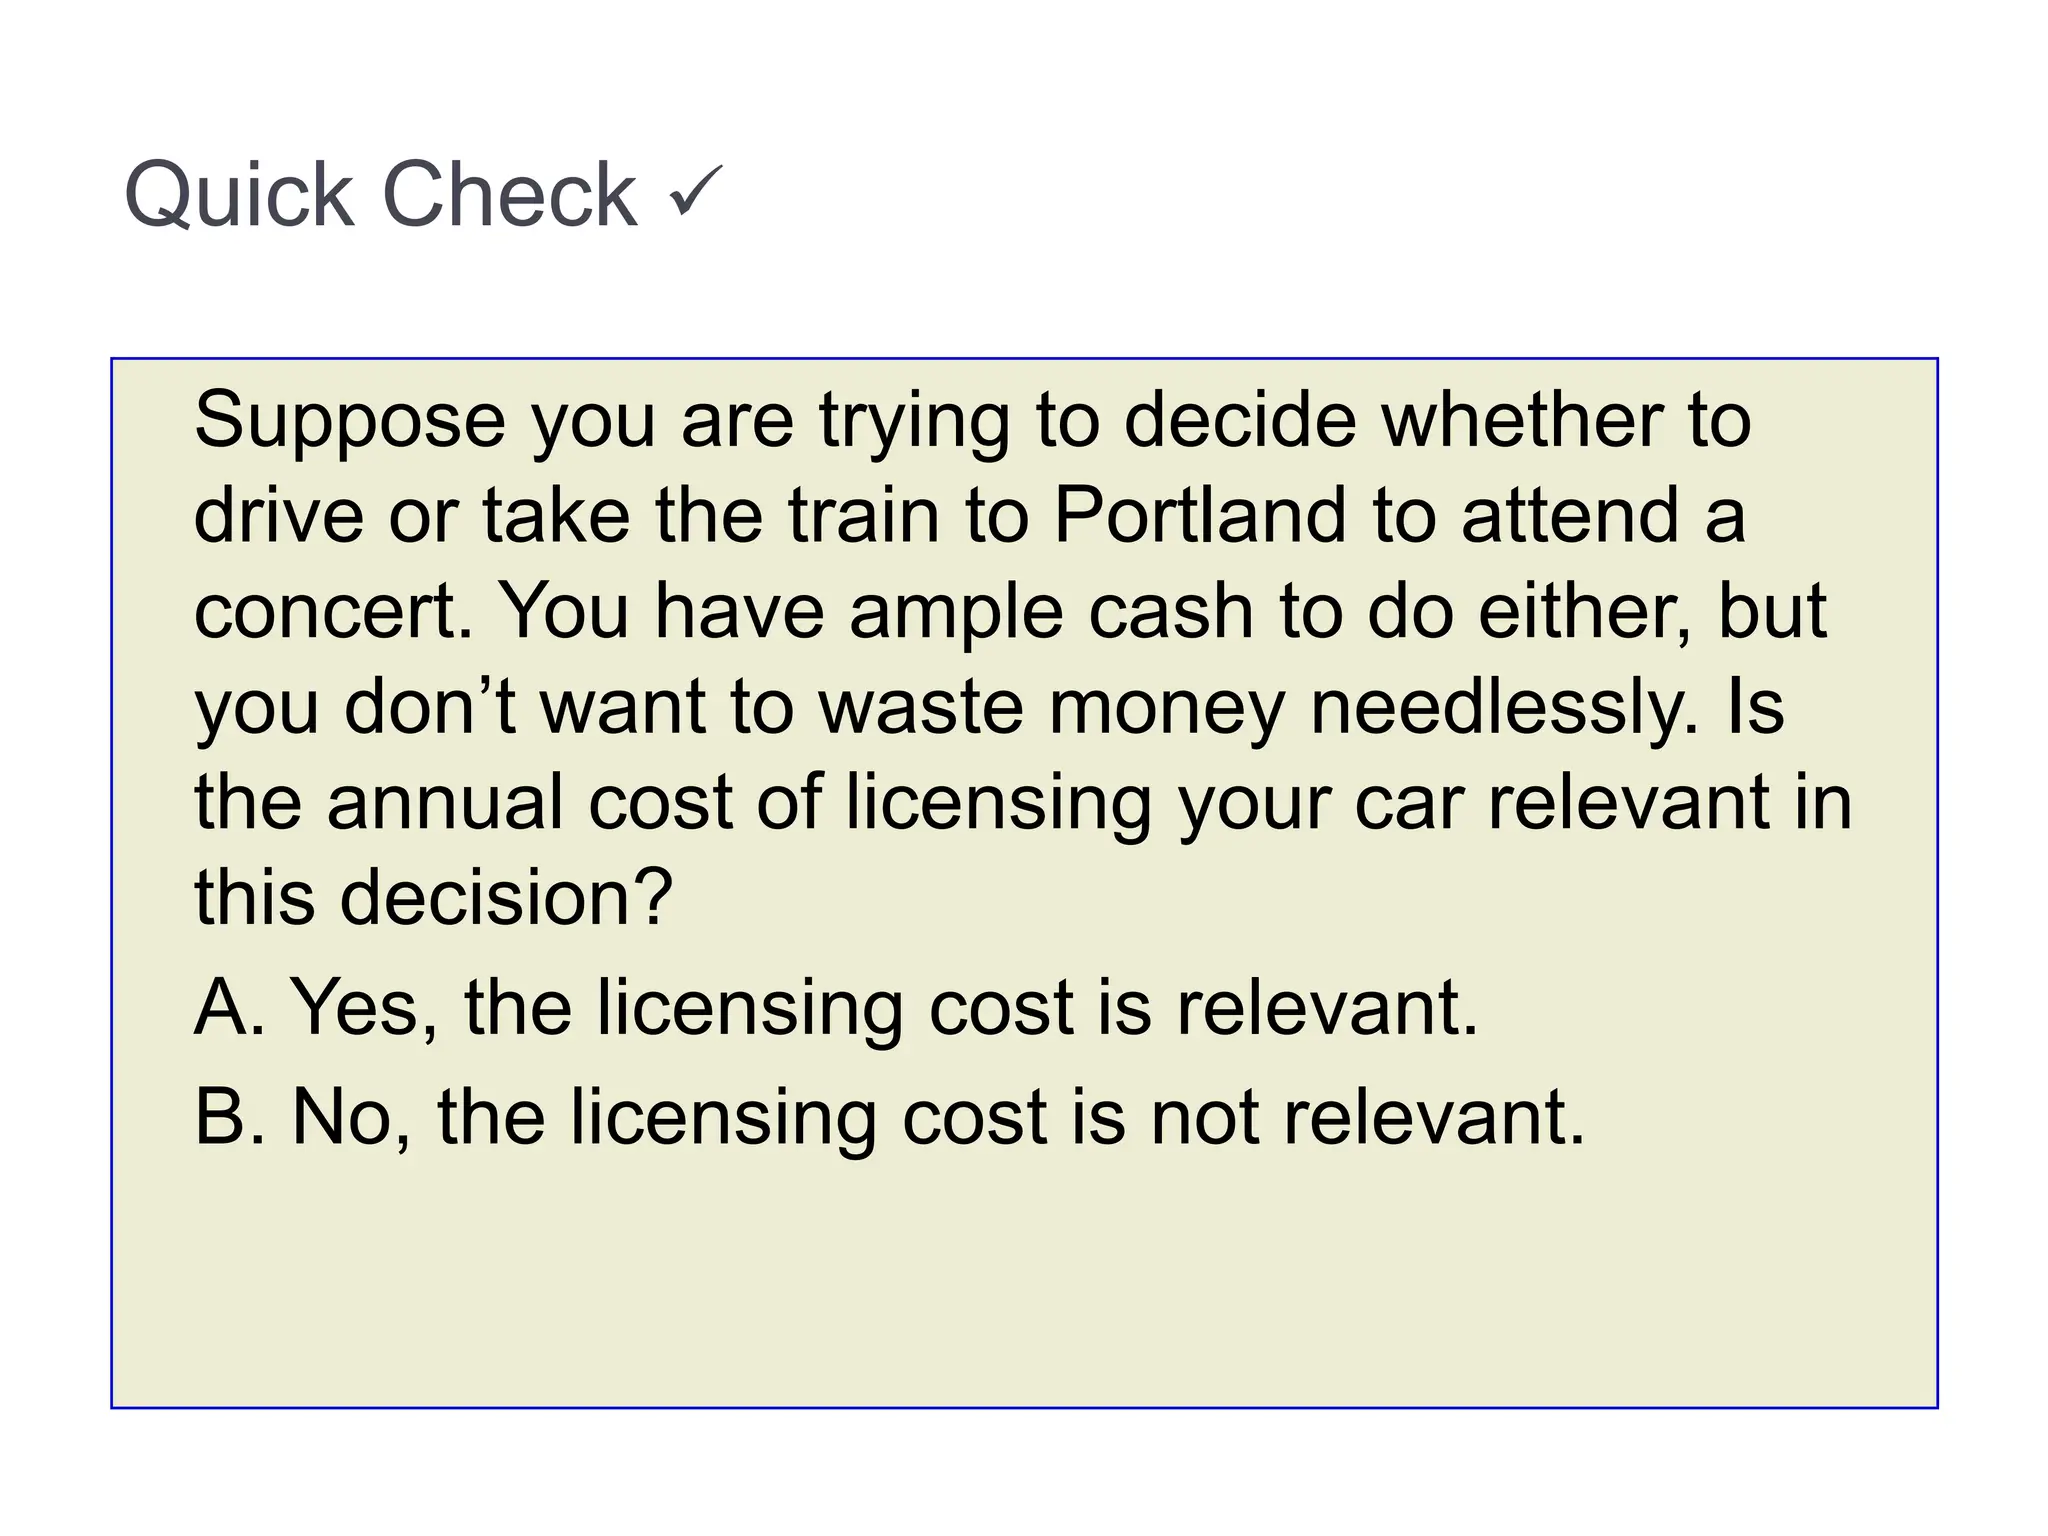
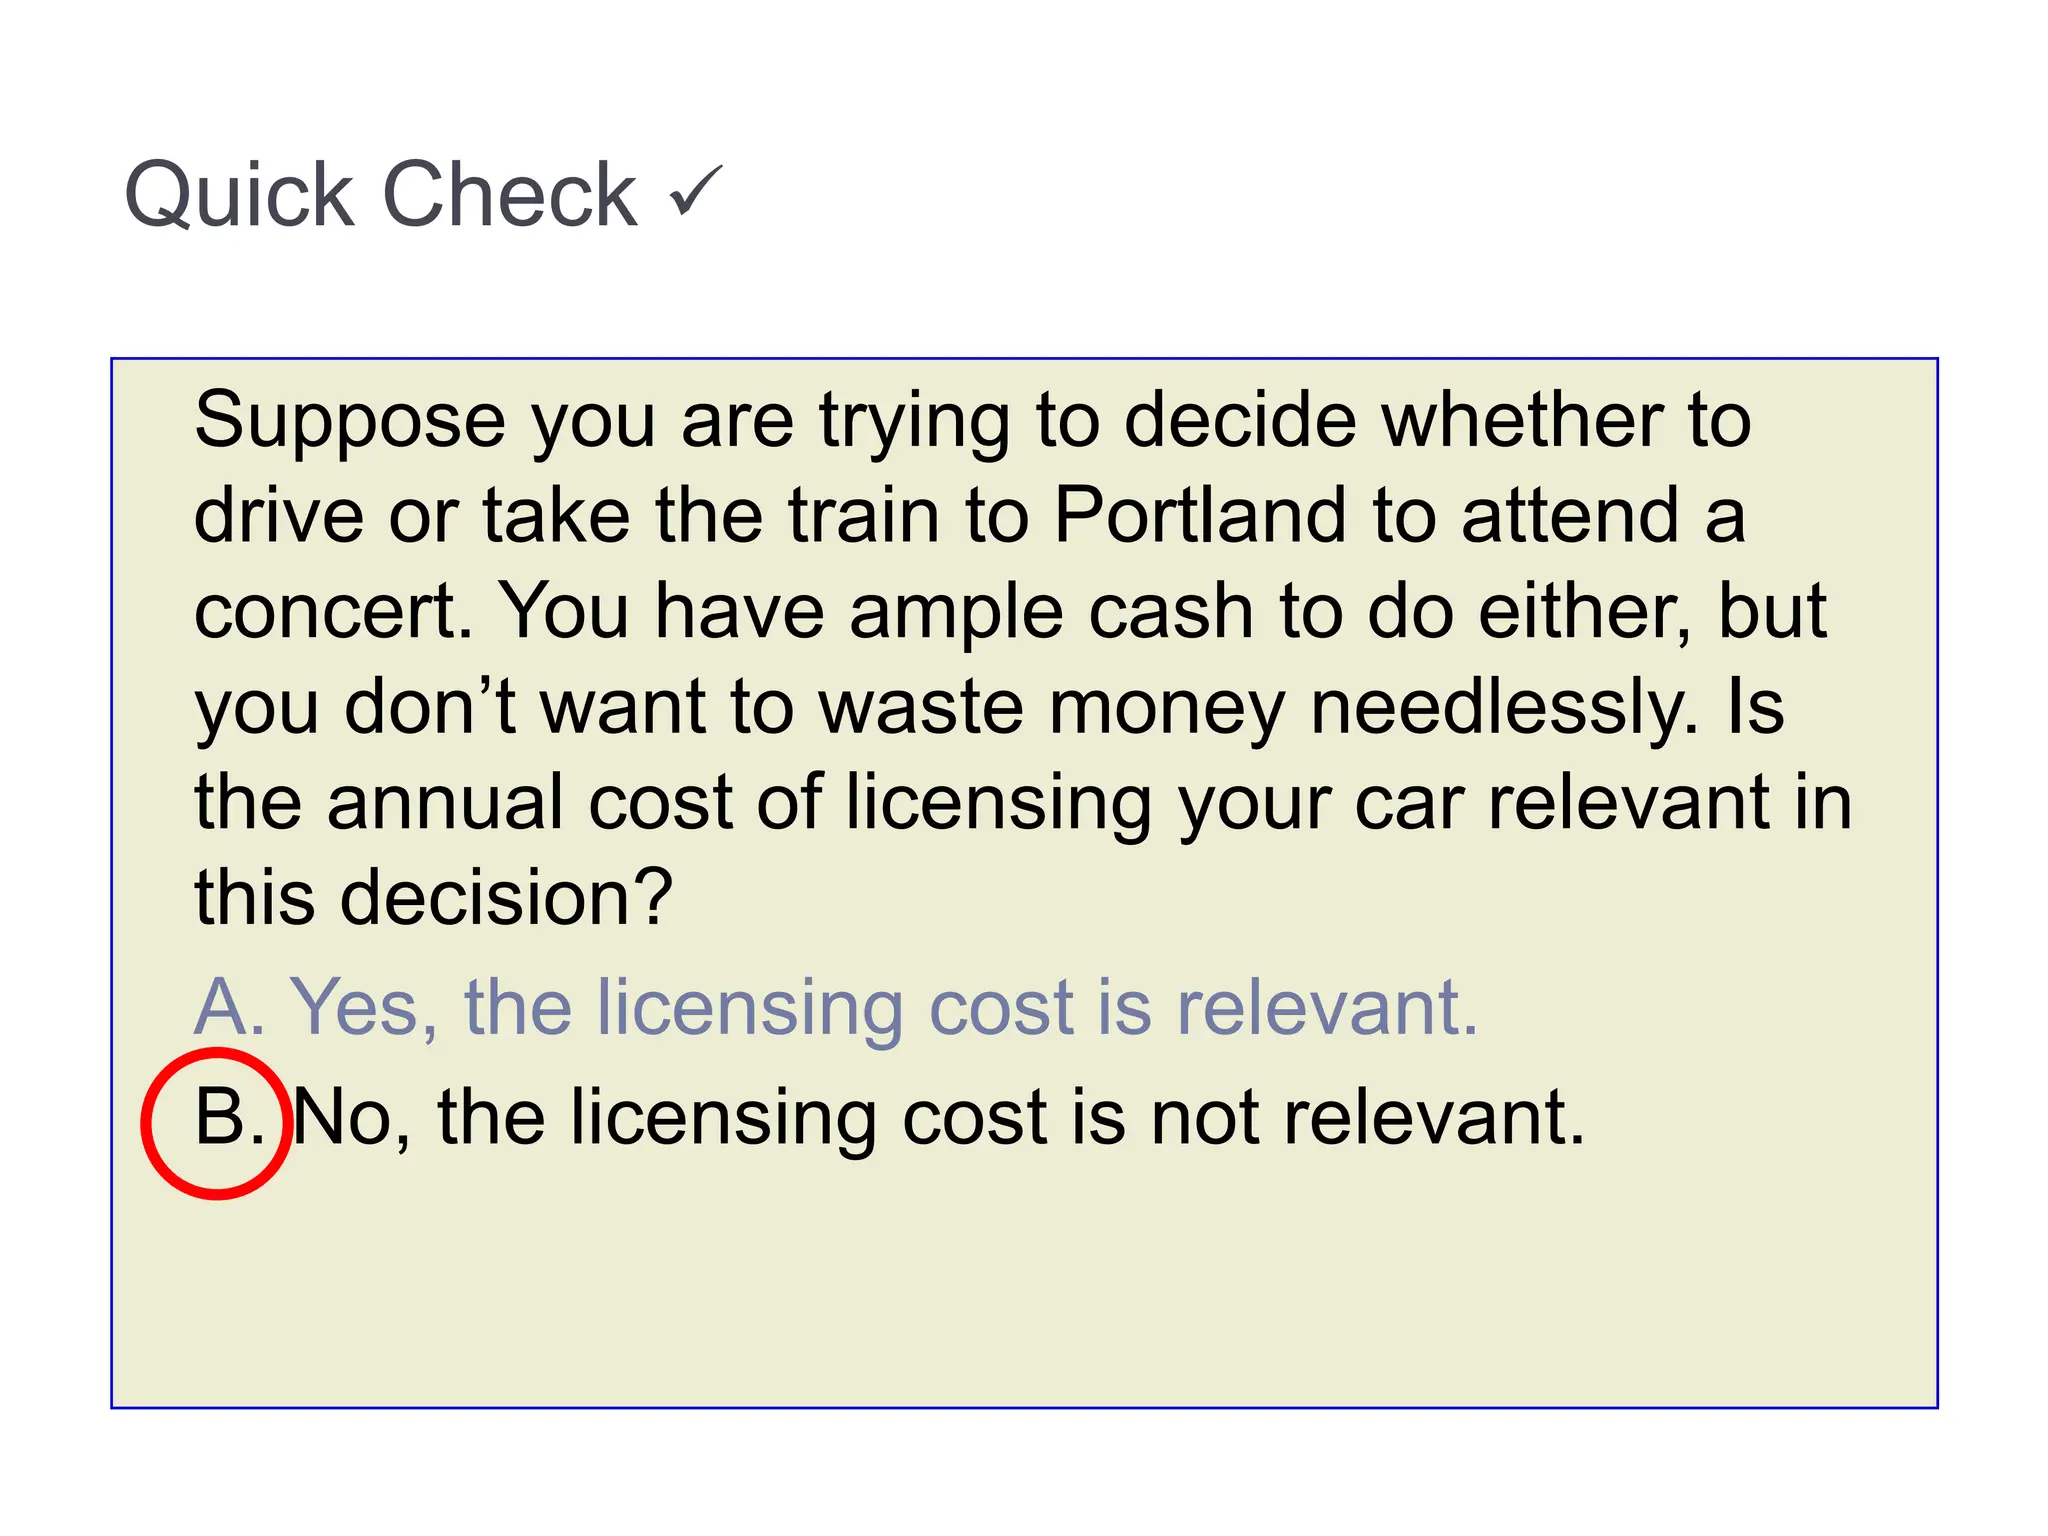
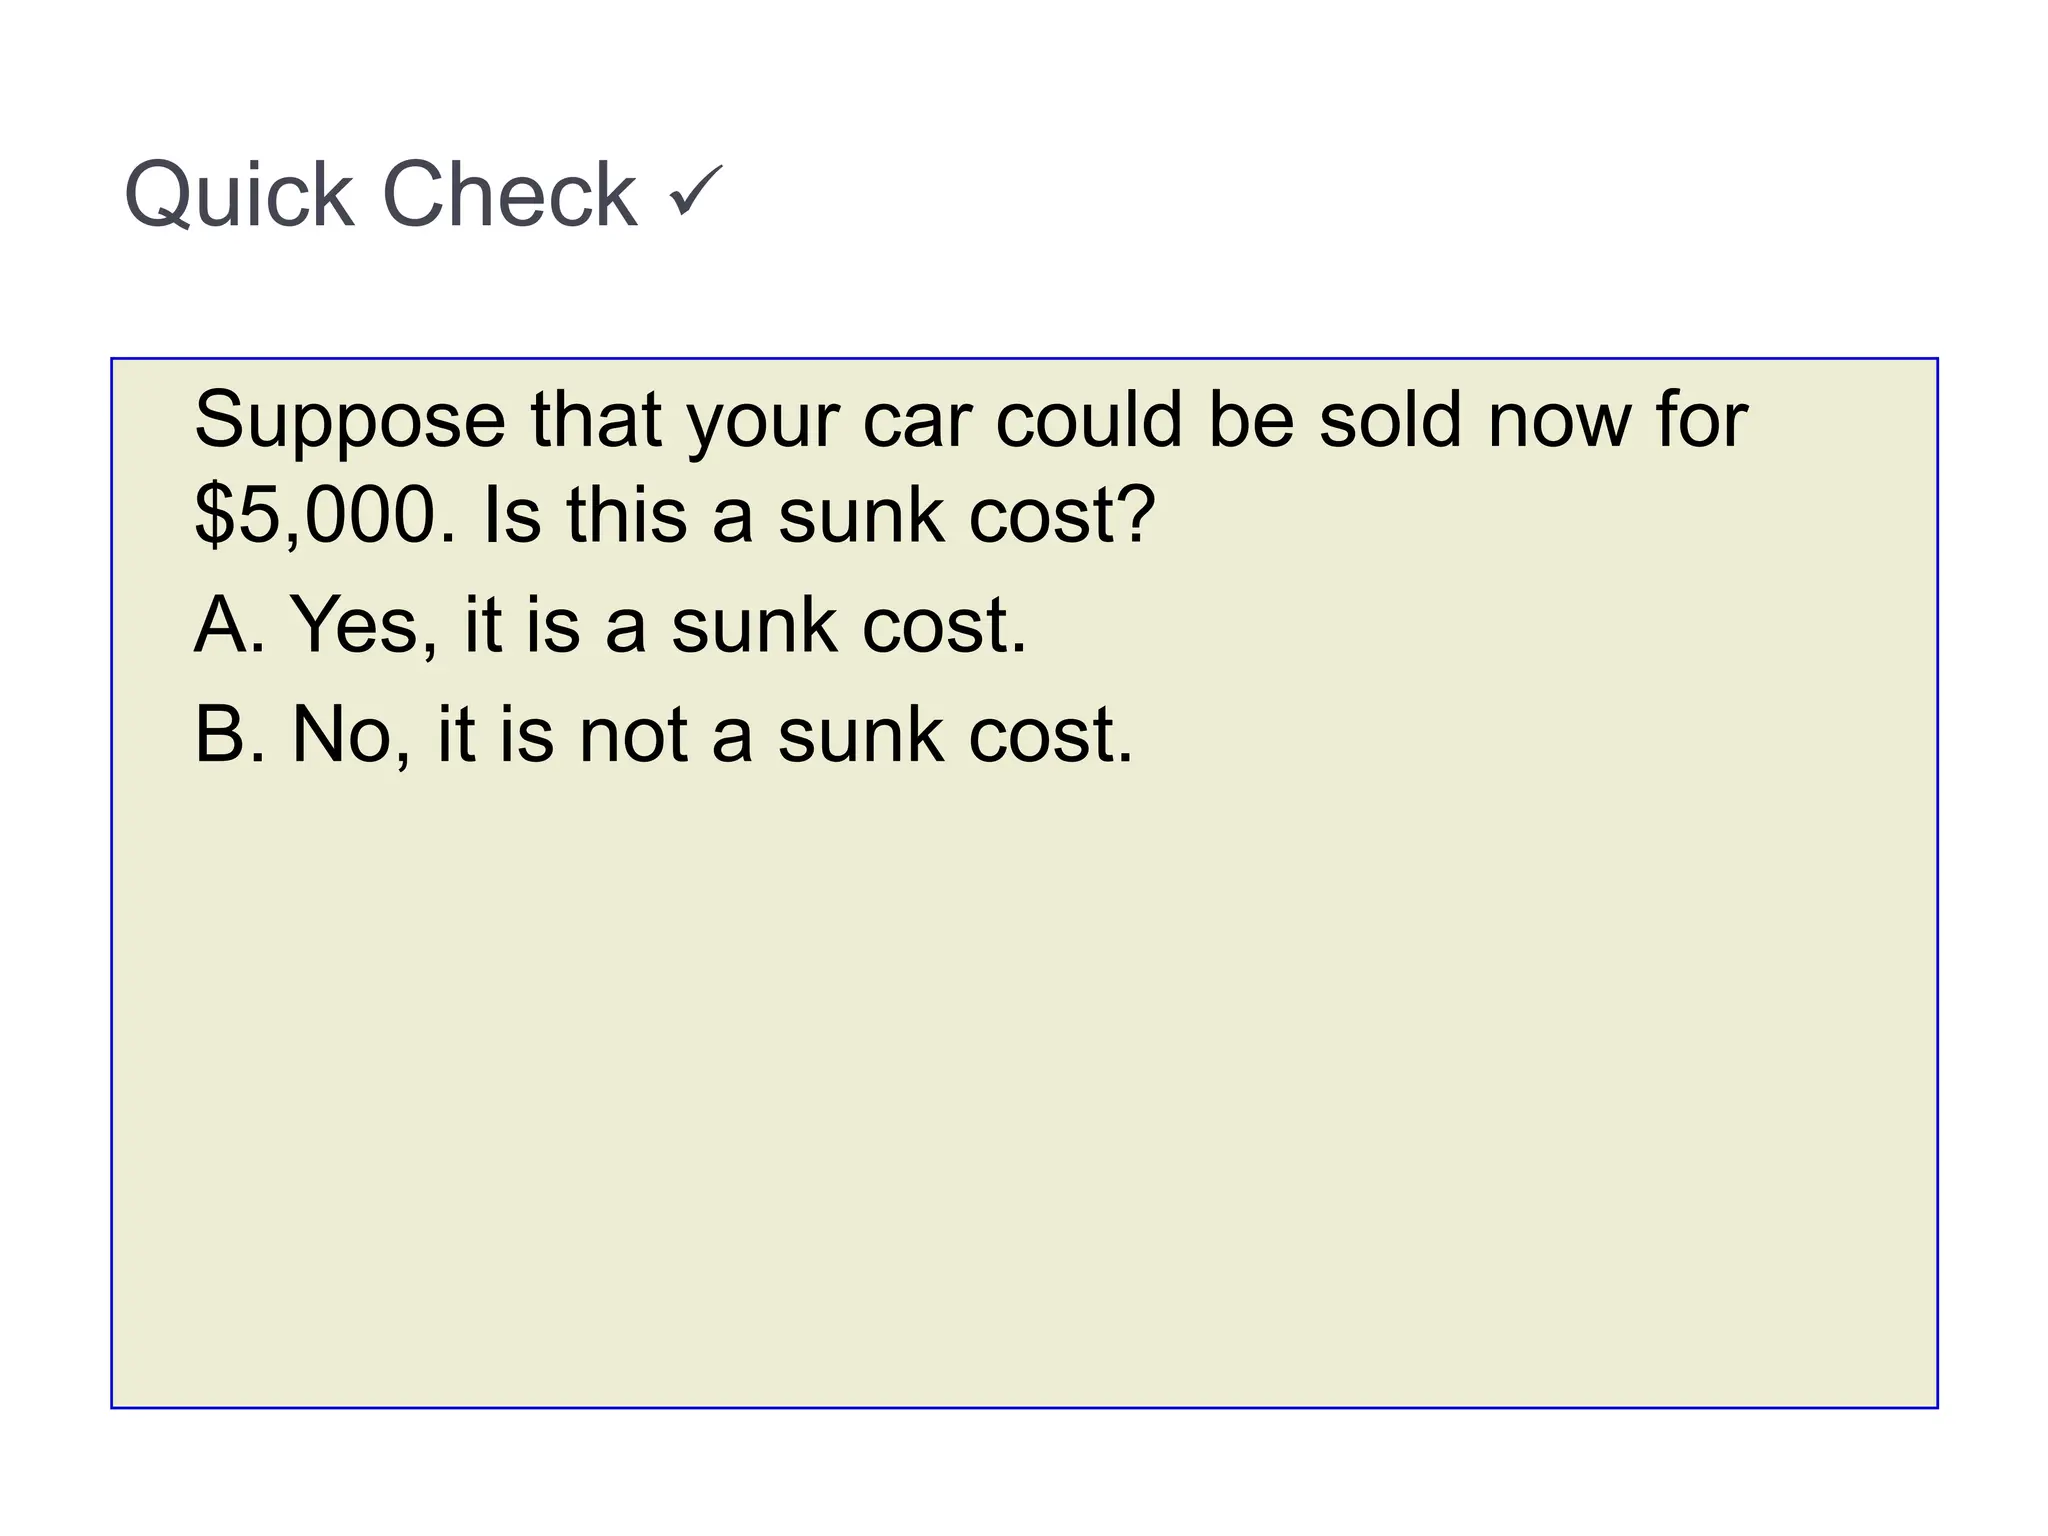
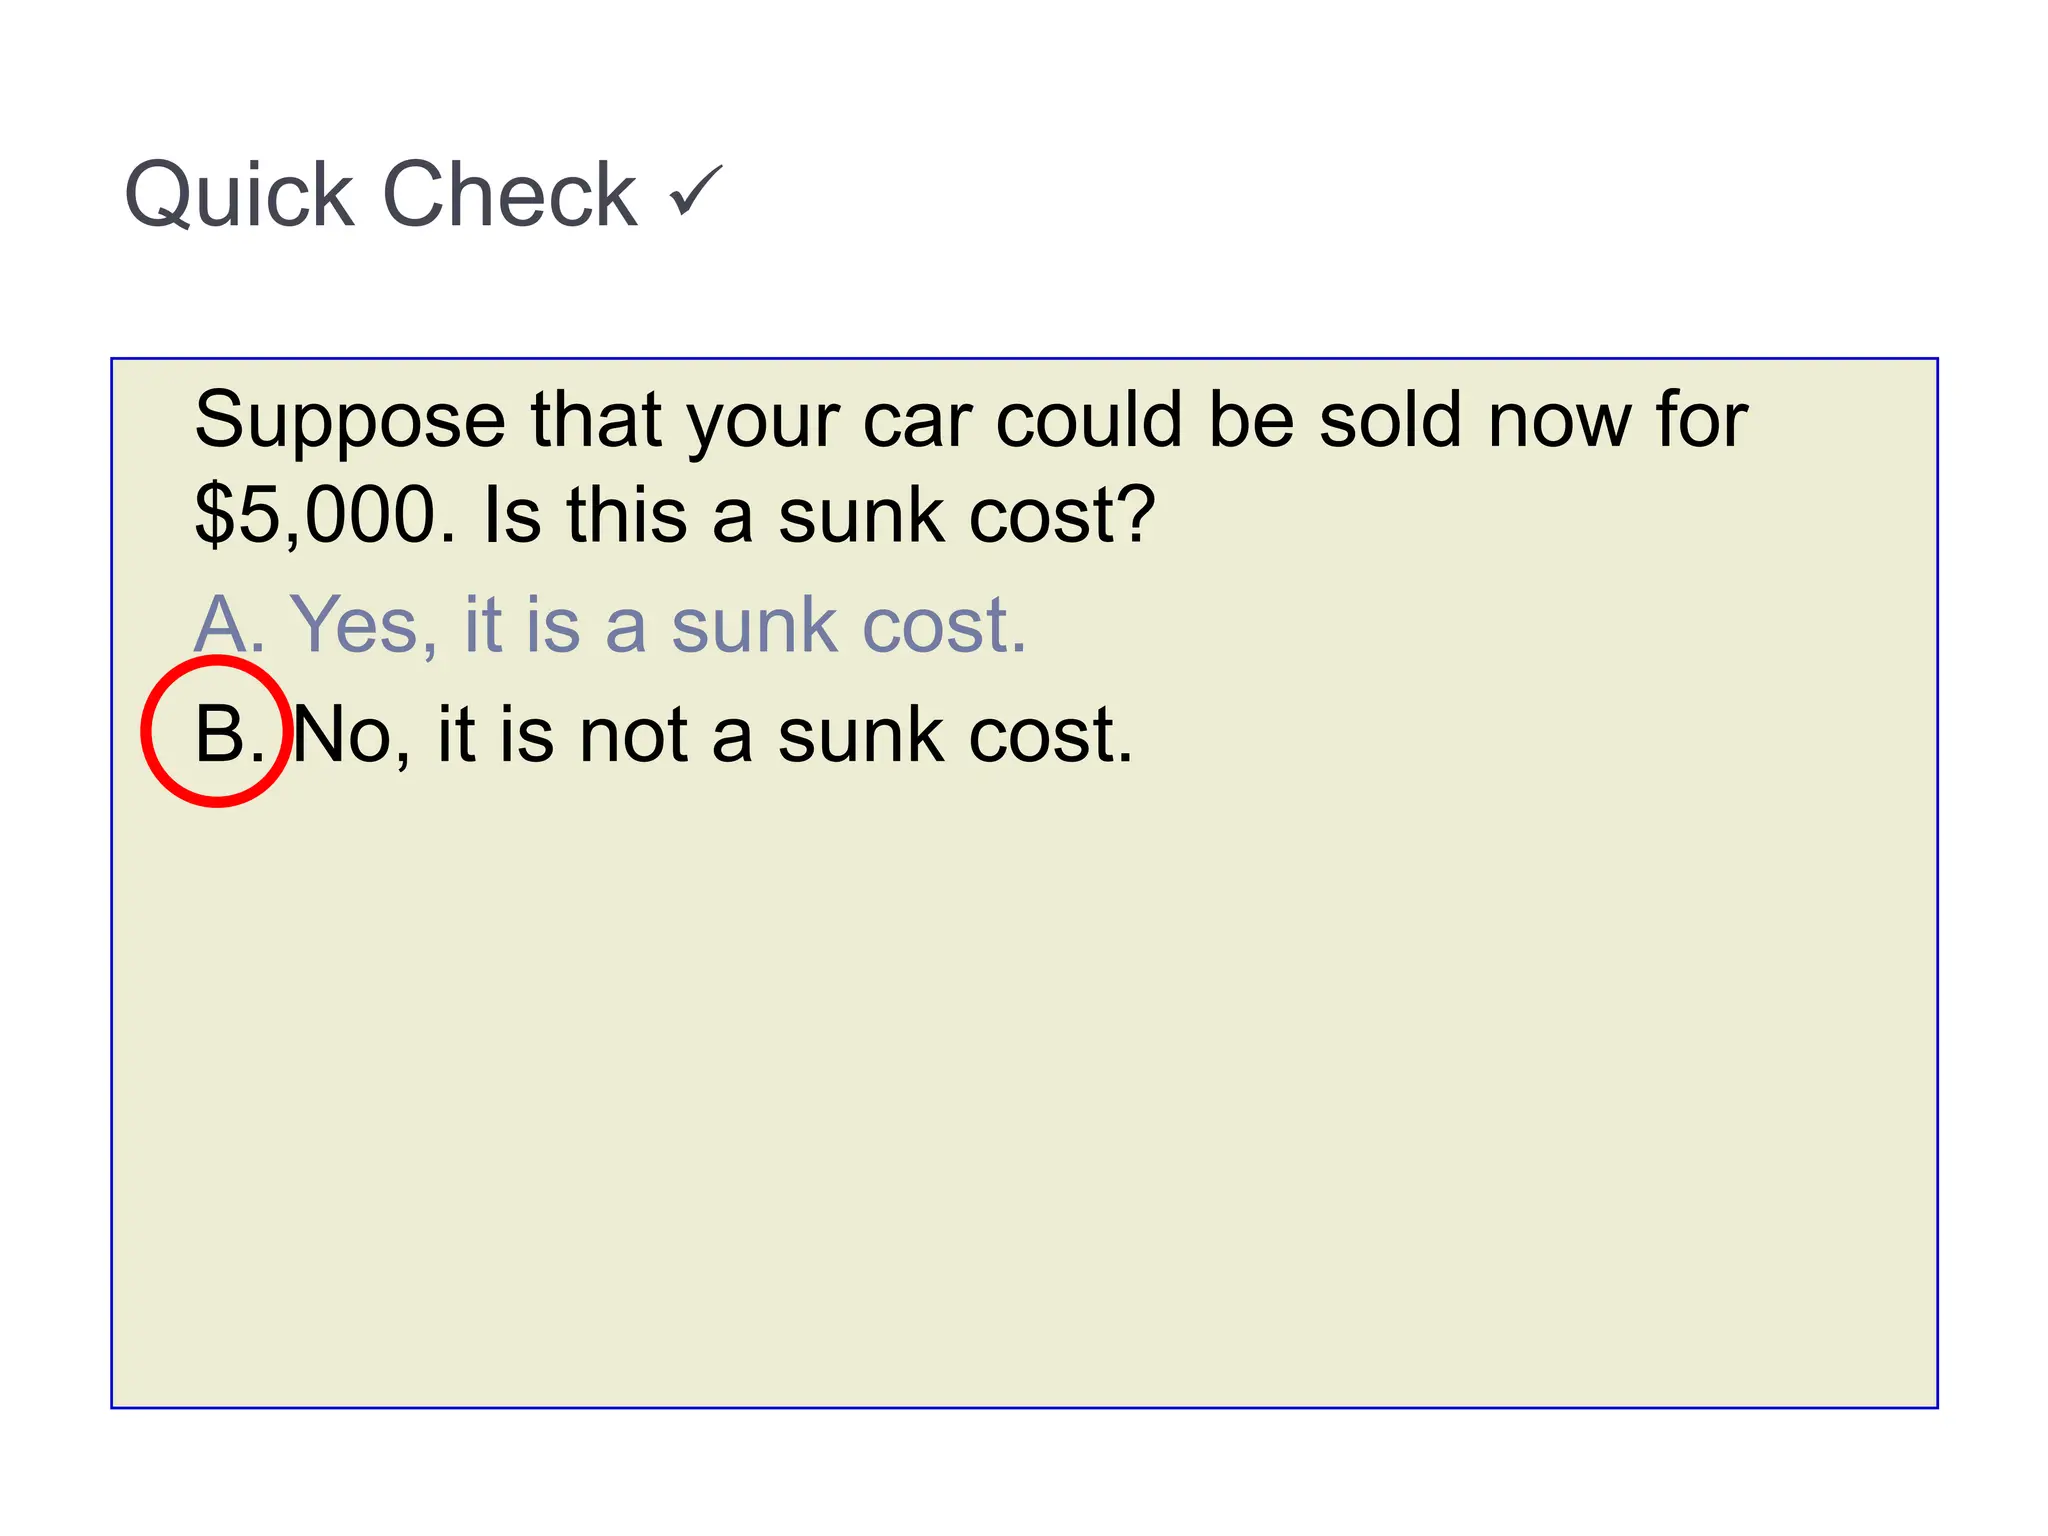
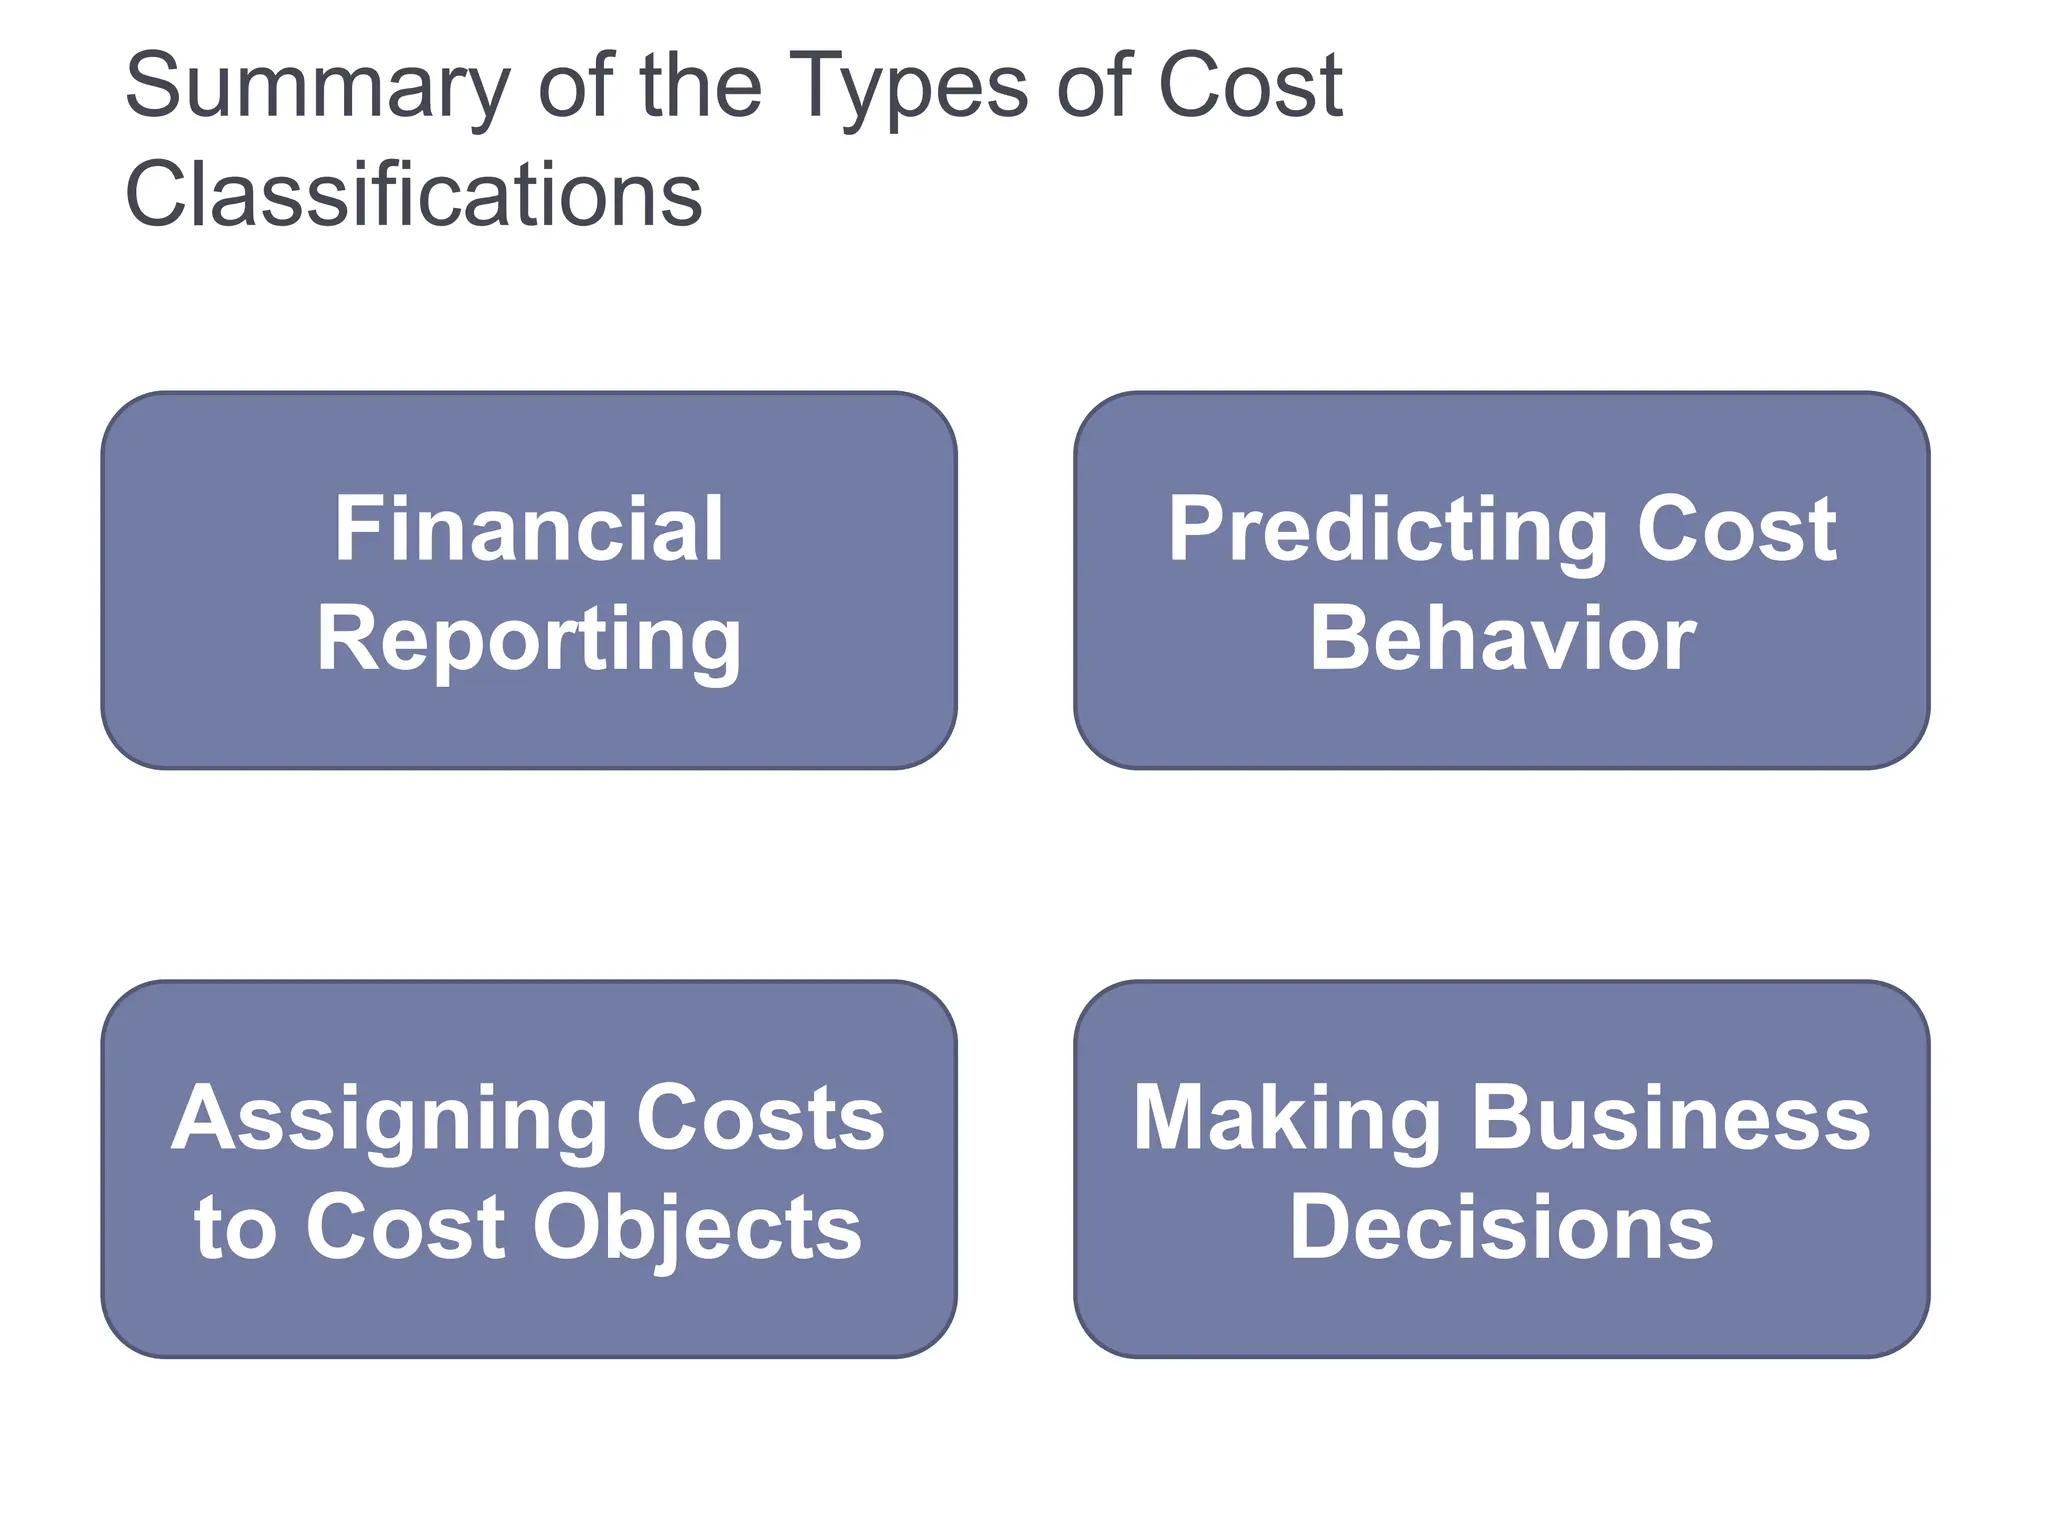
4. Directing and Motivating
Directing and motivating involves managing
day-to-day activities to keep the organization running
smoothly.
Employee work assignments.
Routine problem solving.
Conflict resolution.
Effective communications.
5. Controlling
The control function ensures
that plans are being followed.
Feedback in the form of performance reports
that compare actual results with the budget
are an essential part of the control function.
6. Planning and Control Cycle
Decision
Making
Formulating long-
and short-term plans
(Planning)
Measuring
performance
(Controlling)
Implementing
plans (Directing
and Motivating)
Comparing actual
to planned
performance
(Controlling)
Begin
8. Comparison of Financial and Managerial
Accounting
Financial Accounting Managerial Accounting
1. Users External persons who Managers who plan for
make financial decisions and control an organization
2. Time focus Historical perspective Future emphasis
3. Verifiability Emphasis on Emphasis on relevance
versus relevance verifiability for planning and control
4. Precision versus Emphasis on Emphasis on
timeliness precision timeliness
5. Subject Primary focus is on Focuses on segments
the whole organization of an organization
6. GAAP Must follow GAAP Need not follow GAAP
and prescribed formats or any prescribed format
7. Requirement Mandatory for Not
external reports Mandatory
11. Direct Materials
Raw materials that become an integral
part of the product and that can be
conveniently traced directly to it.
Example: A radio installed in an automobile
12. Direct Labor
Those labor costs that can be easily
traced to individual units of product.
Example: Wages paid to automobile assembly workers
13. Manufacturing costs that cannot be traced
directly to specific units produced.
Manufacturing Overhead
Examples: Indirect materials and indirect labor
Wages paid to employees
who are not directly
involved in production
work.
Examples: maintenance
workers, janitors and
security guards.
Materials used to support
the production process.
Examples: lubricants and
cleaning supplies used in the
automobile assembly plant.
16. Product Costs Versus Period Costs
Product costs include
direct materials, direct
labor, and
manufacturing
overhead.
Period costs include all
selling costs and
administrative costs.
Inventory Cost of Good Sold
Balance
Sheet
Income
Statement
Sale
Expense
Income
Statement
17. Quick Check
Which of the following costs would be considered a
period rather than a product cost in a manufacturing
company?
A. Manufacturing equipment depreciation.
B. Property taxes on corporate headquarters.
C. Direct materials costs.
D. Electrical costs to light the production
facility.
E. Sales commissions.
18. Quick Check
Which of the following costs would be considered a
period rather than a product cost in a manufacturing
company?
A. Manufacturing equipment depreciation.
B. Property taxes on corporate headquarters.
C. Direct materials costs.
D. Electrical costs to light the production
facility.
E. Sales commissions.
24. The Income Statement
Cost of goods sold for manufacturers differs only
slightly from cost of goods sold for merchandisers.
Manufacturing Company
Cost of goods sold:
Beg. finished
goods inv. 14,200
$
+ Cost of goods
manufactured 234,150
Goods available
for sale 248,350
$
- Ending
finished goods
inventory (12,100)
= Cost of goods
sold 236,250
$
Merchandising Company
Cost of goods sold:
Beg. merchandise
inventory 14,200
$
+ Purchases 234,150
Goods available
for sale 248,350
$
- Ending
merchandise
inventory (12,100)
= Cost of goods
sold 236,250
$
25. Basic Equation for Inventory Accounts
Beginning
balance
Additions
to inventory
+ =
Ending
balance
Withdrawals
from
inventory
+
26. Quick Check
If your inventory balance at the beginning of the
month was $1,000, you bought $100 during the
month, and sold $300 during the month, what would
be the balance at the end of the month?
A. $1,000.
B. $ 800.
C. $1,200.
D. $ 200.
27. Quick Check
If your inventory balance at the beginning of the
month was $1,000, you bought $100 during the
month, and sold $300 during the month, what would
be the balance at the end of the month?
A. $1,000.
B. $ 800.
C. $1,200.
D. $ 200.
$1,000 + $100 = $1,100
$1,100 - $300 = $800
29. Schedule of Cost of Goods Manufactured
Calculates the cost of raw
material, direct labor, and
manufacturing overhead
used in production.
Calculates the manufacturing
costs associated with goods
that were finished during the
period.
30. Manufacturing Work
Raw Materials Costs In Process
Beginning raw Direct materials
materials inventory
+ Raw materials
purchased
= Raw materials
available for use
in production
– Ending raw materials
inventory
= Raw materials used
in production
As items are removed from raw
materials inventory and placed into
the production process, they are
called direct materials.
Product Cost Flows
31. Manufacturing Work
Raw Materials Costs In Process
Beginning raw Direct materials
materials inventory + Direct labor
+ Raw materials + Mfg. overhead
purchased = Total manufacturing
= Raw materials costs
available for use
in production
– Ending raw materials
inventory
= Raw materials used
in production
Conversion
costs are costs
incurred to
convert the
direct material
into a finished
product.
Product Cost Flows
32. Manufacturing Work
Raw Materials Costs In Process
Beginning raw Direct materials Beginning work in
materials inventory + Direct labor process inventory
+ Raw materials + Mfg. overhead + Total manufacturing
purchased = Total manufacturing costs
= Raw materials costs = Total work in
available for use process for the
in production period
– Ending raw materials
inventory
= Raw materials used
in production
Product Cost Flows
All manufacturing costs incurred
during the period are added to the
beginning balance of work in
process.
33. Manufacturing Work
Raw Materials Costs In Process
Beginning raw Direct materials Beginning work in
materials inventory + Direct labor process inventory
+ Raw materials + Mfg. overhead + Total manufacturing
purchased = Total manufacturing costs
= Raw materials costs = Total work in
available for use process for the
in production period
– Ending raw materials – Ending work in
inventory process inventory
= Raw materials used = Cost of goods
in production manufactured
Product Cost Flows
Costs associated with the goods that
are completed during the period are
transferred to finished goods
inventory.
34. Work
In Process Finished Goods
Beginning work in Beginning finished
process inventory goods inventory
+ Manufacturing costs + Cost of goods
for the period manufactured
= Total work in process = Cost of goods
for the period available for sale
– Ending work in - Ending finished
process inventory goods inventory
= Cost of goods Cost of goods
manufactured sold
Product Cost Flows
35. Manufacturing Cost Flows
Finished
Goods
Cost of
Goods
Sold
Selling and
Administrative
Period Costs
Selling and
Administrative
Manufacturing
Overhead
Work in
Process
Direct Labor
Balance Sheet
Costs Inventories
Income
Statement
Expenses
Material Purchases Raw Materials
36. Quick Check
Beginning raw materials inventory was $32,000.
During the month, $276,000 of raw material was
purchased. A count at the end of the month
revealed that $28,000 of raw material was still
present. What is the cost of direct material
used?
A. $276,000
B. $272,000
C. $280,000
D. $ 2,000
37. Quick Check
Beginning raw materials inventory was $32,000.
During the month, $276,000 of raw material was
purchased. A count at the end of the month
revealed that $28,000 of raw material was still
present. What is the cost of direct material
used?
A. $276,000
B. $272,000
C. $280,000
D. $ 2,000
Beg. raw materials 32,000
$
+ Raw materials
purchased 276,000
= Raw materials available
for use in production 308,000
$
– Ending raw materials
inventory 28,000
= Raw materials used
in production 280,000
$
38. Quick Check
Direct materials used in production totaled
$280,000. Direct labor was $375,000 and
factory overhead was $180,000. What were total
manufacturing costs incurred for the month?
A. $555,000
B. $835,000
C. $655,000
D. Cannot be determined.
39. Direct materials used in production totaled
$280,000. Direct labor was $375,000 and
factory overhead was $180,000. What were total
manufacturing costs incurred for the month?
A. $555,000
B. $835,000
C. $655,000
D. Cannot be determined.
Direct Materials 280,000
$
+ Direct Labor 375,000
+ Mfg. Overhead 180,000
= Mfg. Costs Incurred
for the Month 835,000
$
Quick Check
40. Quick Check
Beginning work in process was $125,000.
Manufacturing costs incurred for the month
were $835,000. There were $200,000 of
partially finished goods remaining in work in
process inventory at the end of the month.
What was the cost of goods manufactured
during the month?
A. $1,160,000
B. $ 910,000
C. $ 760,000
D. Cannot be determined.
41. Beginning work in process was $125,000.
Manufacturing costs incurred for the month
were $835,000. There were $200,000 of
partially finished goods remaining in work in
process inventory at the end of the month.
What was the cost of goods manufactured
during the month?
A. $1,160,000
B. $ 910,000
C. $ 760,000
D. Cannot be determined.
Quick Check
Beginning work in
process inventory 125,000
$
+ Mfg. costs incurred
for the period 835,000
= Total work in process
during the period 960,000
$
– Ending work in
process inventory 200,000
= Cost of goods
manufactured 760,000
$
42. Quick Check
Beginning finished goods inventory was
$130,000. The cost of goods manufactured for
the month was $760,000. And the ending
finished goods inventory was $150,000. What
was the cost of goods sold for the month?
A. $ 20,000.
B. $740,000.
C. $780,000.
D. $760,000.
43. Quick Check
Beginning finished goods inventory was
$130,000. The cost of goods manufactured for
the month was $760,000. And the ending
finished goods inventory was $150,000. What
was the cost of goods sold for the month?
A. $ 20,000.
B. $740,000.
C. $780,000.
D. $760,000.
$130,000 + $760,000 = $890,000
$890,000 - $150,000 = $740,000
45. Cost Classifications for Predicting Cost
Behavior
How a cost will react to
changes in the level of
activity within the
relevant range.
Total variable costs
change when activity
changes.
Total fixed costs remain
unchanged when activity
changes.
46. Variable Cost
Your total texting bill is based on how
many texts you send.
Number of Texts Sent
Total
Texting
Bill
47. Variable Cost Per Unit
Number of Texts Sent
Cost
Per
Text
Sent
The cost per text sent is constant at
5 cents per text.
48. Fixed Cost
Your monthly contract fee for your cell phone is fixed
for the number of monthly minutes in your contract.
The monthly contract fee does not change based on
the number of calls you make.
Number of Minutes Used
Within Monthly Plan
Monthly
Cell
Phone
Contract
Fee
49. Fixed Cost Per Unit
Number of Minutes Used
Within Monthly Plan
Monthly
Cell
Phone
Contract
Fee
Within the monthly contract allotment, the average
fixed cost per cell phone call made decreases as
more calls are made.
50. Cost Classifications for Predicting Cost
Behavior
Behavior of Cost (within the relevant range)
Cost In Total Per Unit
Variable Total variable cost changes Variable cost per unit remains
as activity level changes. the same over wide ranges
of activity.
Fixed Total fixed cost remains Average fixed cost per unit goes
the same even when the down as activity level goes up.
activity level changes.
51. Quick Check
Which of the following costs would be variable
with respect to the number of cones sold at a
Baskins & Robbins shop? (There may be more
than one correct answer.)
A. The cost of lighting the store.
B. The wages of the store manager.
C. The cost of ice cream.
D. The cost of napkins for customers.
52. Quick Check
Which of the following costs would be variable
with respect to the number of cones sold at a
Baskins & Robbins shop? (There may be more
than one correct answer.)
A. The cost of lighting the store.
B. The wages of the store manager.
C. The cost of ice cream.
D. The cost of napkins for customers.
54. Assigning Costs to Cost Objects
Direct costs
Costs that can be
easily and
conveniently traced
to a unit of product
or other cost object.
Examples: direct
material and direct
labor
Indirect costs
Costs that cannot be
easily and
conveniently traced
to a unit of product
or other cost object.
Example:
manufacturing
overhead
McGraw-Hill/Irwin
55. Learning Objective 8
Define and give examples
of cost classifications used
in making decisions:
differential costs,
opportunity costs, and
sunk costs.
56. Every decision involves a choice
between at least two
alternatives.
Only those costs and benefits
that differ between alternatives
are relevant in a decision. All
other costs and benefits can
and should be ignored.
Cost Classifications for Decision Making
57. Differential Cost and Revenue
Costs and revenues that differ
among alternatives.
Example: You have a job paying $1,500 per month in
your hometown. You have a job offer in a neighboring
city that pays $2,000 per month. The commuting cost
to the city is $300 per month.
Differential revenue is:
$2,000 – $1,500 = $500
Differential cost is:
$300
58. Opportunity Cost
The potential benefit that is given
up when one alternative is selected
over another.
Example: If you were
not attending college,
you could be earning
$15,000 per year.
Your opportunity cost
of attending college for
one year is $15,000.
59. Sunk Costs
Sunk costs have already been incurred and cannot
be changed now or in the future. These costs
should be ignored when making decisions.
Example: You bought an automobile that cost
$10,000 two years ago. The $10,000 cost is sunk
because whether you drive it, park it, trade it, or sell
it, you cannot change the $10,000 cost.
60. Quick Check
Suppose you are trying to decide whether to
drive or take the train to Portland to attend a
concert. You have ample cash to do either, but
you don’t want to waste money needlessly. Is
the cost of the train ticket relevant in this
decision? In other words, should the cost of the
train ticket affect the decision of whether you
drive or take the train to Portland?
A. Yes, the cost of the train ticket is relevant.
B. No, the cost of the train ticket is not relevant.
61. Quick Check
Suppose you are trying to decide whether to
drive or take the train to Portland to attend a
concert. You have ample cash to do either, but
you don’t want to waste money needlessly. Is
the cost of the train ticket relevant in this
decision? In other words, should the cost of the
train ticket affect the decision of whether you
drive or take the train to Portland?
A. Yes, the cost of the train ticket is relevant.
B. No, the cost of the train ticket is not relevant.
62. Quick Check
Suppose you are trying to decide whether to
drive or take the train to Portland to attend a
concert. You have ample cash to do either, but
you don’t want to waste money needlessly. Is
the annual cost of licensing your car relevant in
this decision?
A. Yes, the licensing cost is relevant.
B. No, the licensing cost is not relevant.
63. Quick Check
Suppose you are trying to decide whether to
drive or take the train to Portland to attend a
concert. You have ample cash to do either, but
you don’t want to waste money needlessly. Is
the annual cost of licensing your car relevant in
this decision?
A. Yes, the licensing cost is relevant.
B. No, the licensing cost is not relevant.
64. Quick Check
Suppose that your car could be sold now for
$5,000. Is this a sunk cost?
A. Yes, it is a sunk cost.
B. No, it is not a sunk cost.
65. Quick Check
Suppose that your car could be sold now for
$5,000. Is this a sunk cost?
A. Yes, it is a sunk cost.
B. No, it is not a sunk cost.
66. Summary of the Types of Cost
Classifications
Financial
Reporting
Predicting Cost
Behavior
Assigning Costs
to Cost Objects
Making Business
Decisions
68. Learning Objective 9
(Appendix 2A)
Properly account for labor
costs associated with idle
time, overtime, and fringe
benefits.
69. Idle Time
The labor costs incurred
during idle time are ordinarily
treated as manufacturing
overhead.
Machine
Breakdowns
Material
Shortages
Power
Failures
71. Labor Fringe Benefits
Fringe benefits include employer paid
costs for insurance programs, retirement
plans, supplemental unemployment
programs, Social Security, Medicare,
workers’ compensation, and
unemployment taxes.
Some companies
include all of these
costs in
manufacturing
overhead.
Other companies treat
fringe benefit
expenses of direct
laborers as additional
direct labor costs.
74. Quality of Conformance
When the overwhelming majority of products
produced conform to design specifications
and are free from defects.
75. Prevention and Appraisal Costs
Prevention
Costs
Support activities
whose purpose is to
reduce the number of
defects
Appraisal Costs
Incurred to identify
defective products
before the products are
shipped to customers
76. Internal and External Failure Costs
Internal Failure
Costs
Incurred as a result of
identifying defects
before they are shipped
External Failure
Costs
Incurred as a result of
defective products
being delivered to
customers
77. Examples of Quality Costs
Prevention Costs
• Quality training
• Quality circles
• Statistical process
control activities
Appraisal Costs
• Testing and inspecting
incoming materials
• Final product testing
• Depreciation of testing
equipment
Internal Failure Costs
• Scrap
• Spoilage
• Rework
External Failure Costs
• Cost of field servicing and
handling complaints
• Warranty repairs
• Lost sales
80. Quality cost
reports provide
an estimate of
the financial
consequences
of the
company’s
current defect
rate.
Amount Percent* Amount Percent*
Prevention costs:
Systems development 400,000
$ 0.80% 270,000
$ 0.54%
Quality training 210,000 0.42% 130,000 0.26%
Supervision of prevention activities 70,000 0.14% 40,000 0.08%
Quality improvement 320,000 0.64% 210,000 0.42%
Total prevention cost 1,000,000 2.00% 650,000 1.30%
Appraisal costs:
Inspection 600,000 1.20% 560,000 1.12%
Reliability testing 580,000 1.16% 420,000 0.84%
Supervision of testing and inspection 120,000 0.24% 80,000 0.16%
Depreciation of test equipment 200,000 0.40% 140,000 0.28%
Total appraisal cost 1,500,000 3.00% 1,200,000 2.40%
Internal failure costs:
Net cost of scrap 900,000 1.80% 750,000 1.50%
Rework labor and overhead 1,430,000 2.86% 810,000 1.62%
Downtime due to defects in quality 170,000 0.34% 100,000 0.20%
Disposal of defective products 500,000 1.00% 340,000 0.68%
Total internal failure cost 3,000,000 6.00% 2,000,000 4.00%
External failure costs:
Warranty repairs 400,000 0.80% 900,000 1.80%
Warranty replacements 870,000 1.74% 2,300,000 4.60%
Allowances 130,000 0.26% 630,000 1.26%
Cost of field servicing 600,000 1.20% 1,320,000 2.64%
Total external failure cost 2,000,000 4.00% 5,150,000 10.30%
Total quality cost 7,500,000
$ 15.00% 9,000,000
$ 18.00%
* As a percentage of total sales. In each year sales totaled $50,000,000.
Year 2 Year 1
Quality Cost Report
For Years 1 and 2
81. Quality Cost Reports in Graphic Form
$10
9
8
7
6
5
4
3
2
1
Appraisal
0
Prevention Prevention
1 2
Year
Quality
Cost
(in
millions)
Appraisal
Internal
Failure
External
Failure
Internal
Failure
External
Failure
20
18
16
14
12
10
8
6
4
2
Appraisal
0
Prevention Prevention
1 2
Year
Quality
Cost
as
a
Percentage
of
Sales
Appraisal
Internal
Failure
External
Failure
Internal
Failure
External
Failure
Quality
reports
can also
be
prepared
in
graphic
form.
82. Uses of Quality Cost Information
Help managers see the
financial significance of
defects.
Help managers identify
the relative importance
of the quality problems.
Help managers see
whether their quality
costs are poorly
distributed.
83. Limitations of Quality Cost Information
Simply measuring and
reporting quality cost
problems does not solve
quality problems.
Results usually lag
behind quality
improvement programs.
The most important
quality cost, lost sales, is
often omitted from
quality cost reports.
84. ISO 9000 Standards
ISO 9000 standards have become
international measures of quality.
To become ISO 9000 certified, a
company must demonstrate:
1. A quality control system is in use, and the
system clearly defines an expected level of
quality.
2. The system is fully operational and is
backed up with detailed documentation of
quality control procedures.
3. The intended level of quality is being
achieved on a sustained basis.
Chapter 2: Managerial Accounting and Cost Concepts.
This chapter explains the differences and similarities between financial and managerial accounting. It also explains how managers need to rely upon different classifications of costs for different purposes. The four main purposes emphasized in this chapter include preparing external financial reports, predicting cost behavior, assigning costs to cost objects, and making business decisions.