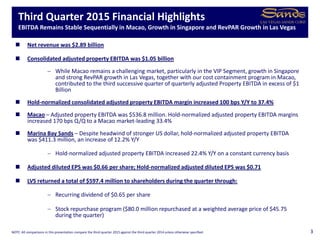
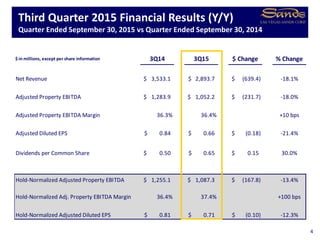
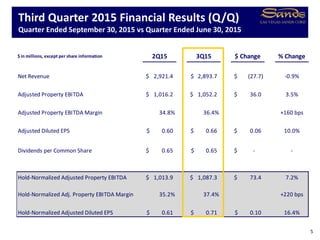
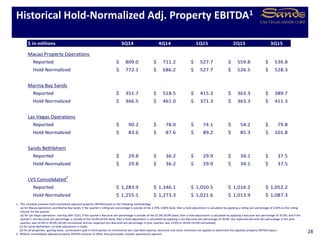
- The document is the 3Q15 earnings presentation for Las Vegas Sands Corp. It provides financial highlights for the quarter including net revenue, adjusted property EBITDA, margins, EPS, and dividends paid.
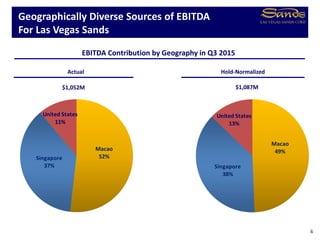
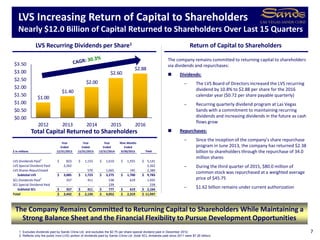
- Geographically, EBITDA was derived 49% from Macao, 38% from Singapore, and 13% from the United States. Both LVS and Sands China are committed to returning capital to shareholders through dividends and share repurchases, with over $12 billion returned over the last 15 quarters.
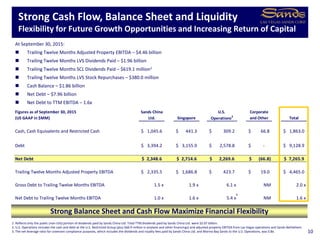
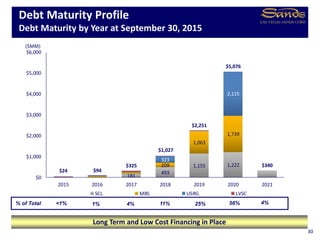
- LVS maintains a strong balance sheet and cash flow with a net debt to TTM EBITDA of 1.6x providing flexibility for growth and capital returns.