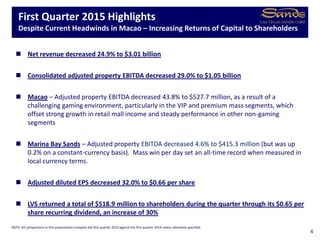
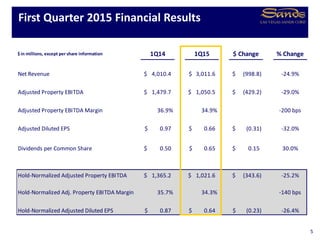
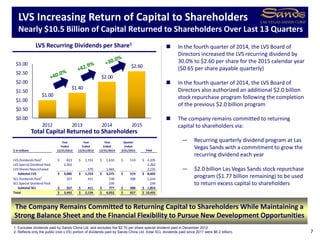
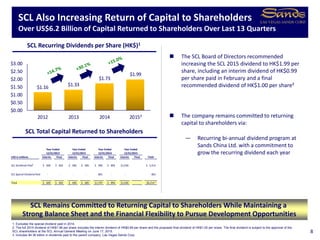
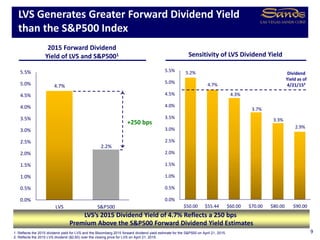
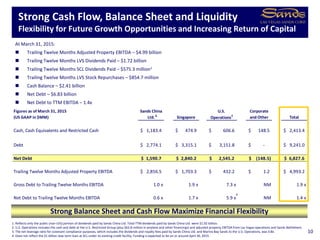
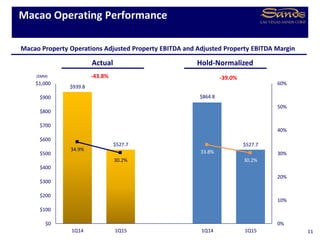
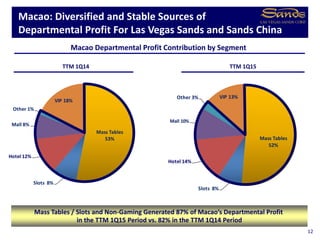
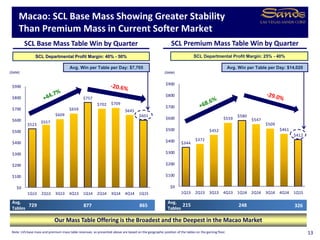
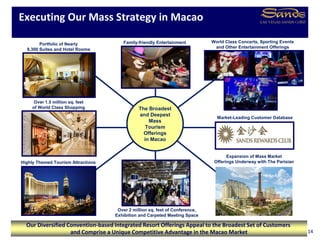
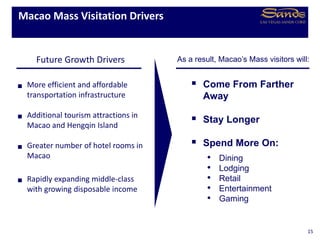
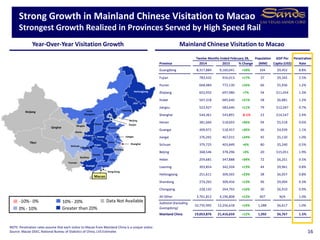
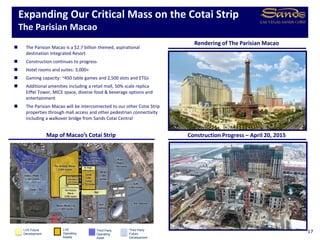
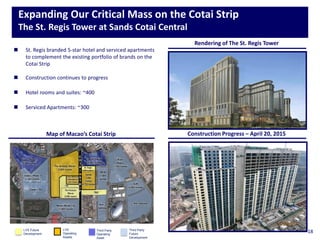
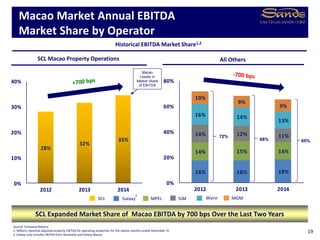
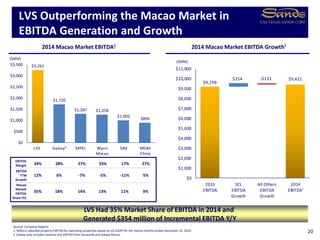
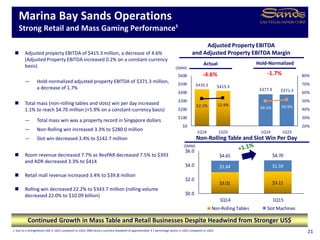
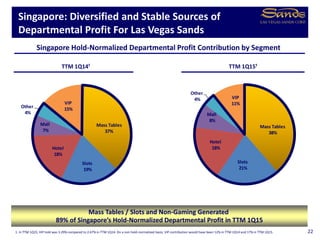
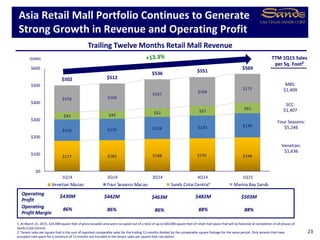
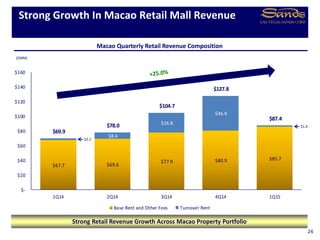
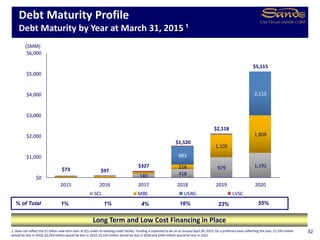
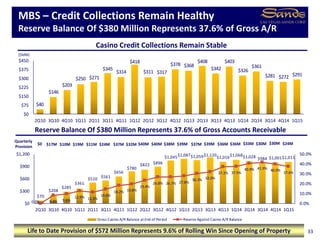
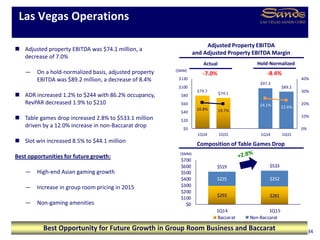
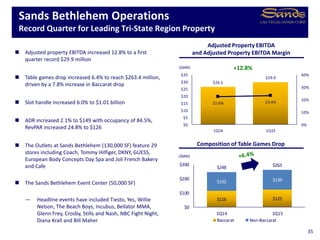
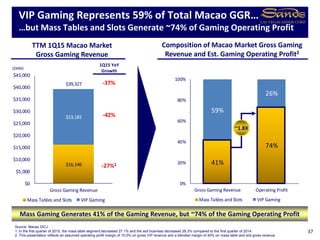
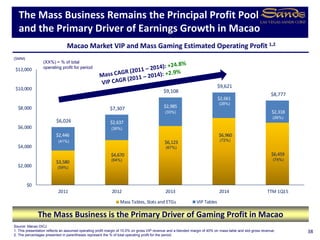
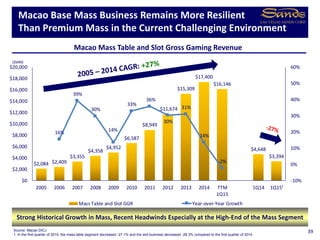
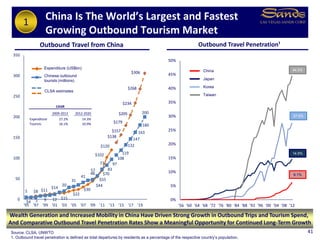
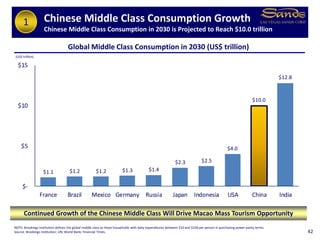
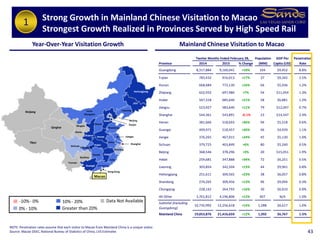
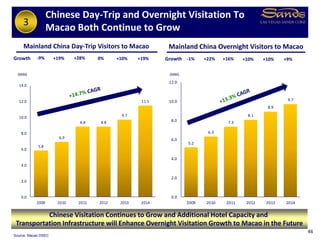
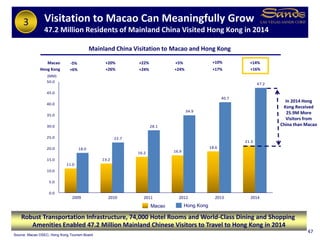
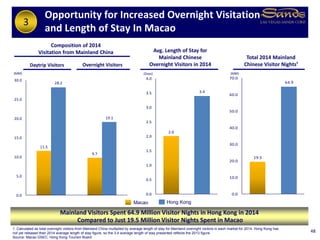
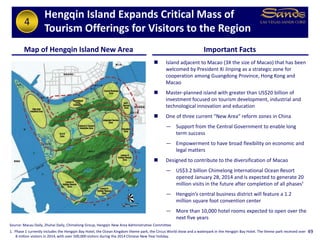
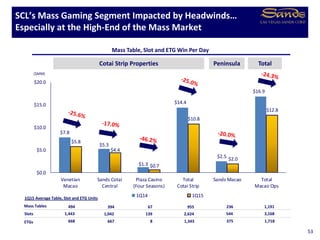
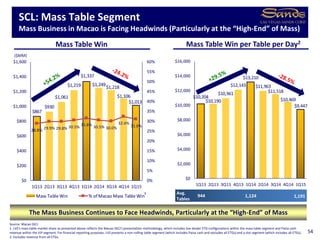
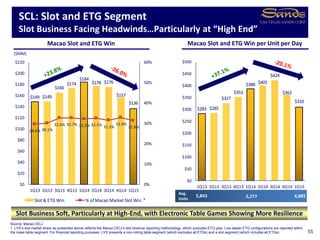
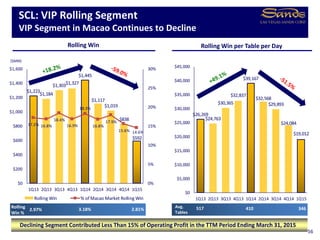
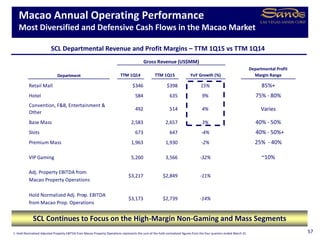
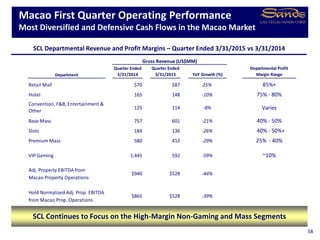
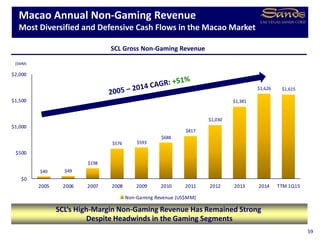
SlideShare a Scribd company logo
The Venetian Macao Marina Bay Sands, Singapore
Sands Macao Four Seasons Macao Sands Bethlehem The Venetian Las Vegas The Palazzo Las Vegas
1Q15 Earnings Call Presentation
April 22, 2015
The Parisian MacaoSands Cotai Central, Macao
This presentation contains forward-looking statements that are made pursuant to the
Safe Harbor Provisions of the Private Securities Litigation Reform Act of 1995. Forward-
looking statements involve a number of risks, uncertainties or other factors beyond the
company’s control, which may cause material differences in actual results, performance
or other expectations. These factors include, but are not limited to, general economic
conditions, competition, new ventures, substantial leverage and debt service,
government regulation, legalization of gaming, interest rates, future terrorist acts,
influenza, insurance, gaming promoters, risks relating to our gaming licenses, certificate
and subconcession, infrastructure in Macao and other factors detailed in the reports
filed by Las Vegas Sands Corp. with the Securities and Exchange Commission. Readers
are cautioned not to place undue reliance on these forward-looking statements, which
speak only as of the date thereof. Las Vegas Sands Corp. assumes no obligation to
update such information.
Forward Looking Statements
2
 The global leader in Integrated Resort development and operation, delivering strong and
diversified cash flow and earnings as well as growing recurring dividends
 Best positioned operator to deliver growth in Asia, with the pre-eminent destination
Integrated Resort properties in the world’s largest and fastest growing consumer markets
 Uniquely positioned to bring unmatched track record, powerful convention-based business
model and the industry’s strongest balance sheet to the world’s most promising Integrated
Resort development opportunities
 Committed to maximizing shareholder returns by delivering long-term growth while
continuing to increase the return of capital to shareholders through recurring dividend and
stock repurchase programs
 The industry’s most experienced leadership team: visionary, disciplined and dedicated to
driving long-term shareholder value
The Investment Case for Las Vegas Sands
3
Maximizing Return to Shareholders by:
1. Delivering long-term growth in current markets
2. Using leadership position in convention-based Integrated Resort development and
operation to pursue global growth opportunities
3. Increasing return of capital to shareholders
 Net revenue decreased 24.9% to $3.01 billion
 Consolidated adjusted property EBITDA decreased 29.0% to $1.05 billion
 Macao – Adjusted property EBITDA decreased 43.8% to $527.7 million, as a result of a
challenging gaming environment, particularly in the VIP and premium mass segments, which
offset strong growth in retail mall income and steady performance in other non-gaming
segments
 Marina Bay Sands – Adjusted property EBITDA decreased 4.6% to $415.3 million (but was up
0.2% on a constant-currency basis). Mass win per day set an all-time record when measured in
local currency terms.
 Adjusted diluted EPS decreased 32.0% to $0.66 per share
 LVS returned a total of $518.9 million to shareholders during the quarter through its $0.65 per
share recurring dividend, an increase of 30%
First Quarter 2015 Highlights
Despite Current Headwinds in Macao – Increasing Returns of Capital to Shareholders
4
NOTE: All comparisons in this presentation compare the first quarter 2015 against the first quarter 2014 unless otherwise specified.
$ in millions, except per share information 1Q14 1Q15 $ Change % Change
Net Revenue 4,010.4$ 3,011.6$ (998.8)$ -24.9%
Adjusted Property EBITDA 1,479.7$ 1,050.5$ (429.2)$ -29.0%
Adjusted Property EBITDA Margin 36.9% 34.9% -200 bps
Adjusted Diluted EPS 0.97$ 0.66$ (0.31)$ -32.0%
Dividends per Common Share 0.50$ 0.65$ 0.15$ 30.0%
Hold-Normalized Adjusted Property EBITDA 1,365.2$ 1,021.6$ (343.6)$ -25.2%
Hold-Normalized Adj. Property EBITDA Margin 35.7% 34.3% -140 bps
Hold-Normalized Adjusted Diluted EPS 0.87$ 0.64$ (0.23)$ -26.4%
First Quarter 2015 Financial Results
5
 Macao – Growth in retail mall continues, VIP and premium mass gaming soft
— Mass table win decreased 24.2% to $1.01 billion (compared to a 27.1%¹ decrease in the Macao
market)
— Slot and ETG win decreased 26.0% to $136.4 million (compared to a 26.3%¹ decrease in the Macao
market)
— Retail mall revenue increased 25.0% to $87.4 million
— Rolling win decreased 59.0% to $592.4 million
 Singapore – Growth in mass and retail
— Mass table and slot win increased 1.1% to $422.6 million ($4.70 million win per day)
— Retail mall revenue increased 3.4% to $39.8 million
— Rolling win decreased 22.2% to $343.7 million
— RevPAR decreased 7.5% to $393, ADR decreased 3.3% to $414 and room revenue decreased 7.7%
to $89.6 million
Macao – Growth in Retail; Challenging Gaming Environment
Singapore – Growth in Mass Gaming and Retail
61. Based on Macao DICJ disclosure.
Year Year Year Quarter
Ended Ended Ended Ended
$ in millions 12/31/2012 12/31/2013 12/31/2014 3/31/2015 Total
LVS Dividends Paid1
823$ 1,153$ 1,610$ 519$ 4,105$
LVS Special Dividend Paid 2,262 - - - 2,262
LVS Shares Repurchased - 570 1,665 - 2,235
Subtotal LVS 3,085$ 1,723$ 3,275$ 519$ 8,602$
SCL Dividends Paid
2
357 411 538 308 1,614
SCL Special Dividend Paid - - 239 - 239
Subtotal SCL 357$ 411$ 777$ 308$ 1,853$
Total 3,442$ 2,134$ 4,052$ 827$ 10,455$
$1.00
$1.40
$2.00
$2.60
$0.00
$0.50
$1.00
$1.50
$2.00
$2.50
$3.00
2012 2013 2014 2015
7
LVS Increasing Return of Capital to Shareholders
Nearly $10.5 Billion of Capital Returned to Shareholders Over Last 13 Quarters
LVS Recurring Dividends per Share1
 In the fourth quarter of 2014, the LVS Board of
Directors increased the LVS recurring dividend by
30.0% to $2.60 per share for the 2015 calendar year
($0.65 per share payable quarterly)
 In the fourth quarter of 2014, the LVS Board of
Directors also authorized an additional $2.0 billion
stock repurchase program following the completion
of the previous $2.0 billion program
 The company remains committed to returning
capital to shareholders via:
— Recurring quarterly dividend program at Las
Vegas Sands with a commitment to grow the
recurring dividend each year
— $2.0 billion Las Vegas Sands stock repurchase
program ($1.77 billion remaining) to be used
to return excess capital to shareholders
1. Excludes dividends paid by Sands China Ltd. and excludes the $2.75 per share special dividend paid in December 2012.
2. Reflects only the public (non-LVS) portion of dividends paid by Sands China Ltd. (total SCL dividends paid since 2011 were $6.2 billion).
The Company Remains Committed to Returning Capital to Shareholders While Maintaining a
Strong Balance Sheet and the Financial Flexibility to Pursue New Development Opportunities
Total Capital Returned to Shareholders
US$ in millions Interim Final Interim Final Interim Final Interim Final Total
SCL Dividends Paid
1
600$ 602$ 696$ 685$ 906$ 894$ 1,030$ 5,413$
SCL Special Dividend Paid - - - - 801 - - 801
Total 600$ 602$ 696$ 685$ 1,707$ 894$ 1,030$ $6,214 ³
Year Ended
12/31/201512/31/2012
Year Ended Year Ended Year Ended
12/31/2013 12/31/2014
$1.16 $1.33
$1.73
$1.99
$0.00
$0.50
$1.00
$1.50
$2.00
$2.50
$3.00
2012 2013 2014 2015²
8
SCL Also Increasing Return of Capital to Shareholders
Over US$6.2 Billion of Capital Returned to Shareholders Over Last 13 Quarters
SCL Recurring Dividends per Share (HK$)1
 The SCL Board of Directors recommended
increasing the SCL 2015 dividend to HK$1.99 per
share, including an interim dividend of HK$0.99
per share paid in February and a final
recommended dividend of HK$1.00 per share²
 The company remains committed to returning
capital to shareholders via:
— Recurring bi-annual dividend program at
Sands China Ltd. with a commitment to
grow the recurring dividend each year
1. Excludes the special dividend paid in 2014.
2. The full 2015 dividend of HK$1.99 per share includes the interim dividend of HK$0.99 per share and the proposed final dividend of HK$1.00 per share. The final dividend is subject to the approval of the
SCL shareholders at the SCL Annual General Meeting on June 17, 2015.
3. Includes $4.36 billion in dividends paid to the parent company, Las Vegas Sands Corp.
SCL Remains Committed to Returning Capital to Shareholders While Maintaining a
Strong Balance Sheet and the Financial Flexibility to Pursue Development Opportunities
SCL Total Capital Returned to Shareholders
5.2%
4.7%
4.3%
3.7%
3.3%
2.9%
0.0%
0.5%
1.0%
1.5%
2.0%
2.5%
3.0%
3.5%
4.0%
4.5%
5.0%
5.5%
$50.00 $55.44 $60.00 $70.00 $80.00 $90.00
4.7%
2.2%
0.0%
0.5%
1.0%
1.5%
2.0%
2.5%
3.0%
3.5%
4.0%
4.5%
5.0%
5.5%
LVS S&P500
LVS Generates Greater Forward Dividend Yield
than the S&P500 Index
2015 Forward Dividend
Yield of LVS and S&P5001
1. Reflects the 2015 dividend yield for LVS and the Bloomberg 2015 forward dividend yield estimate for the S&P500 on April 21, 2015.
2. Reflects the 2015 LVS dividend ($2.60) over the closing price for LVS on April 21, 2015.
LVS’s 2015 Dividend Yield of 4.7% Reflects a 250 bps
Premium Above the S&P500 Forward Dividend Yield Estimates
Sensitivity of LVS Dividend Yield
Dividend
Yield as of
4/21/15²
+250 bps
9
Figures as of March 31, 2015 Sands China U.S. Corporate
(US GAAP in $MM) Ltd. Singapore Operations2
and Other Total
Cash, Cash Equivalents and Restricted Cash 1,183.4$ 474.9$ 606.6$ 148.5$ 2,413.4$
Debt 2,774.1$ 3,315.1$ 3,151.8$ -$ 9,241.0$
Net Debt 1,590.7$ 2,840.2$ 2,545.2$ (148.5)$ 6,827.6$
Trailing Twelve Months Adjusted Property EBITDA 2,856.5$ 1,703.3$ 432.2$ 1.2$ 4,993.2$
Gross Debt to Trailing Twelve Months EBITDA 1.0 x 1.9 x 7.3 x NM 1.9 x
Net Debt to Trailing Twelve Months EBITDA 0.6 x 1.7 x 5.9 x NM 1.4 x
At March 31, 2015:
 Trailing Twelve Months Adjusted Property EBITDA – $4.99 billion
 Trailing Twelve Months LVS Dividends Paid – $1.72 billion
 Trailing Twelve Months SCL Dividends Paid – $575.3 million1
 Trailing Twelve Months LVS Stock Repurchases – $854.7 million
 Cash Balance – $2.41 billion
 Net Debt – $6.83 billion
 Net Debt to TTM EBITDA – 1.4x
Strong Cash Flow, Balance Sheet and Liquidity
Flexibility for Future Growth Opportunities and Increasing Return of Capital
10
1. Reflects only the public (non-LVS) portion of dividends paid by Sands China Ltd. Total TTM dividends paid by Sands China Ltd. were $1.92 billion.
2. U.S. Operations includes the cash and debt at the U.S. Restricted Group (plus $62.8 million in airplane and other financings) and adjusted property EBITDA from Las Vegas operations and Sands Bethlehem.
3. The net leverage ratio for covenant compliance purposes, which includes the dividends and royalty fees paid by Sands China Ltd. and Marina Bay Sands to the U.S. Operations, was 0.8x.
4. Does not reflect the $1 billion new term loan at SCL under its existing credit facility. Funding is expected to be on or around April 30, 2015.
Strong Balance Sheet and Cash Flow Maximize Financial Flexibility
3
4
$939.8
$527.7
$864.8
$527.7
34.9%
30.2%
33.8%
30.2%
0%
10%
20%
30%
40%
50%
60%
$0
$100
$200
$300
$400
$500
$600
$700
$800
$900
$1,000
1Q14 1Q15 1Q14 1Q15
Macao Operating Performance
11
($MM)
Macao Property Operations Adjusted Property EBITDA and Adjusted Property EBITDA Margin
Actual Hold-Normalized
-39.0%-43.8%
Mass Tables
53%
Slots 8%
Hotel 12%
Mall 8%
Other 1%
VIP 18%
Mass Tables
52%
Slots 8%
Hotel 14%
Mall 10%
Other 3% VIP 13%
TTM 1Q14
Macao: Diversified and Stable Sources of
Departmental Profit For Las Vegas Sands and Sands China
12
Mass Tables / Slots and Non-Gaming Generated 87% of Macao’s Departmental Profit
in the TTM 1Q15 Period vs. 82% in the TTM 1Q14 Period
Macao Departmental Profit Contribution by Segment
TTM 1Q15
$344
$372
$452
$559
$580
$547
$509
$461
$412
$0
$100
$200
$300
$400
$500
$600
$700
$800
$900
1Q13 2Q13 3Q13 4Q13 1Q14 2Q14 3Q14 4Q14 1Q15
$523
$557
$609
$659
$757
$702 $709
$645
$601
$0
$100
$200
$300
$400
$500
$600
$700
$800
$900
1Q13 2Q13 3Q13 4Q13 1Q14 2Q14 3Q14 4Q14 1Q15
13
SCL Base Mass Table Win by Quarter
Macao: SCL Base Mass Showing Greater Stability
Than Premium Mass in Current Softer Market
Note: LVS base mass and premium mass table revenues as presented above are based on the geographic position of the tables on the gaming floor.
Our Mass Table Offering is the Broadest and the Deepest in the Macao Market
($MM)
SCL Premium Mass Table Win by Quarter
SCL Departmental Profit Margin: 40% - 50% SCL Departmental Profit Margin: 25% - 40%
($MM)
215
Avg.
Tables
248 326729
Avg.
Tables
877 865
Avg. Win per Table per Day: $7,705 Avg. Win per Table per Day: $14,020
Executing Our Mass Strategy in Macao
Expansion of Mass Market
Offerings Underway with The Parisian
Family-friendly Entertainment World Class Concerts, Sporting Events
and Other Entertainment Offerings
Over 1.5 million sq. feet
of World Class Shopping
Market-Leading Customer Database
Highly Themed Tourism Attractions
Portfolio of Nearly
9,300 Suites and Hotel Rooms
Over 2 million sq. feet of Conference,
Exhibition and Carpeted Meeting Space
The Broadest
and Deepest
Mass
Tourism
Offerings
in Macao
Our Diversified Convention-based Integrated Resort Offerings Appeal to the Broadest Set of Customers
and Comprise a Unique Competitive Advantage in the Macao Market 14
Macao Mass Visitation Drivers
Future Growth Drivers
 More efficient and affordable
transportation infrastructure
 Additional tourism attractions in
Macao and Hengqin Island
 Greater number of hotel rooms in
Macao
 Rapidly expanding middle-class
with growing disposable income
15
As a result, Macao’s Mass visitors will:
 Come From Farther
Away
 Stay Longer
 Spend More On:
• Dining
• Lodging
• Retail
• Entertainment
• Gaming
Twelve Months Ended February 28, Population GDP Per Penetration
Province 2014 2015 % Change (MM) Capita (US$) Rate
Guangdong 8,317,884 9,160,041 +10% 104 $9,452 8.8%
Fujian 783,432 916,013 +17% 37 $9,342 2.5%
Hunan 668,484 772,130 +16% 66 $5,936 1.2%
Zhejiang 652,932 697,980 +7% 54 $11,054 1.3%
Hubei 567,318 685,640 +21% 58 $6,881 1.2%
Jiangsu 523,927 583,640 +11% 79 $12,047 0.7%
Shanghai 544,361 543,891 -0.1% 23 $14,547 2.4%
Henan 381,666 518,693 +36% 94 $5,518 0.6%
Guangxi 409,971 518,457 +26% 46 $4,939 1.1%
Jiangxi 376,265 467,015 +24% 45 $5,130 1.0%
Sichuan 379,725 403,849 +6% 80 $5,240 0.5%
Beijing 368,546 378,296 +3% 20 $15,051 1.9%
Hebei 259,681 347,888 +34% 72 $6,251 0.5%
Liaoning 303,854 342,504 +13% 44 $9,961 0.8%
Heilongjiang 251,611 309,565 +23% 38 $6,057 0.8%
Shandong 274,265 309,456 +13% 96 $9,094 0.3%
Chongqing 228,142 264,793 +16% 30 $6,910 0.9%
All Other 3,761,812 4,196,808 +12% 407 N/A 1.0%
Subtotal (Excluding
Guangdong)
10,735,992 12,256,618 +14% 1,288 $6,617 1.0%
Mainland China 19,053,876 21,416,659 +12% 1,392 $6,767 1.5%
16
NOTE: Penetration rates assume that each visitor to Macao from Mainland China is a unique visitor.
Source: Macao DSEC; National Bureau of Statistics of China; LVS Estimates
Year-Over-Year Visitation Growth Mainland Chinese Visitation to Macao
Greater than 20%
Data Not Available-10%- 0%
0% - 10%
10%- 20%
Strong Growth in Mainland Chinese Visitation to Macao
Strongest Growth Realized in Provinces Served by High Speed Rail
Xinjiang
Tibet
Qinghai
Sichuan
Chongqing
Henan
Hubei
Shanxi
Hebei
Shandong
Beijing
Liaoning
Jilin
Heilongjiang
Jiangsu
Anhui
Hunan Jiangxi
Zhejiang
Guangxi
Guizhou
Yunnan
Ningxia
Shaanxi
Inner
Mongolia
Gansu
Guangdong
Fujian
Shanghai
Tianjin
Hong Kong
Macao
Expanding Our Critical Mass on the Cotai Strip
The Parisian Macao
17LVS
Operating
Assets
Third Party
Operating
Asset
Third Party
Future
Development
Construction Progress – April 20, 2015Map of Macao’s Cotai Strip
 The Parisian Macao is a $2.7 billion themed, aspirational
destination Integrated Resort
 Construction continues to progress
 Hotel rooms and suites: 3,000+
 Gaming capacity: ~450 table games and 2,500 slots and ETGs
 Additional amenities including a retail mall, 50% scale replica
Eiffel Tower, MICE space, diverse food & beverage options and
entertainment
 The Parisian Macao will be interconnected to our other Cotai Strip
properties through mall access and other pedestrian connectivity
including a walkover bridge from Sands Cotai Central
Rendering of The Parisian Macao
LVS Future
Development
Expanding Our Critical Mass on the Cotai Strip
The St. Regis Tower at Sands Cotai Central
18
Construction Progress – April 20, 2015Map of Macao’s Cotai Strip
 St. Regis branded 5-star hotel and serviced apartments
to complement the existing portfolio of brands on the
Cotai Strip
 Construction continues to progress
 Hotel rooms and suites: ~400
 Serviced Apartments: ~300
Rendering of The St. Regis Tower
LVS
Operating
Assets
Third Party
Operating
Asset
Third Party
Future
Development
LVS Future
Development
28%
32%
35%
0%
10%
20%
30%
40%
2012 2013 2014
Macao Market Annual EBITDA
Market Share by Operator
SCL Expanded Market Share of Macao EBITDA by 700 bps Over the Last Two Years
Source: Company Reports
1. Reflects reported adjusted property EBITDA for operating properties for the twelve months ended December 31.
2. Galaxy only includes EBITDA from Starworld and Galaxy Macau.
Historical EBITDA Market Share1,2
19
Galaxy MPELSCL
2
SJM Wynn MGM
SCL Macao Property Operations All Others
18% 18% 18%
14% 15% 14%
14% 12% 11%
16% 14%
13%
10%
9%
9%
0%
20%
40%
60%
80%
2012 2013 2014
Macao
Leader in
Market Share
of EBITDA
72%
68% 65%
$9,199
$9,421$354 -$131
$0
$1,000
$2,000
$3,000
$4,000
$5,000
$6,000
$7,000
$8,000
$9,000
$10,000
$11,000
2013
EBITDA
SCL
EBITDA
Growth
All Others
EBITDA
Growth
2014
EBITDA¹
$3,261
$1,720
$1,287 $1,258
$1,002
$894
$0
$500
$1,000
$1,500
$2,000
$2,500
$3,000
$3,500
LVS Galaxy² MPEL Wynn
Macau
SJM MGM
China
LVS Outperforming the Macao Market in
EBITDA Generation and Growth
LVS Had 35% Market Share of EBITDA in 2014 and
Generated $354 million of Incremental EBITDA Y/Y
Source: Company Reports
1. Reflects adjusted property EBITDA for operating properties based on US GAAP for the twelve months ended December 31, 2014.
2. Galaxy only includes revenue and EBITDA from Starworld and Galaxy Macau.
EBITDA
Margin
6% -7% -5% -11% 5%
2014 Macao Market EBITDA1
EBITDA
TTM
Growth
28% 27% 33% 17% 27%
($MM)
2014 Macao Market EBITDA Growth¹
($MM)
12%
34%
18% 14% 13% 11% 9%
Macao
Market
EBITDA
Share (%)
35%
20
$3.01 $3.11
$1.64 $1.59
$4.65 $4.70
$0.0
$2.0
$4.0
$6.0
1Q14 1Q15
Non-Rolling Tables Slot Machines
$435.2 $415.3
$377.9 $371.3
52.1% 52.9%
49.5% 50.9%
20%
30%
40%
50%
60%
70%
80%
$0
$100
$200
$300
$400
$500
$600
1Q14 1Q15 1Q14 1Q15
Marina Bay Sands Operations
Strong Retail and Mass Gaming Performance¹
21
Actual
 Adjusted property EBITDA of $415.3 million, a decrease of 4.6%
(Adjusted Property EBITDA increased 0.2% on a constant-currency
basis)
— Hold-normalized adjusted property EBITDA of $371.3 million,
a decrease of 1.7%
 Total mass (non-rolling tables and slots) win per day increased
1.1% to reach $4.70 million (+5.9% on a constant-currency basis)
— Total mass win was a property record in Singapore dollars
— Non-Rolling win increased 3.3% to $280.0 million
— Slot win decreased 3.4% to $142.7 million
 Room revenue decreased 7.7% as RevPAR decreased 7.5% to $393
and ADR decreased 3.3% to $414
 Retail mall revenue increased 3.4% to $39.8 million
 Rolling win decreased 22.2% to $343.7 million (rolling volume
decreased 22.0% to $10.09 billion)
($MM)
($MM)
Adjusted Property EBITDA
and Adjusted Property EBITDA Margin
Continued Growth in Mass Table and Retail Businesses Despite Headwind from Stronger US$
Non-Rolling Table and Slot Win Per Day
Hold-Normalized
1. Due to a strengthened USD in 1Q15 compared to 1Q14, MBS faced a currency headwind of approximately 4.7 percentage points in 1Q15 compared to 1Q14
VIP
11%
Mass Tables
38%
Slots
21%
Hotel
18%
Mall
8%
Other
4%
VIP
15%
Mass Tables
37%
Slots
19%
Hotel
18%
Mall
7%
Other
4%
TTM 1Q14¹
Singapore: Diversified and Stable Sources of
Departmental Profit For Las Vegas Sands
22
Mass Tables / Slots and Non-Gaming Generated
89% of Singapore’s Hold-Normalized Departmental Profit in TTM 1Q15
Singapore Hold-Normalized Departmental Profit Contribution by Segment
TTM 1Q15¹
1. In TTM 1Q15, VIP hold was 3.29% compared to 2.67% in TTM 1Q14. On a non hold-normalized basis, VIP contribution would have been 12% in TTM 1Q14 and 17% in TTM 1Q15.
$177 $182 $188 $192 $198
$126 $125 $129 $132 $139
$43 $45
$52 $57
$61
$156 $160
$167
$169
$171
$502 $512
$536 $551
$569
$0
$100
$200
$300
$400
$500
$600
1Q14 2Q14 3Q14 4Q14 1Q15
Venetian Macao Four Seasons Macao Sands Cotai Central¹ Marina Bay Sands
Asia Retail Mall Portfolio Continues to Generate
Strong Growth in Revenue and Operating Profit
23
($MM)
Trailing Twelve Months Retail Mall Revenue
88%86% 86% 86%
Operating
Profit Margin
88%
1. At March 31, 2015, 324,408 square feet of gross leasable area were occupied out of a total of up to 600,000 square feet of retail mall space that will be featured at completion of all phases of
Sands Cotai Central.
2. Tenant sales per square foot is the sum of reported comparable sales for the trailing 12-months divided by the comparable square footage for the same period. Only tenants that have
occupied mall space for a minimum of 12 months are included in the tenant sales per square foot calculation.
$503M$430M $442M $463M
Operating
Profit
$482M
TTM 1Q15 Sales
per Sq. Foot²
MBS:
$1,409
SCC:
$1,407
Four Seasons:
$5,246
Venetian:
$1,636
$67.7 $69.6
$77.9 $80.9 $85.7
$8.4
$26.8
$46.9
$69.9
$78.0
$104.7
$127.8
$87.4
$-
$20
$40
$60
$80
$100
$120
$140
$160
1Q14 2Q14 3Q14 4Q14 1Q15
Base Rent and Other Fees Turnover Rent
Macao Quarterly Retail Revenue Composition
24
Strong Growth In Macao Retail Mall Revenue
($MM)
Strong Retail Revenue Growth Across Macao Property Portfolio
$2.2
$1.6
South Korea
Promising Areas of Future Development Interest for Las Vegas Sands
Japan
 As the global leader in Integrated Resort development and operation, Las Vegas Sands is uniquely positioned to
bring its unmatched track record and powerful convention-based business model to the world’s most promising
Integrated Resort development opportunities
 Development opportunity parameters:
— Targeting minimum of 20% return on total invested capital
— 25% - 35% of total project costs to be funded with equity (project financing to fund 65% - 75% of total project
costs)
Disciplined Execution of Our Global Growth Strategy
25
Macao
The Parisian Macao
St. Regis Tower at
Sands Cotai Central
Vietnam
Appendix
$ in millions 1Q14 2Q14 3Q14 4Q14 1Q15
Macao Property Operations
Reported 939.8$ 801.3$ 809.0$ 711.2$ 527.7$
Hold-Normalized 864.8$ 752.5$ 772.1$ 686.2$ 527.7$
Marina Bay Sands
Reported 435.2$ 417.8$ 351.7$ 518.5$ 415.3$
Hold-Normalized 377.9$ 368.5$ 366.5$ 461.0$ 371.3$
Las Vegas Operations
Reported 79.7$ 66.1$ 90.2$ 78.0$ 74.1$
Hold-Normalized 97.3$ 70.4$ 83.6$ 87.6$ 89.2$
Sands Bethlehem
Reported 26.5$ 27.9$ 29.8$ 36.2$ 29.9$
Hold-Normalized 26.5$ 27.9$ 29.8$ 36.2$ 29.9$
LVS Consolidated2
Reported 1,479.7$ 1,312.6$ 1,283.9$ 1,346.1$ 1,050.5$
Hold-Normalized 1,365.2$ 1,218.8$ 1,255.1$ 1,273.3$ 1,021.6$
Historical Hold-Normalized Adj. Property EBITDA1
28
1. This schedule presents hold-normalized adjusted property EBITDA based on the following methodology:
(a) for Macao operations and Marina Bay Sands: if the quarter’s rolling win percentage is outside of the 2.70%-3.00% band, then a hold-adjustment is calculated by applying a rolling win percentage of 2.85% to the rolling table
volume for the quarter.
(b) for Las Vegas operations: starting with 1Q15, if the quarter’s Baccarat win percentage is outside of the 21.0%-29.0% band, then a hold-adjustment is calculated by applying a Baccarat win percentage of 25.0%, and if the
quarter’s non-Baccarat win percentage is outside of the 16.0%-20.0% band, then a hold-adjustment is calculated by applying a non-Baccarat win percentage of 18.0%. Our expected Baccarat win percentage in the prior quarters
was 22.0% to 30.0% (26.0% normalized) and our expected non-Baccarat win percentage in prior quarters was 14.0% to 18.0% (16.0% normalized).
(c) for Sands Bethlehem: no hold-adjustment is made.
(d) for all properties: gaming taxes, commissions paid to third parties on incremental win, bad debt expense, discounts and other incentives are applied to determine the EBITDA impact.
2. Reflects consolidated adjusted property EBITDA inclusive of Other Asia (principally CotaiJet operations) segment.
$1,086
$2,229
$3,532
$3,791
$4,763
$5,422
$4,993
$0
$1,000
$2,000
$3,000
$4,000
$5,000
$6,000
2009 2010¹ 2011 2012² 2013 2014 TTM
1Q15
$4,563
$6,853
$9,411
$11,131
$13,770
$14,584
$13,585
$0
$2,000
$4,000
$6,000
$8,000
$10,000
$12,000
$14,000
$16,000
2009 2010¹ 2011 2012² 2013 2014 TTM
1Q15
LVS Historical Net Revenue
($MM)
Strong Historical Revenue and EBITDA Growth
Over the Last Five Years
LVS Historical Adjusted Property EBITDA
($MM)
Margin 23.8% 32.5% 34.1%37.5% 34.6%
1. Marina Bay Sands opened in April 2010.
2. Sands Cotai Central opened in April 2012.
The Strength and Consistency of our Convention-Based Integrated
Resort Business Model is Reflected in our Financial Results
37.2%
29
36.8%
$0.07
$0.98
$2.02
$2.14
$2.90
$3.58
$3.27
$0.00
$0.50
$1.00
$1.50
$2.00
$2.50
$3.00
$3.50
$4.00
$4.50
2009 2010¹ 2011 2012² 2013 2014 TTM
1Q15
$48
$775
$1,644
$1,768
$2,399
$2,894
$2,631
$0
$500
$1,000
$1,500
$2,000
$2,500
$3,000
$3,500
2009 2010¹ 2011 2012² 2013 2014 TTM
1Q15
LVS Historical Adjusted Net Income
Strong Historical Adjusted Net Income and
Adjusted EPS Growth Over the Last Five Years
LVS Historical Adjusted Diluted Earnings per Share
($MM)
Diluted
Shares
Outstanding
728M 792M 825M812M 826M
1. Marina Bay Sands opened in April 2010.
2. Sands Cotai Central opened in April 2012.
3. Reflects the simple average of the diluted shares outstanding for the four component quarters.
The Strength and Consistency of our Convention-Based Integrated
Resort Business Model is Reflected in our Financial Results
808M
30
804M³
$472 $447 $445 $500 $500 $500
$125
$830
$192 $75
$100
$210 $390
$825
$960
$200
$190
$475
$100
$107
$1,449
$898
$1,179
$2,025
$1,560
$700
$0
$500
$1,000
$1,500
$2,000
$2,500
$3,000
2012A 2013A 2014A 2015E 2016E 2017E
Maintenance Investments in Current Properties¹ Sands Cotai Central The Parisian Macao² St. Regis at SCC Other
Capital Expenditures Expectations
Future Investments Include The Parisian Macao, St. Regis at SCC and Maintenance
Future Capital Expenditures Focused on Growth in Asia
($MM)
1. Reflects investments that will generate future income in our current property portfolio (including the Four Seasons Apart-Hotel and a third gaming area at Sands Cotai Central).
2. The timing of capex is subject to the receipt of timely government approvals.
Sands Cotai Central
The Parisian Macao2
St. Regis at Sands Cotai Central
LVS Capex Expectations
Development Timeline Pre-Opening
Post-Opening
31
$40
$49
$60
$19
180 418
979 1,192218
1,105
1,808
883
2,115
$73 $97
$327
$1,520
$2,118
$5,115
$0
$1,000
$2,000
$3,000
$4,000
$5,000
$6,000
2015 2016 2017 2018 2019 2020
SCL MBS USRG LVSC
Debt Maturity Profile
Debt Maturity by Year at March 31, 2015 ¹
Long Term and Low Cost Financing in Place
($MM)
1% 1% 16%% of Total 4% 23% 55%
321. Does not reflect the $1 billion new term loan at SCL under its existing credit facility. Funding is expected to be on or around April 30, 2015. On a proforma basis reflecting the loan, $1,595 million
would be due in 2018, $2,293 million would be due in 2019, $5,525 million would be due in 2020 and $340 million would be due in 2021.
$70
$208
$285
$361
$510 $561
$656
$780
$822 $896
$1,045$1,087$1,059$1,120$1,016$1,068$1,028 $984 $1,001$1,011
0.0% 8.4% 9.6%
12.9% 11.3%
14.6%
18.2% 19.8%
23.4%
26.8% 26.7% 27.8%
30.3% 32.0%
37.2% 37.5%
40.9% 41.9% 40.0%
37.6%
0.0%
10.0%
20.0%
30.0%
40.0%
50.0%
$0
$300
$600
$900
$1,200
2Q10 3Q10 4Q10 1Q11 2Q11 3Q11 4Q11 1Q12 2Q12 3Q12 4Q12 1Q13 2Q13 3Q13 4Q13 1Q14 2Q14 3Q14 4Q14 1Q15
Gross Casino A/R Balance at End of Period Reserve Against Casino A/R Balance
$40
$146
$203
$250 $271
$345
$314
$418
$311 $317
$378 $368
$408
$342
$403
$326
$361
$281 $272 $291
$0
$75
$150
$225
$300
$375
$450
2Q10 3Q10 4Q10 1Q11 2Q11 3Q11 4Q11 1Q12 2Q12 3Q12 4Q12 1Q13 2Q13 3Q13 4Q13 1Q14 2Q14 3Q14 4Q14 1Q15
MBS – Credit Collections Remain Healthy
Reserve Balance Of $380 Million Represents 37.6% of Gross A/R
33
($MM)
Reserve Balance Of $380 Million Represents 37.6% of Gross Accounts Receivable
Casino Credit Collections Remain Stable
$0
Quarterly
Provision
$17M $24M $37M $32M $40M $40M$11M$19M$10M
Life to Date Provision of $572 Million Represents 9.6% of Rolling Win Since Opening of Property
$38M $39M $37M $39M $36M $36M $33M $30M $30M $24M
$293 $281
$225 $252
$519 $533
$0
$100
$200
$300
$400
$500
$600
$700
1Q14 1Q15
Baccarat Non-Baccarat
$79.7
$74.1
$97.3
$89.2
20.8% 19.7%
24.1% 22.6%
0%
10%
20%
30%
40%
$0
$20
$40
$60
$80
$100
$120
1Q14 1Q15 1Q14 1Q15
Las Vegas Operations
34
Composition of Table Games Drop
 Adjusted property EBITDA was $74.1 million, a
decrease of 7.0%
— On a hold-normalized basis, adjusted property
EBITDA was $89.2 million, a decrease of 8.4%
 ADR increased 1.2% to $244 with 86.2% occupancy,
RevPAR decreased 1.9% to $210
 Table games drop increased 2.8% to $533.1 million
driven by a 12.0% increase in non-Baccarat drop
 Slot win increased 8.5% to $44.1 million
Best opportunities for future growth:
— High-end Asian gaming growth
— Increase in group room pricing in 2015
— Non-gaming amenities
($MM)
Adjusted Property EBITDA
and Adjusted Property EBITDA Margin
Best Opportunity for Future Growth in Group Room Business and Baccarat
Actual
($MM)
Hold-Normalized
$116 $125
$132 $139
$248 $263
$0
$100
$200
$300
1Q14 1Q15
Baccarat Non-Baccarat
$26.5
$29.9
22.6% 23.4%
0%
10%
20%
30%
40%
$0
$5
$10
$15
$20
$25
$30
$35
1Q14 1Q15
Sands Bethlehem Operations
Record Quarter for Leading Tri-State Region Property
35
 Adjusted property EBITDA increased 12.8% to a first
quarter record $29.9 million
 Table games drop increased 6.4% to reach $263.4 million,
driven by a 7.8% increase in Baccarat drop
 Slot handle increased 6.0% to $1.01 billion
 ADR increased 2.1% to $149 with occupancy of 84.5%,
RevPAR increased 24.8% to $126
 The Outlets at Sands Bethlehem (130,000 SF) feature 29
stores including Coach, Tommy Hilfiger, DKNY, GUESS,
European Body Concepts Day Spa and Joli French Bakery
and Cafe
 The Sands Bethlehem Event Center (50,000 SF)
— Headline events have included Tiesto, Yes, Willie
Nelson, The Beach Boys, Incubus, Bellator MMA,
Glenn Frey, Crosby, Stills and Nash, NBC Fight Night,
Diana Krall and Bill Maher
($MM)
($MM)
Adjusted Property EBITDA
and Adjusted Property EBITDA Margin
Composition of Table Games Drop
Macao Market Background
and Infrastructure Slides
$16,146
$23,181
$39,327
$0
$5,000
$10,000
$15,000
$20,000
$25,000
$30,000
$35,000
$40,000
$45,000
Gross Gaming Revenue
Mass Tables and Slots VIP Gaming
41%
74%
59%
26%
0%
20%
40%
60%
80%
100%
Gross Gaming Revenue Operating Profit
Mass Tables and Slots VIP Gaming
TTM 1Q15 Macao Market
Gross Gaming Revenue
VIP Gaming Represents 59% of Total Macao GGR…
…but Mass Tables and Slots Generate ~74% of Gaming Operating Profit
($MM)
Composition of Macao Market Gross Gaming
Revenue and Est. Gaming Operating Profit2
Source: Macao DICJ
1. In the first quarter of 2015, the mass table segment decreased 27.1% and the slot business decreased 26.3% compared to the first quarter of 2014.
2. This presentation reflects an assumed operating profit margin of 10.0% on gross VIP revenue and a blended margin of 40% on mass table and slot gross revenue.
Mass Gaming Generates 41% of the Gaming Revenue, but ~74% of the Gaming Operating Profit
37
1Q15 YoY
Growth
-37%
-42%
-27%1
~1.8X
$3,580
$4,670
$6,123
$6,960
$6,459
$2,446
$2,637
$2,985
$2,661
$2,318
$6,026
$7,307
$9,108
$9,621
$8,777
$0
$2,000
$4,000
$6,000
$8,000
$10,000
$12,000
2011 2012 2013 2014 TTM 1Q15
Mass Tables, Slots and ETGs VIP Tables
Macao Market VIP and Mass Gaming Estimated Operating Profit 1,2
The Mass Business Remains the Principal Profit Pool
and the Primary Driver of Earnings Growth in Macao
($MM)
Source: Macao DICJ
1. This presentation reflects an assumed operating profit margin of 10.0% on gross VIP revenue and a blended margin of 40% on mass table and slot gross revenue.
2. The percentages presented in parentheses represent the % of total operating profit for the period.
The Mass Business is the Primary Driver of Gaming Profit in Macao
38
(59%)
(64%)
(67%)
(72%)(41%)
(36%)
(33%)
(28%)
(XX%) = % of total
operating profit for period
(74%)
(26%)
$2,084 $2,409
$3,355
$4,358
$4,952
$6,587
$8,949
$11,674
$15,309
$17,400
$16,146
$4,648
$3,394
16%
39%
30%
14%
33%
36%
30%
31%
14%
-2%
-10%
0%
10%
20%
30%
40%
50%
60%
$0
$2,000
$4,000
$6,000
$8,000
$10,000
$12,000
$14,000
$16,000
$18,000
$20,000
2005 2006 2007 2008 2009 2010 2011 2012 2013 2014 TTM
1Q15
1Q14 1Q15¹
Mass Table and Slot GGR Year-over-Year Growth
Macao Base Mass Business Remains More Resilient
Than Premium Mass in the Current Challenging Environment
39
Macao Mass Table and Slot Gross Gaming Revenue
($MM)
Source: Macao DICJ
1. In the first quarter of 2015, the mass table segment decreased -27.1% and the slot business decreased -26.3% compared to the first quarter of 2014.
Strong Historical Growth in Mass, Recent Headwinds Especially at the High-End of the Mass Segment
Five Trends that Should Contribute To Growth
in the Macao Market In The Future
1
2
3
4
5
200 million Chinese are expected to travel outside of China by
2020, compared to 83 million in 2012 and 97 million in 2013
Infrastructure and transportation connectivity throughout
China, especially in the Pearl River Delta region, will be
meaningfully expanded
Increasing length of stay in Macao
Hengqin Island will contribute to Macao’s diversification and to
its further development as a business and leisure tourism
destination
Over 12,000 new hotel rooms will open in Macao by 2018
Sources: McKinsey, Ernst & Young, CLSA
40
0%
5%
10%
15%
20%
25%
30%
35%
40%
45%
50%
'56 '60 '64 '68 '72 '76 '80 '84 '88 '92 '96 '00 '04 '08 '12
$4
$8 $11
$14
$15
$22
$30
$44
$55
$70
$102
$120
5
5 9 12
20
31
41
48
57
73
83
97
108
119
132
147
163
180
200
$138
$157
$179
$205
$234
$268
$306
0
50
100
150
200
250
300
350
'95 '97 '99 '01 '03 '05 '07 '09 '11 '13 '15 '17 '19
Outbound Travel from China
China Is The World’s Largest and Fastest
Growing Outbound Tourism Market
41
Outbound Travel Penetration¹
Wealth Generation and Increased Mobility in China Have Driven Strong Growth in Outbound Trips and Tourism Spend,
And Comparative Outbound Travel Penetration Rates Show a Meaningful Opportunity for Continued Long-Term Growth
Expenditure (US$bn)
Chinese outbound
tourists (millions)
CLSA estimates
Source: CLSA, UNWTO
1. Outbound travel penetration is defined as total departures by residents as a percentage of the respective country’s population.
1
China
Japan
Taiwan
Korea
2009-2013 2012-2020
Expenditure 27.2% 14.3%
Tourists 16.1% 10.9%
CAGR
44.5%
27.5%
14.5%
6.1%
$1.1 $1.2 $1.2 $1.3 $1.4
$2.3 $2.5
$4.0
$10.0
$12.8
$-
$5
$10
$15
France Brazil Mexico Germany Russia Japan Indonesia USA China India
Chinese Middle Class Consumption Growth
Chinese Middle Class Consumption in 2030 is Projected to Reach $10.0 trillion
42
Global Middle Class Consumption in 2030 (US$ trillion)
NOTE: Brookings Institution defines the global middle class as those households with daily expenditures between $10 and $100 per person in purchasing power parity terms.
Source: Brookings Institution; UN; World Bank; Financial Times.
Continued Growth of the Chinese Middle Class Will Drive Macao Mass Tourism Opportunity
1
(US$ trillion)
Twelve Months Ended February 28, Population GDP Per Penetration
Province 2014 2015 % Change (MM) Capita (US$) Rate
Guangdong 8,317,884 9,160,041 +10% 104 $9,452 8.8%
Fujian 783,432 916,013 +17% 37 $9,342 2.5%
Hunan 668,484 772,130 +16% 66 $5,936 1.2%
Zhejiang 652,932 697,980 +7% 54 $11,054 1.3%
Hubei 567,318 685,640 +21% 58 $6,881 1.2%
Jiangsu 523,927 583,640 +11% 79 $12,047 0.7%
Shanghai 544,361 543,891 -0.1% 23 $14,547 2.4%
Henan 381,666 518,693 +36% 94 $5,518 0.6%
Guangxi 409,971 518,457 +26% 46 $4,939 1.1%
Jiangxi 376,265 467,015 +24% 45 $5,130 1.0%
Sichuan 379,725 403,849 +6% 80 $5,240 0.5%
Beijing 368,546 378,296 +3% 20 $15,051 1.9%
Hebei 259,681 347,888 +34% 72 $6,251 0.5%
Liaoning 303,854 342,504 +13% 44 $9,961 0.8%
Heilongjiang 251,611 309,565 +23% 38 $6,057 0.8%
Shandong 274,265 309,456 +13% 96 $9,094 0.3%
Chongqing 228,142 264,793 +16% 30 $6,910 0.9%
All Other 3,761,812 4,196,808 +12% 407 N/A 1.0%
Subtotal (Excluding
Guangdong)
10,735,992 12,256,618 +14% 1,288 $6,617 1.0%
Mainland China 19,053,876 21,416,659 +12% 1,392 $6,767 1.5%
43
NOTE: Penetration rates assume that each visitor to Macao from Mainland China is a unique visitor.
Source: Macao DSEC; National Bureau of Statistics of China; LVS Estimates
Year-Over-Year Visitation Growth Mainland Chinese Visitation to Macao
Greater than 20%
Data Not Available-10%- 0%
0% - 10%
10%- 20%
Xinjiang
Tibet
Qinghai
Sichuan
Chongqing
Henan
Hubei
Shanxi
Hebei
Shandong
Beijing
Liaoning
Jilin
Heilongjiang
Jiangsu
Anhui
Hunan Jiangxi
Zhejiang
Guangxi
Guizhou
Yunnan
Ningxia
Shaanxi
Inner
Mongolia
Gansu
Guangdong
Fujian
Shanghai
Tianjin
Hong Kong
Macao
Strong Growth in Mainland Chinese Visitation to Macao
Strongest Growth Realized in Provinces Served by High Speed Rail
1
Infrastructure: China’s High-Speed Rail
Connecting More of Mainland China to Macao
Source: SCMP, LVS, NYT
44
2
China’s Ministry of Railways Plans to Spend Greater than US$100 billion per Year on Rail Development
for the Foreseeable Future, and Highlighted Rail Development in the February 2014 Stimulus Plan
Beijing – Guangzhou High-Speed Rail
 World’s longest high-speed rail route
 Covers 2,298km in ~10 hours (compared
to 22 hours previously) at a cost of 862
yuan (~US$140) per one way ticket
 Provides seamless connection from
Northern China to the Macao border via
the Guangzhou-Zhuhai Intercity Rail
 5 trains in each direction each day
Guangzhou – Zhuhai Intercity Rail
 Rail line connecting Guangzhou to
Zhuhai, where the Gongbei border
gate to Macao is located
 Guangzhou is the largest city in
Guangdong province and is a key
economic and transportation hub
 Reduces travel time from
Guangzhou to Zhuhai from 2+
hours by bus to as short as 60
minutes
 Zhuhai station opened in Jan 2013
 Future link to Macao Light Rail
System
 40-45 trains in each direction each
day
Wuhan – Guangzhou High-Speed Rail
 Wuhan is the capital of Hubei Province and one
of the most populous cities in Central China
with ~10 million people
 Wuhan is an important economic and
transportation hub in Central China
 HSR reduces travel time to Guangzhou from 11
hours by bus to 3.5 hours by train
 One of the most successful routes with 75-85
trains in each direction each day
Hong Kong
Macao
Infrastructure: Meaningful Improvements
Throughout the Pearl River Delta Region
Source: World Bank, China Daily, Chinatrainguide.com, Analyst reports. Note: population and GDP data from 2013.
45
Guangzhou
Population: 13M
GDP Per Capita: US$14,000
Macao
Population: 0.6M
GDP Per Capita: US$91,300
Hengqin Island
• Special economic area
• Over $20B of overall investment
• Over 10,000 hotel rooms
• First phase of Chimelong theme park opened in
Jan. 2014 and expected to attract 20M visitors
annually at completion of all phases
Hong Kong
Population: 7.2M
GDP Per Capita: US$38,000
Hong Kong-Macao-Zhuhai Bridge
(expected completion TBD)
Wuhan – Guangzhou High-Speed Rail
• 3.5 hour train ride
• 75-80 trains in each direction per day
Shenzhen
Population: 10M
GDP Per Capita: US$22,000China Border Gate Expansion
• Daily capacity increased from 150,000 to
350,000 people in 2H13
• Reduced average wait times on China side of
border
Guangzhou – Zhuhai Intercity Rail
• 70 - 90 minute train ride (2+ hours by bus)
• 25 - 35 trains in each direction per day
• Final link to Gongbei border gate completed in
January 2013
Guangzhou – Shenzhen – Hong Kong Rail
• 2 hour train ride from Guangzhou to Hong Kong
• 25 trains in each direction per day
Infrastructure Legend
Existing
Future
Gongbei – Hengqin Railway
• Connects the Gongbei border crossing with
Hengqin Island
• Stops at Lotus Bridge crossing and ends at
Chimelong theme park
• Expected completion 2017
2
5.2
6.3
7.3
8.1
8.9
9.7
0.0
2.0
4.0
6.0
8.0
10.0
12.0
2009 2010 2011 2012 2013 2014
5.8
6.9
8.8 8.8
9.7
11.5
0.0
2.0
4.0
6.0
8.0
10.0
12.0
14.0
2009 2010 2011 2012 2013 2014
Mainland China Day-Trip Visitors to Macao Mainland China Overnight Visitors to Macao
Chinese Day-Trip and Overnight Visitation To
Macao Both Continue to Grow
(MM)
Source: Macao DSEC
46
-9% +19% +28% 0%
(MM)
Growth -1% +22% +16% +10%Growth
Chinese Visitation Continues to Grow and Additional Hotel Capacity and
Transportation Infrastructure will Enhance Overnight Visitation Growth to Macao in the Future
+10% +10%
3
+19% +9%
11.0
13.2
16.2 16.9
18.6
21.3
18.0
22.7
28.1
34.9
40.7
47.2
0.0
5.0
10.0
15.0
20.0
25.0
30.0
35.0
40.0
45.0
50.0
Mainland China Visitation to Macao and Hong Kong
Visitation to Macao Can Meaningfully Grow
47.2 Million Residents of Mainland China Visited Hong Kong in 2014
(MM)
Source: Macao DSEC; Hong Kong Tourism Board
47
-5% +20% +22% +5%Macao
+6%Hong Kong +26% +24% +24%
Robust Transportation Infrastructure, 74,000 Hotel Rooms and World-Class Dining and Shopping
Amenities Enabled 47.2 Million Mainland Chinese Visitors to Travel to Hong Kong in 2014
In 2014 Hong
Kong Received
25.9M More
Visitors from
China than Macao
2009 2010 2011 2012 2013
+10%
+17%
3
Macao Hong Kong
2014
+14%
+16%
19.5
64.9
0.0
10.0
20.0
30.0
40.0
50.0
60.0
70.0
2.0
3.4
0.0
0.5
1.0
1.5
2.0
2.5
3.0
3.5
4.0
(Days)
Total 2014 Mainland
Chinese Visitor Nights¹
(MM)(MM)
Daytrip Visitors
Opportunity for Increased Overnight Visitation
and Length of Stay In Macao
48
1. Calculated as total overnight visitors from Mainland China multiplied by average length of stay for Mainland overnight visitors in each market for 2014. Hong Kong has
not yet released their 2014 average length of stay figure, so the 3.4 average length of stay presented reflects the 2013 figure.
Source: Macao DSEC, Hong Kong Tourism Board
Composition of 2014
Visitation from Mainland China
Mainland Visitors Spent 64.9 Million Visitor Nights in Hong Kong in 2014
Compared to Just 19.5 Million Visitor Nights Spent in Macao
Overnight Visitors
Avg. Length of Stay for
Mainland Chinese
Overnight Visitors in 2014
Macao Hong Kong
3
11.5
9.7
28.2
19.1
0.0
5.0
10.0
15.0
20.0
25.0
30.0
Hengqin Island Expands Critical Mass of
Tourism Offerings for Visitors to the Region
49
Map of Hengqin Island New Area Important Facts
 Island adjacent to Macao (3X the size of Macao) that has been
welcomed by President Xi Jinping as a strategic zone for
cooperation among Guangdong Province, Hong Kong and
Macao
 Master-planned island with greater than US$20 billion of
investment focused on tourism development, industrial and
technological innovation and education
 One of three current “New Area” reform zones in China
— Support from the Central Government to enable long
term success
— Empowerment to have broad flexibility on economic and
legal matters
 Designed to contribute to the diversification of Macao
— US$3.2 billion Chimelong International Ocean Resort
opened January 28, 2014 and is expected to generate 20
million visits in the future after completion of all phases¹
— Hengqin’s central business district will feature a 1.2
million square foot convention center
— More than 10,000 hotel rooms expected to open over the
next five years
Source: Macau Daily, Zhuhai Daily, Chimelong Group, Hengqin New Area Administrative Committee
1. Phase 1 currently includes the Hengqin Bay Hotel, the Ocean Kingdom theme park, the Circus World show and a waterpark in the Hengqin Bay Hotel. The theme park received over
8 million visitors in 2014, with over 500,000 visitors during the 2014 Chinese New Year holiday.
4
SandsCotai
Central
5,723
The
VenetianMacao
2,905
Sands Macao,289
GalaxyMacau
2,250
Grand Waldo,550
Starworld,509
Cityof Dreams
1,461
AltiraMacau, 216
WynnMacau
1,014 Grand Lisboa,431
Sofitel Macau,408
MGM Grand,587
9,277
3,309
1,677
1,014 839
587
0
1,000
2,000
3,000
4,000
5,000
6,000
7,000
8,000
9,000
10,000
Sands China Galaxy Entertainment Melco Crown Wynn Resorts SJM Holdings² MGM China
Hotel % of Gaming % of Total
Gaming Operator Rooms Operators Market
Sands China 9,277 56% 38%
Galaxy Entertainment 3,309 20% 14%
Melco Crown 1,677 10% 7%
Wynn Resorts 1,014 6% 4%
SJMHoldings² 839 5% 4%
MGMChina 587 4% 2%
Subtotal Gaming Operators 16,703 100% 68%
Other 4/5 Star 7,537 0% 32%
Total 24,240 100% 100%
Market Leading Hotel Capacity at SCL
Sands China Operates 38% of Macao’s Current 4/5-Star Hotel Inventory
1. In addition to the hotel rooms that are owned by gaming operators presented here, there are 7,537 additional four- and five-star hotel rooms in Macao.
2. Reflects only SJM Holdings self-owned hotels.
Source: Company filings, Macao DSEC
50
With a Market-Leading US$9 billion of Investment,
SCL Hotel Inventory Represents 56% of Macao Competitor Hotel Inventory
Macao Market Gaming Operator Hotel Rooms1
Four Seasons
Macao, 360
5
`
SandsCotai
Central
5,723
The
VenetianMacao
2,905
Sands Macao,289
The Parisian
Macao
3,000
GalaxyMacau
2,250
Grand Waldo, 550
Starworld,509
GalaxyMacau Phase II
1,350
Cityof Dreams
1,461
AltiraMacau, 216
Macau StudioCity
1,600
Grand Lisboa, 431
Sofitel Macau, 408
SJMCotai
2,000
WynnMacau, 1,014
WynnCotai
1,700
MGM Grand,587
MGM Cotai
1,600
12,677
4,659
3,277 2,839 2,714
2,187
0
2,000
4,000
6,000
8,000
10,000
12,000
14,000
Sands China Galaxy Entertainment Melco Crown SJM Holdings² Wynn Resorts MGM China
Hotel % of Gaming % of Total
Gaming Operator Rooms Operators Market
Sands China 12,677 45% 35%
Galaxy Entertainment 4,659 16% 13%
Melco Crown 3,277 12% 9%
SJMHoldings² 2,839 10% 8%
Wynn Resorts 2,714 10% 8%
MGMChina 2,187 8% 6%
Subtotal Gaming Operators 28,353 100% 78%
Other 4/5 Star 7,773 0% 22%
Total 36,126 100% 100%
1. In addition to the hotel rooms that are owned by gaming operators presented here, there will be approximately 7,773 additional four- and five-star hotel rooms in Macao.
2. Reflects only SJM Holdings self-owned hotels.
Source: Company filings, Macao DSEC
51
Macao Market Gaming Operator Hotel Rooms at December 31, 20171
Four Seasons
Macao, 360
St. Regis Macao, 400
5
`
With a Market-Leading US$13 billion of Investment,
SCL Hotel Inventory Will Represent 45% of Macao Competitor Hotel Inventory
Market Leading Hotel Capacity at SCL
Projected Macao Market 4/5 Star Hotel Rooms at December 31, 2017
Supplemental Sands China Information
$7.8
$5.3
$1.3
$14.4
$2.5
$16.9
$5.8
$4.4
$0.7
$10.8
$2.0
$12.8
$0.0
$5.0
$10.0
$15.0
$20.0
Venetian
Macao
Sands Cotai
Central
Plaza Casino
(Four Seasons)
Total
Cotai Strip
Sands Macao Total
Macao Ops
1Q14 1Q15
Mass Table, Slot and ETG Win Per Day
($MM)
SCL’s Mass Gaming Segment Impacted by Headwinds…
Especially at the High-End of the Mass Market
53
Cotai Strip Properties Peninsula Total
Mass Tables 494 394 95567 236 1,191
Slots
ETGs
1,443 1,042 2,624139 544 3,168
668 667 1,3438 375 1,718
1Q15 Average Table, Slot and ETG Units
$867
$930
$1,061
$1,219
$1,337
$1,249
$1,218
$1,106
$1,013
28.8% 29.9% 29.8% 30.5% 31.6% 30.5% 30.0%
32.4%
31.0%
0%
5%
10%
15%
20%
25%
30%
35%
40%
45%
50%
55%
60%
$0
$200
$400
$600
$800
$1,000
$1,200
$1,400
$1,600
1Q13 2Q13 3Q13 4Q13 1Q14 2Q14 3Q14 4Q14 1Q15
Mass Table Win % of Macao Mass Table Win
$10,204
$10,190
$10,961
$12,143
$13,210
$11,963
$11,518
$10,469
$9,447
$0
$2,000
$4,000
$6,000
$8,000
$10,000
$12,000
$14,000
$16,000
1Q13 2Q13 3Q13 4Q13 1Q14 2Q14 3Q14 4Q14 1Q15
Mass Table Win Mass Table Win per Table per Day2
54
($MM)
1,191
Avg.
Tables
1,124
The Mass Business Continues to Face Headwinds, Particularly at the “High-End” of Mass
Source: Macao DICJ
1. LVS’s mass table market share as presented above reflects the Macao DICJ’s presentation methodology, which includes live dealer ETG configurations within the mass table segment and Paiza cash
revenue within the VIP segment. For financial reporting purposes, LVS presents a non-rolling table segment (which includes Paiza cash and excludes all ETGs) and a slot segment (which includes all ETGs).
2. Excludes revenue from all ETGs.
SCL: Mass Table Segment
Mass Business in Macao is Facing Headwinds (Particularly at the “High-End” of Mass)
1
944
$149 $149
$166
$174
$184
$178 $176
$157
$136
29.6% 30.1%
32.6% 32.7% 32.2% 32.5% 31.5%
32.9%
31.4%
0%
10%
20%
30%
40%
50%
60%
$0
$20
$40
$60
$80
$100
$120
$140
$160
$180
$200
$220
1Q13 2Q13 3Q13 4Q13 1Q14 2Q14 3Q14 4Q14 1Q15
Slot & ETG Win % of Macao Market Slot Win
$283 $285
$327
$353
$388 $401
$424
$362
$310
$0
$50
$100
$150
$200
$250
$300
$350
$400
$450
$500
1Q13 2Q13 3Q13 4Q13 1Q14 2Q14 3Q14 4Q14 1Q15
Macao Slot and ETG Win Macao Slot and ETG Win per Unit per Day
55
($MM)
4,885
Avg.
Units
5,277
Slot Business Soft, Particularly at High-End, with Electronic Table Games Showing More Resilience
Source: Macao DICJ
1. LVS’s slot market share as presented above reflects the Macao DICJ’s slot revenue reporting methodology, which excludes ETG play. Live dealer ETG configurations are reported within
the mass table segment. For financial reporting purposes, LVS presents a non-rolling table segment (which excludes all ETGs) and a slot segment (which includes all ETGs).
SCL: Slot and ETG Segment
Slot Business Facing Headwinds…Particularly at “High End”
1
5,843
$1,223
$1,184
$1,303$1,327
$1,445
$1,117
$1,019
$838
$592
17.2% 16.8%
18.4%
16.9%
18.3%
16.8%
17.9%
15.6% 14.6%
0%
5%
10%
15%
20%
25%
30%
$0
$200
$400
$600
$800
$1,000
$1,200
$1,400
$1,600
1Q13 2Q13 3Q13 4Q13 1Q14 2Q14 3Q14 4Q14 1Q15
Rolling Win % of Macao Market Rolling Win
$26,269
$24,763
$30,365
$32,837
$39,167
$32,568
$29,893
$24,084
$19,012
$0
$5,000
$10,000
$15,000
$20,000
$25,000
$30,000
$35,000
$40,000
$45,000
1Q13 2Q13 3Q13 4Q13 1Q14 2Q14 3Q14 4Q14 1Q15
Rolling Win per Table per Day
56
Rolling Win
346Avg.
Tables
410
Declining Segment Contributed Less Than 15% of Operating Profit in the TTM Period Ending March 31, 2015
($MM)
SCL: VIP Rolling Segment
VIP Segment in Macao Continues to Decline
2.81%3.18%Rolling
Win %
5172.97%
Department TTM 1Q14 TTM 1Q15 YoY Growth (%)
Departmental Profit
Margin Range
Retail Mall $346 $398 15% 85%+
Hotel 584 635 9% 75% - 80%
Convention, F&B, Entertainment &
Other
492 514 4% Varies
Base Mass 2,583 2,657 3% 40% - 50%
Slots 673 647 -4% 40% - 50%+
Premium Mass 1,963 1,930 -2% 25% - 40%
VIP Gaming 5,260 3,566 -32% ~10%
Adj. Property EBITDA from
Macao Property Operations
Hold Normalized Adj. Prop. EBITDA
from Macao Prop. Operations
-14%
Gross Revenue (US$MM)
$3,217 $2,849 -11%
$3,173 $2,739
Macao Annual Operating Performance
Most Diversified and Defensive Cash Flows in the Macao Market
57
SCL Departmental Revenue and Profit Margins – TTM 1Q15 vs TTM 1Q14
SCL Continues to Focus on the High-Margin Non-Gaming and Mass Segments
1
1. Hold-Normalized Adjusted Property EBITDA from Macao Property Operations represents the sum of the hold-normalized figures from the four quarters ended March 31.
Department
Quarter Ended
3/31/2014
Quarter Ended
3/31/2015 YoY Growth (%)
Departmental Profit
Margin Range
Retail Mall $70 $87 25% 85%+
Hotel 165 148 -10% 75% - 80%
Convention, F&B, Entertainment &
Other
125 114 -8% Varies
Base Mass 757 601 -21% 40% - 50%
Slots 184 136 -26% 40% - 50%+
Premium Mass 580 412 -29% 25% - 40%
VIP Gaming 1,445 592 -59% ~10%
Adj. Property EBITDA from
Macao Property Operations
Hold Normalized Adj. Prop. EBITDA
from Macao Prop. Operations
Gross Revenue (US$MM)
$940 $528 -44%
$865 $528 -39%
Macao First Quarter Operating Performance
Most Diversified and Defensive Cash Flows in the Macao Market
58
SCL Departmental Revenue and Profit Margins – Quarter Ended 3/31/2015 vs 3/31/2014
SCL Continues to Focus on the High-Margin Non-Gaming and Mass Segments
$40 $49
$198
$576 $593
$688
$817
$1,030
$1,381
$1,626 $1,615
$0
$500
$1,000
$1,500
$2,000
2005 2006 2007 2008 2009 2010 2011 2012 2013 2014 TTM 1Q15
Non-Gaming Revenue (US$MM)
Macao Annual Non-Gaming Revenue
Most Diversified and Defensive Cash Flows in the Macao Market
59
($MM)
SCL Gross Non-Gaming Revenue
SCL’s High-Margin Non-Gaming Revenue Has Remained Strong
Despite Headwinds in the Gaming Segments
Lvs 1 q15 earnings deck vfinal 3

More Related Content

What's hot

Cox & Kings Financial Ratios
Cox & Kings Financial RatiosCox & Kings Financial Ratios
Cox & Kings Financial RatiosSantosh Hegde
 
lvs q217 earnings deck
lvs q217 earnings decklvs q217 earnings deck
lvs q217 earnings deck
Investor_lvs
 
Pepsi & Coca Cola Financial Analysis
Pepsi & Coca Cola Financial AnalysisPepsi & Coca Cola Financial Analysis
Pepsi & Coca Cola Financial Analysis
Hassan Shahzad
 
Haseeb project fm new
Haseeb project fm newHaseeb project fm new
Haseeb project fm newMoezza A
 
2006 Nationwide Financial Annual Report
2006 Nationwide Financial Annual Report2006 Nationwide Financial Annual Report
2006 Nationwide Financial Annual Reportfinance11
 
1 q11 conference call presentation
1 q11 conference call presentation1 q11 conference call presentation
1 q11 conference call presentationBancoABCRI
 
june investor presentation
june investor presentationjune investor presentation
june investor presentation
cedarfair
 
First Quarter 2014 Earnings Call Presentation - Principal Financial Group
First Quarter 2014 Earnings Call Presentation - Principal Financial GroupFirst Quarter 2014 Earnings Call Presentation - Principal Financial Group
First Quarter 2014 Earnings Call Presentation - Principal Financial Group
investors_principalfinancial
 
1Q15 Results Presentation
1Q15 Results Presentation1Q15 Results Presentation
1Q15 Results Presentation
AluparRI
 
4 q12 investor presentation
4 q12  investor presentation4 q12  investor presentation
4 q12 investor presentationBancoABCRI
 
MGM Third Quarter 2017 Earnings
MGM Third Quarter 2017 EarningsMGM Third Quarter 2017 Earnings
MGM Third Quarter 2017 Earnings
mgm2017ir
 
Comparative ratio analysis
Comparative ratio analysisComparative ratio analysis
Comparative ratio analysis
Nishchay Nareindra Garg
 
Principal Financial Group Investor Workshop 2015
Principal Financial Group Investor Workshop 2015Principal Financial Group Investor Workshop 2015
Principal Financial Group Investor Workshop 2015
investors_principalfinancial
 
Sceptre Investment Counsel 2008 Annual Report
Sceptre Investment Counsel 2008 Annual ReportSceptre Investment Counsel 2008 Annual Report
Sceptre Investment Counsel 2008 Annual Report
TMX Equicom
 
Abc brasil investor_presentation2q13_eng
Abc brasil investor_presentation2q13_engAbc brasil investor_presentation2q13_eng
Abc brasil investor_presentation2q13_engBancoABCRI
 
1504 april investor presentation
1504 april investor presentation1504 april investor presentation
1504 april investor presentation
cedarfair
 
4Q 2013 Earnings Conference Call Presentation
4Q 2013 Earnings Conference Call Presentation4Q 2013 Earnings Conference Call Presentation
4Q 2013 Earnings Conference Call Presentation
investors_principalfinancial
 
Ratio Analysis of Coca-Cola
Ratio Analysis of Coca-ColaRatio Analysis of Coca-Cola
Ratio Analysis of Coca-Cola
Wajid Ali
 
Principal Financial Group 101
Principal Financial Group 101Principal Financial Group 101
Principal Financial Group 101
investors_principalfinancial
 

What's hot (20)

Cox & Kings Financial Ratios
Cox & Kings Financial RatiosCox & Kings Financial Ratios
Cox & Kings Financial Ratios
 
lvs q217 earnings deck
lvs q217 earnings decklvs q217 earnings deck
lvs q217 earnings deck
 
Pepsi & Coca Cola Financial Analysis
Pepsi & Coca Cola Financial AnalysisPepsi & Coca Cola Financial Analysis
Pepsi & Coca Cola Financial Analysis
 
Haseeb project fm new
Haseeb project fm newHaseeb project fm new
Haseeb project fm new
 
ratio analysis assignment
ratio analysis assignmentratio analysis assignment
ratio analysis assignment
 
2006 Nationwide Financial Annual Report
2006 Nationwide Financial Annual Report2006 Nationwide Financial Annual Report
2006 Nationwide Financial Annual Report
 
1 q11 conference call presentation
1 q11 conference call presentation1 q11 conference call presentation
1 q11 conference call presentation
 
june investor presentation
june investor presentationjune investor presentation
june investor presentation
 
First Quarter 2014 Earnings Call Presentation - Principal Financial Group
First Quarter 2014 Earnings Call Presentation - Principal Financial GroupFirst Quarter 2014 Earnings Call Presentation - Principal Financial Group
First Quarter 2014 Earnings Call Presentation - Principal Financial Group
 
1Q15 Results Presentation
1Q15 Results Presentation1Q15 Results Presentation
1Q15 Results Presentation
 
4 q12 investor presentation
4 q12  investor presentation4 q12  investor presentation
4 q12 investor presentation
 
MGM Third Quarter 2017 Earnings
MGM Third Quarter 2017 EarningsMGM Third Quarter 2017 Earnings
MGM Third Quarter 2017 Earnings
 
Comparative ratio analysis
Comparative ratio analysisComparative ratio analysis
Comparative ratio analysis
 
Principal Financial Group Investor Workshop 2015
Principal Financial Group Investor Workshop 2015Principal Financial Group Investor Workshop 2015
Principal Financial Group Investor Workshop 2015
 
Sceptre Investment Counsel 2008 Annual Report
Sceptre Investment Counsel 2008 Annual ReportSceptre Investment Counsel 2008 Annual Report
Sceptre Investment Counsel 2008 Annual Report
 
Abc brasil investor_presentation2q13_eng
Abc brasil investor_presentation2q13_engAbc brasil investor_presentation2q13_eng
Abc brasil investor_presentation2q13_eng
 
1504 april investor presentation
1504 april investor presentation1504 april investor presentation
1504 april investor presentation
 
4Q 2013 Earnings Conference Call Presentation
4Q 2013 Earnings Conference Call Presentation4Q 2013 Earnings Conference Call Presentation
4Q 2013 Earnings Conference Call Presentation
 
Ratio Analysis of Coca-Cola
Ratio Analysis of Coca-ColaRatio Analysis of Coca-Cola
Ratio Analysis of Coca-Cola
 
Principal Financial Group 101
Principal Financial Group 101Principal Financial Group 101
Principal Financial Group 101
 

Viewers also liked

1 q15 placeholder
1 q15 placeholder1 q15 placeholder
1 q15 placeholder
Investor_lvs
 
Lvs 4 q15-earnings-deck-vfinal-3
Lvs 4 q15-earnings-deck-vfinal-3Lvs 4 q15-earnings-deck-vfinal-3
Lvs 4 q15-earnings-deck-vfinal-3
Investor_lvs
 
Corporate Summary February 2016
Corporate Summary February 2016Corporate Summary February 2016
Corporate Summary February 2016
yamanagold2016
 
LVS Q4 2014
LVS Q4 2014LVS Q4 2014
LVS Q4 2014
Investor_lvs
 
Lvs 2 q15 placeholder
Lvs 2 q15 placeholderLvs 2 q15 placeholder
Lvs 2 q15 placeholder
Investor_lvs
 
BMO Capital Markets Global Metals & Mining Conference
BMO Capital Markets Global Metals & Mining ConferenceBMO Capital Markets Global Metals & Mining Conference
BMO Capital Markets Global Metals & Mining Conference
yamanagold2016
 
Lvs 3 q15 placeholder
Lvs 3 q15 placeholderLvs 3 q15 placeholder
Lvs 3 q15 placeholder
Investor_lvs
 
Bernstein strategic-decisions-conference-2016
Bernstein strategic-decisions-conference-2016Bernstein strategic-decisions-conference-2016
Bernstein strategic-decisions-conference-2016
Investor_lvs
 
European Gold Forum - April 2016
European Gold Forum - April 2016European Gold Forum - April 2016
European Gold Forum - April 2016
yamanagold2016
 
Made in Canada
Made in CanadaMade in Canada
Made in Canada
yamanagold2016
 
Q2 2016 Conference Call and Webcast Presentation
Q2 2016 Conference Call and Webcast PresentationQ2 2016 Conference Call and Webcast Presentation
Q2 2016 Conference Call and Webcast Presentation
yamanagold2016
 
Investor Day Presentation
Investor Day PresentationInvestor Day Presentation
Investor Day Presentation
yamanagold2016
 
Investor day-2016-final
Investor day-2016-finalInvestor day-2016-final
Investor day-2016-final
yamanagold2016
 
Lvs 3 q14 earnings deck vfinal
Lvs 3 q14 earnings deck vfinalLvs 3 q14 earnings deck vfinal
Lvs 3 q14 earnings deck vfinal
Investor_lvs
 
Corporate presentation CPFL Energia maio 2016
Corporate presentation CPFL Energia maio 2016Corporate presentation CPFL Energia maio 2016
Corporate presentation CPFL Energia maio 2016
CPFL RI
 
Corporate Presentation CPFL Energia Junho 2016
Corporate Presentation CPFL Energia  Junho 2016Corporate Presentation CPFL Energia  Junho 2016
Corporate Presentation CPFL Energia Junho 2016
CPFL RI
 
Corporate presentation cpfl energia agosto 2016
Corporate presentation cpfl energia  agosto 2016Corporate presentation cpfl energia  agosto 2016
Corporate presentation cpfl energia agosto 2016
CPFL RI
 
Lvs 3 q16 earnings deck vfinal
Lvs 3 q16 earnings deck vfinalLvs 3 q16 earnings deck vfinal
Lvs 3 q16 earnings deck vfinal
Investor_lvs
 
Corporate Summary - December 2016
Corporate Summary - December 2016Corporate Summary - December 2016
Corporate Summary - December 2016
yamanagold2016
 
Third Quarter 2016 Results Presentation
Third Quarter 2016 Results PresentationThird Quarter 2016 Results Presentation
Third Quarter 2016 Results Presentation
yamanagold2016
 

Viewers also liked (20)

1 q15 placeholder
1 q15 placeholder1 q15 placeholder
1 q15 placeholder
 
Lvs 4 q15-earnings-deck-vfinal-3
Lvs 4 q15-earnings-deck-vfinal-3Lvs 4 q15-earnings-deck-vfinal-3
Lvs 4 q15-earnings-deck-vfinal-3
 
Corporate Summary February 2016
Corporate Summary February 2016Corporate Summary February 2016
Corporate Summary February 2016
 
LVS Q4 2014
LVS Q4 2014LVS Q4 2014
LVS Q4 2014
 
Lvs 2 q15 placeholder
Lvs 2 q15 placeholderLvs 2 q15 placeholder
Lvs 2 q15 placeholder
 
BMO Capital Markets Global Metals & Mining Conference
BMO Capital Markets Global Metals & Mining ConferenceBMO Capital Markets Global Metals & Mining Conference
BMO Capital Markets Global Metals & Mining Conference
 
Lvs 3 q15 placeholder
Lvs 3 q15 placeholderLvs 3 q15 placeholder
Lvs 3 q15 placeholder
 
Bernstein strategic-decisions-conference-2016
Bernstein strategic-decisions-conference-2016Bernstein strategic-decisions-conference-2016
Bernstein strategic-decisions-conference-2016
 
European Gold Forum - April 2016
European Gold Forum - April 2016European Gold Forum - April 2016
European Gold Forum - April 2016
 
Made in Canada
Made in CanadaMade in Canada
Made in Canada
 
Q2 2016 Conference Call and Webcast Presentation
Q2 2016 Conference Call and Webcast PresentationQ2 2016 Conference Call and Webcast Presentation
Q2 2016 Conference Call and Webcast Presentation
 
Investor Day Presentation
Investor Day PresentationInvestor Day Presentation
Investor Day Presentation
 
Investor day-2016-final
Investor day-2016-finalInvestor day-2016-final
Investor day-2016-final
 
Lvs 3 q14 earnings deck vfinal
Lvs 3 q14 earnings deck vfinalLvs 3 q14 earnings deck vfinal
Lvs 3 q14 earnings deck vfinal
 
Corporate presentation CPFL Energia maio 2016
Corporate presentation CPFL Energia maio 2016Corporate presentation CPFL Energia maio 2016
Corporate presentation CPFL Energia maio 2016
 
Corporate Presentation CPFL Energia Junho 2016
Corporate Presentation CPFL Energia  Junho 2016Corporate Presentation CPFL Energia  Junho 2016
Corporate Presentation CPFL Energia Junho 2016
 
Corporate presentation cpfl energia agosto 2016
Corporate presentation cpfl energia  agosto 2016Corporate presentation cpfl energia  agosto 2016
Corporate presentation cpfl energia agosto 2016
 
Lvs 3 q16 earnings deck vfinal
Lvs 3 q16 earnings deck vfinalLvs 3 q16 earnings deck vfinal
Lvs 3 q16 earnings deck vfinal
 
Corporate Summary - December 2016
Corporate Summary - December 2016Corporate Summary - December 2016
Corporate Summary - December 2016
 
Third Quarter 2016 Results Presentation
Third Quarter 2016 Results PresentationThird Quarter 2016 Results Presentation
Third Quarter 2016 Results Presentation
 

Similar to Lvs 1 q15 earnings deck vfinal 3

20180620 sauc oppenheimer consumer conference widescreen final
20180620 sauc oppenheimer consumer conference widescreen final20180620 sauc oppenheimer consumer conference widescreen final
20180620 sauc oppenheimer consumer conference widescreen final
drhincorporated
 
Lvs 1 q16 earnings deck vfinal
Lvs 1 q16 earnings deck vfinalLvs 1 q16 earnings deck vfinal
Lvs 1 q16 earnings deck vfinal
Investor_lvs
 
Session 9 - Financial Statement Analysis (1) (1).pptx
Session 9 - Financial Statement Analysis (1) (1).pptxSession 9 - Financial Statement Analysis (1) (1).pptx
Session 9 - Financial Statement Analysis (1) (1).pptx
Ruchira Perera
 
Wall street equities co 1. ltd. presentation
Wall street equities co 1. ltd. presentationWall street equities co 1. ltd. presentation
Wall street equities co 1. ltd. presentation
WSECO
 
Q2 2015 earnings presentation
Q2 2015 earnings presentationQ2 2015 earnings presentation
Q2 2015 earnings presentation
Masco_Investors
 
KCL_AR2016_Full_Report.pdf
KCL_AR2016_Full_Report.pdfKCL_AR2016_Full_Report.pdf
KCL_AR2016_Full_Report.pdf
leqhuy78
 
Capital return-announcement-with-non-gaaps
Capital return-announcement-with-non-gaapsCapital return-announcement-with-non-gaaps
Capital return-announcement-with-non-gaaps
Delta_Airlines
 
Tullio Cofrancesco - AGM 2015 - CFO Address - Office Brands Limited
Tullio Cofrancesco - AGM 2015 - CFO Address - Office Brands LimitedTullio Cofrancesco - AGM 2015 - CFO Address - Office Brands Limited
Tullio Cofrancesco - AGM 2015 - CFO Address - Office Brands Limited
Tullio Cofrancesco CA
 
Psx 2017 baml conference presentation final for posting
Psx 2017 baml conference presentation final for postingPsx 2017 baml conference presentation final for posting
Psx 2017 baml conference presentation final for posting
investor_phillips66
 
Financial Analysis 2.pptx
Financial Analysis 2.pptxFinancial Analysis 2.pptx
Financial Analysis 2.pptx
NadeemSRimawi
 
Q1 2013 Financial Results
Q1 2013 Financial ResultsQ1 2013 Financial Results
Q1 2013 Financial Results
AuRico Gold
 
Q1 2013 Financial Results
Q1 2013 Financial ResultsQ1 2013 Financial Results
Q1 2013 Financial ResultsAuRico Gold
 
Bank of America Merrill Lynch 2015 Transportation Conference
Bank of America Merrill Lynch 2015 Transportation ConferenceBank of America Merrill Lynch 2015 Transportation Conference
Bank of America Merrill Lynch 2015 Transportation Conference
Delta_Airlines
 
August Investor Presentation
August Investor PresentationAugust Investor Presentation
August Investor Presentation
Devon Energy Corporation
 
Star Bulk Carriers Q2 2013 results presentation
Star Bulk Carriers Q2 2013 results presentationStar Bulk Carriers Q2 2013 results presentation
Star Bulk Carriers Q2 2013 results presentationTradeWindsnews
 
Bootstrapping Entrepeneurs & Their Business Ppt
Bootstrapping Entrepeneurs & Their Business PptBootstrapping Entrepeneurs & Their Business Ppt
Bootstrapping Entrepeneurs & Their Business Ppt
Caroline Cummings
 

Similar to Lvs 1 q15 earnings deck vfinal 3 (20)

20180620 sauc oppenheimer consumer conference widescreen final
20180620 sauc oppenheimer consumer conference widescreen final20180620 sauc oppenheimer consumer conference widescreen final
20180620 sauc oppenheimer consumer conference widescreen final
 
Lvs 1 q16 earnings deck vfinal
Lvs 1 q16 earnings deck vfinalLvs 1 q16 earnings deck vfinal
Lvs 1 q16 earnings deck vfinal
 
Session 9 - Financial Statement Analysis (1) (1).pptx
Session 9 - Financial Statement Analysis (1) (1).pptxSession 9 - Financial Statement Analysis (1) (1).pptx
Session 9 - Financial Statement Analysis (1) (1).pptx
 
ETFC Initiation
ETFC InitiationETFC Initiation
ETFC Initiation
 
Cowen
CowenCowen
Cowen
 
Wall street equities co 1. ltd. presentation
Wall street equities co 1. ltd. presentationWall street equities co 1. ltd. presentation
Wall street equities co 1. ltd. presentation
 
Q2 2015 earnings presentation
Q2 2015 earnings presentationQ2 2015 earnings presentation
Q2 2015 earnings presentation
 
KCL_AR2016_Full_Report.pdf
KCL_AR2016_Full_Report.pdfKCL_AR2016_Full_Report.pdf
KCL_AR2016_Full_Report.pdf
 
Capital return-announcement-with-non-gaaps
Capital return-announcement-with-non-gaapsCapital return-announcement-with-non-gaaps
Capital return-announcement-with-non-gaaps
 
Tullio Cofrancesco - AGM 2015 - CFO Address - Office Brands Limited
Tullio Cofrancesco - AGM 2015 - CFO Address - Office Brands LimitedTullio Cofrancesco - AGM 2015 - CFO Address - Office Brands Limited
Tullio Cofrancesco - AGM 2015 - CFO Address - Office Brands Limited
 
Psx 2017 baml conference presentation final for posting
Psx 2017 baml conference presentation final for postingPsx 2017 baml conference presentation final for posting
Psx 2017 baml conference presentation final for posting
 
Financial Analysis 2.pptx
Financial Analysis 2.pptxFinancial Analysis 2.pptx
Financial Analysis 2.pptx
 
Q1 2013 Financial Results
Q1 2013 Financial ResultsQ1 2013 Financial Results
Q1 2013 Financial Results
 
Q1 2013 Financial Results
Q1 2013 Financial ResultsQ1 2013 Financial Results
Q1 2013 Financial Results
 
Bank of America Merrill Lynch 2015 Transportation Conference
Bank of America Merrill Lynch 2015 Transportation ConferenceBank of America Merrill Lynch 2015 Transportation Conference
Bank of America Merrill Lynch 2015 Transportation Conference
 
August Investor Presentation
August Investor PresentationAugust Investor Presentation
August Investor Presentation
 
Dvn august investor presentation
Dvn august investor presentationDvn august investor presentation
Dvn august investor presentation
 
Star Bulk Carriers Q2 2013 results presentation
Star Bulk Carriers Q2 2013 results presentationStar Bulk Carriers Q2 2013 results presentation
Star Bulk Carriers Q2 2013 results presentation
 
Bootstrapping Entrepeneurs & Their Business Ppt
Bootstrapping Entrepeneurs & Their Business PptBootstrapping Entrepeneurs & Their Business Ppt
Bootstrapping Entrepeneurs & Their Business Ppt
 
Aug 2016 presentation
Aug 2016 presentationAug 2016 presentation
Aug 2016 presentation
 

More from Investor_lvs

Lvs 1 q18 earnings slides final
Lvs 1 q18 earnings slides finalLvs 1 q18 earnings slides final
Lvs 1 q18 earnings slides final
Investor_lvs
 
Ir site blank placeholder q1 2018
Ir site blank placeholder q1 2018Ir site blank placeholder q1 2018
Ir site blank placeholder q1 2018
Investor_lvs
 
Lvs march 2018 update jpm
Lvs march 2018 update   jpmLvs march 2018 update   jpm
Lvs march 2018 update jpm
Investor_lvs
 
4 q17 earnings deck vfinal
4 q17 earnings deck   vfinal4 q17 earnings deck   vfinal
4 q17 earnings deck vfinal
Investor_lvs
 
Lvs 3 q17 earnings deck final
Lvs 3 q17 earnings deck   finalLvs 3 q17 earnings deck   final
Lvs 3 q17 earnings deck final
Investor_lvs
 
LVS Q3 Earnings Presentation
LVS Q3 Earnings PresentationLVS Q3 Earnings Presentation
LVS Q3 Earnings Presentation
Investor_lvs
 
Ir site placeholder
Ir site placeholderIr site placeholder
Ir site placeholder
Investor_lvs
 
Lvs 1 q17 earnings deck vfinal
Lvs 1 q17 earnings deck vfinalLvs 1 q17 earnings deck vfinal
Lvs 1 q17 earnings deck vfinal
Investor_lvs
 
Ir site placeholder
Ir site placeholderIr site placeholder
Ir site placeholder
Investor_lvs
 
Lvs 4 q16-earnings-deck-vfinal
Lvs 4 q16-earnings-deck-vfinalLvs 4 q16-earnings-deck-vfinal
Lvs 4 q16-earnings-deck-vfinal
Investor_lvs
 
Las Vegas Sands
Las Vegas SandsLas Vegas Sands
Las Vegas Sands
Investor_lvs
 
Lvs place holder
Lvs place holderLvs place holder
Lvs place holder
Investor_lvs
 

More from Investor_lvs (12)

Lvs 1 q18 earnings slides final
Lvs 1 q18 earnings slides finalLvs 1 q18 earnings slides final
Lvs 1 q18 earnings slides final
 
Ir site blank placeholder q1 2018
Ir site blank placeholder q1 2018Ir site blank placeholder q1 2018
Ir site blank placeholder q1 2018
 
Lvs march 2018 update jpm
Lvs march 2018 update   jpmLvs march 2018 update   jpm
Lvs march 2018 update jpm
 
4 q17 earnings deck vfinal
4 q17 earnings deck   vfinal4 q17 earnings deck   vfinal
4 q17 earnings deck vfinal
 
Lvs 3 q17 earnings deck final
Lvs 3 q17 earnings deck   finalLvs 3 q17 earnings deck   final
Lvs 3 q17 earnings deck final
 
LVS Q3 Earnings Presentation
LVS Q3 Earnings PresentationLVS Q3 Earnings Presentation
LVS Q3 Earnings Presentation
 
Ir site placeholder
Ir site placeholderIr site placeholder
Ir site placeholder
 
Lvs 1 q17 earnings deck vfinal
Lvs 1 q17 earnings deck vfinalLvs 1 q17 earnings deck vfinal
Lvs 1 q17 earnings deck vfinal
 
Ir site placeholder
Ir site placeholderIr site placeholder
Ir site placeholder
 
Lvs 4 q16-earnings-deck-vfinal
Lvs 4 q16-earnings-deck-vfinalLvs 4 q16-earnings-deck-vfinal
Lvs 4 q16-earnings-deck-vfinal
 
Las Vegas Sands
Las Vegas SandsLas Vegas Sands
Las Vegas Sands
 
Lvs place holder
Lvs place holderLvs place holder
Lvs place holder
 

Recently uploaded

Digital Transformation and IT Strategy Toolkit and Templates
Digital Transformation and IT Strategy Toolkit and TemplatesDigital Transformation and IT Strategy Toolkit and Templates
Digital Transformation and IT Strategy Toolkit and Templates
Aurelien Domont, MBA
 
The Parable of the Pipeline a book every new businessman or business student ...
The Parable of the Pipeline a book every new businessman or business student ...The Parable of the Pipeline a book every new businessman or business student ...
The Parable of the Pipeline a book every new businessman or business student ...
awaisafdar
 
ModelingMarketingStrategiesMKS.CollumbiaUniversitypdf
ModelingMarketingStrategiesMKS.CollumbiaUniversitypdfModelingMarketingStrategiesMKS.CollumbiaUniversitypdf
ModelingMarketingStrategiesMKS.CollumbiaUniversitypdf
fisherameliaisabella
 
3.0 Project 2_ Developing My Brand Identity Kit.pptx
3.0 Project 2_ Developing My Brand Identity Kit.pptx3.0 Project 2_ Developing My Brand Identity Kit.pptx
3.0 Project 2_ Developing My Brand Identity Kit.pptx
tanyjahb
 
CADAVER AS OUR FIRST TEACHER anatomt in your.pptx
CADAVER AS OUR FIRST TEACHER anatomt in your.pptxCADAVER AS OUR FIRST TEACHER anatomt in your.pptx
CADAVER AS OUR FIRST TEACHER anatomt in your.pptx
fakeloginn69
 
VAT Registration Outlined In UAE: Benefits and Requirements
VAT Registration Outlined In UAE: Benefits and RequirementsVAT Registration Outlined In UAE: Benefits and Requirements
VAT Registration Outlined In UAE: Benefits and Requirements
uae taxgpt
 
20240425_ TJ Communications Credentials_compressed.pdf
20240425_ TJ Communications Credentials_compressed.pdf20240425_ TJ Communications Credentials_compressed.pdf
20240425_ TJ Communications Credentials_compressed.pdf
tjcomstrang
 
RMD24 | Retail media: hoe zet je dit in als je geen AH of Unilever bent? Heid...
RMD24 | Retail media: hoe zet je dit in als je geen AH of Unilever bent? Heid...RMD24 | Retail media: hoe zet je dit in als je geen AH of Unilever bent? Heid...
RMD24 | Retail media: hoe zet je dit in als je geen AH of Unilever bent? Heid...
BBPMedia1
 
Exploring Patterns of Connection with Social Dreaming
Exploring Patterns of Connection with Social DreamingExploring Patterns of Connection with Social Dreaming
Exploring Patterns of Connection with Social Dreaming
Nicola Wreford-Howard
 
Putting the SPARK into Virtual Training.pptx
Putting the SPARK into Virtual Training.pptxPutting the SPARK into Virtual Training.pptx
Putting the SPARK into Virtual Training.pptx
Cynthia Clay
 
The effects of customers service quality and online reviews on customer loyal...
The effects of customers service quality and online reviews on customer loyal...The effects of customers service quality and online reviews on customer loyal...
The effects of customers service quality and online reviews on customer loyal...
balatucanapplelovely
 
Business Valuation Principles for Entrepreneurs
Business Valuation Principles for EntrepreneursBusiness Valuation Principles for Entrepreneurs
Business Valuation Principles for Entrepreneurs
Ben Wann
 
ikea_woodgreen_petscharity_dog-alogue_digital.pdf
ikea_woodgreen_petscharity_dog-alogue_digital.pdfikea_woodgreen_petscharity_dog-alogue_digital.pdf
ikea_woodgreen_petscharity_dog-alogue_digital.pdf
agatadrynko
 
Unveiling the Secrets How Does Generative AI Work.pdf
Unveiling the Secrets How Does Generative AI Work.pdfUnveiling the Secrets How Does Generative AI Work.pdf
Unveiling the Secrets How Does Generative AI Work.pdf
Sam H
 
The-McKinsey-7S-Framework. strategic management
The-McKinsey-7S-Framework. strategic managementThe-McKinsey-7S-Framework. strategic management
The-McKinsey-7S-Framework. strategic management
Bojamma2
 
What are the main advantages of using HR recruiter services.pdf
What are the main advantages of using HR recruiter services.pdfWhat are the main advantages of using HR recruiter services.pdf
What are the main advantages of using HR recruiter services.pdf
HumanResourceDimensi1
 
Project File Report BBA 6th semester.pdf
Project File Report BBA 6th semester.pdfProject File Report BBA 6th semester.pdf
Project File Report BBA 6th semester.pdf
RajPriye
 
FINAL PRESENTATION.pptx12143241324134134
FINAL PRESENTATION.pptx12143241324134134FINAL PRESENTATION.pptx12143241324134134
FINAL PRESENTATION.pptx12143241324134134
LR1709MUSIC
 
Introduction to Amazon company 111111111111
Introduction to Amazon company 111111111111Introduction to Amazon company 111111111111
Introduction to Amazon company 111111111111
zoyaansari11365
 
Enterprise Excellence is Inclusive Excellence.pdf
Enterprise Excellence is Inclusive Excellence.pdfEnterprise Excellence is Inclusive Excellence.pdf
Enterprise Excellence is Inclusive Excellence.pdf
KaiNexus
 

Recently uploaded (20)

Digital Transformation and IT Strategy Toolkit and Templates
Digital Transformation and IT Strategy Toolkit and TemplatesDigital Transformation and IT Strategy Toolkit and Templates
Digital Transformation and IT Strategy Toolkit and Templates
 
The Parable of the Pipeline a book every new businessman or business student ...
The Parable of the Pipeline a book every new businessman or business student ...The Parable of the Pipeline a book every new businessman or business student ...
The Parable of the Pipeline a book every new businessman or business student ...
 
ModelingMarketingStrategiesMKS.CollumbiaUniversitypdf
ModelingMarketingStrategiesMKS.CollumbiaUniversitypdfModelingMarketingStrategiesMKS.CollumbiaUniversitypdf
ModelingMarketingStrategiesMKS.CollumbiaUniversitypdf
 
3.0 Project 2_ Developing My Brand Identity Kit.pptx
3.0 Project 2_ Developing My Brand Identity Kit.pptx3.0 Project 2_ Developing My Brand Identity Kit.pptx
3.0 Project 2_ Developing My Brand Identity Kit.pptx
 
CADAVER AS OUR FIRST TEACHER anatomt in your.pptx
CADAVER AS OUR FIRST TEACHER anatomt in your.pptxCADAVER AS OUR FIRST TEACHER anatomt in your.pptx
CADAVER AS OUR FIRST TEACHER anatomt in your.pptx
 
VAT Registration Outlined In UAE: Benefits and Requirements
VAT Registration Outlined In UAE: Benefits and RequirementsVAT Registration Outlined In UAE: Benefits and Requirements
VAT Registration Outlined In UAE: Benefits and Requirements
 
20240425_ TJ Communications Credentials_compressed.pdf
20240425_ TJ Communications Credentials_compressed.pdf20240425_ TJ Communications Credentials_compressed.pdf
20240425_ TJ Communications Credentials_compressed.pdf
 
RMD24 | Retail media: hoe zet je dit in als je geen AH of Unilever bent? Heid...
RMD24 | Retail media: hoe zet je dit in als je geen AH of Unilever bent? Heid...RMD24 | Retail media: hoe zet je dit in als je geen AH of Unilever bent? Heid...
RMD24 | Retail media: hoe zet je dit in als je geen AH of Unilever bent? Heid...
 
Exploring Patterns of Connection with Social Dreaming
Exploring Patterns of Connection with Social DreamingExploring Patterns of Connection with Social Dreaming
Exploring Patterns of Connection with Social Dreaming
 
Putting the SPARK into Virtual Training.pptx
Putting the SPARK into Virtual Training.pptxPutting the SPARK into Virtual Training.pptx
Putting the SPARK into Virtual Training.pptx
 
The effects of customers service quality and online reviews on customer loyal...
The effects of customers service quality and online reviews on customer loyal...The effects of customers service quality and online reviews on customer loyal...
The effects of customers service quality and online reviews on customer loyal...
 
Business Valuation Principles for Entrepreneurs
Business Valuation Principles for EntrepreneursBusiness Valuation Principles for Entrepreneurs
Business Valuation Principles for Entrepreneurs
 
ikea_woodgreen_petscharity_dog-alogue_digital.pdf
ikea_woodgreen_petscharity_dog-alogue_digital.pdfikea_woodgreen_petscharity_dog-alogue_digital.pdf
ikea_woodgreen_petscharity_dog-alogue_digital.pdf
 
Unveiling the Secrets How Does Generative AI Work.pdf
Unveiling the Secrets How Does Generative AI Work.pdfUnveiling the Secrets How Does Generative AI Work.pdf
Unveiling the Secrets How Does Generative AI Work.pdf
 
The-McKinsey-7S-Framework. strategic management
The-McKinsey-7S-Framework. strategic managementThe-McKinsey-7S-Framework. strategic management
The-McKinsey-7S-Framework. strategic management
 
What are the main advantages of using HR recruiter services.pdf
What are the main advantages of using HR recruiter services.pdfWhat are the main advantages of using HR recruiter services.pdf
What are the main advantages of using HR recruiter services.pdf
 
Project File Report BBA 6th semester.pdf
Project File Report BBA 6th semester.pdfProject File Report BBA 6th semester.pdf
Project File Report BBA 6th semester.pdf
 
FINAL PRESENTATION.pptx12143241324134134
FINAL PRESENTATION.pptx12143241324134134FINAL PRESENTATION.pptx12143241324134134
FINAL PRESENTATION.pptx12143241324134134
 
Introduction to Amazon company 111111111111
Introduction to Amazon company 111111111111Introduction to Amazon company 111111111111
Introduction to Amazon company 111111111111
 
Enterprise Excellence is Inclusive Excellence.pdf
Enterprise Excellence is Inclusive Excellence.pdfEnterprise Excellence is Inclusive Excellence.pdf
Enterprise Excellence is Inclusive Excellence.pdf
 

Lvs 1 q15 earnings deck vfinal 3

  • 1. The Venetian Macao Marina Bay Sands, Singapore Sands Macao Four Seasons Macao Sands Bethlehem The Venetian Las Vegas The Palazzo Las Vegas 1Q15 Earnings Call Presentation April 22, 2015 The Parisian MacaoSands Cotai Central, Macao
  • 2. This presentation contains forward-looking statements that are made pursuant to the Safe Harbor Provisions of the Private Securities Litigation Reform Act of 1995. Forward- looking statements involve a number of risks, uncertainties or other factors beyond the company’s control, which may cause material differences in actual results, performance or other expectations. These factors include, but are not limited to, general economic conditions, competition, new ventures, substantial leverage and debt service, government regulation, legalization of gaming, interest rates, future terrorist acts, influenza, insurance, gaming promoters, risks relating to our gaming licenses, certificate and subconcession, infrastructure in Macao and other factors detailed in the reports filed by Las Vegas Sands Corp. with the Securities and Exchange Commission. Readers are cautioned not to place undue reliance on these forward-looking statements, which speak only as of the date thereof. Las Vegas Sands Corp. assumes no obligation to update such information. Forward Looking Statements 2
  • 3.  The global leader in Integrated Resort development and operation, delivering strong and diversified cash flow and earnings as well as growing recurring dividends  Best positioned operator to deliver growth in Asia, with the pre-eminent destination Integrated Resort properties in the world’s largest and fastest growing consumer markets  Uniquely positioned to bring unmatched track record, powerful convention-based business model and the industry’s strongest balance sheet to the world’s most promising Integrated Resort development opportunities  Committed to maximizing shareholder returns by delivering long-term growth while continuing to increase the return of capital to shareholders through recurring dividend and stock repurchase programs  The industry’s most experienced leadership team: visionary, disciplined and dedicated to driving long-term shareholder value The Investment Case for Las Vegas Sands 3 Maximizing Return to Shareholders by: 1. Delivering long-term growth in current markets 2. Using leadership position in convention-based Integrated Resort development and operation to pursue global growth opportunities 3. Increasing return of capital to shareholders
  • 4.  Net revenue decreased 24.9% to $3.01 billion  Consolidated adjusted property EBITDA decreased 29.0% to $1.05 billion  Macao – Adjusted property EBITDA decreased 43.8% to $527.7 million, as a result of a challenging gaming environment, particularly in the VIP and premium mass segments, which offset strong growth in retail mall income and steady performance in other non-gaming segments  Marina Bay Sands – Adjusted property EBITDA decreased 4.6% to $415.3 million (but was up 0.2% on a constant-currency basis). Mass win per day set an all-time record when measured in local currency terms.  Adjusted diluted EPS decreased 32.0% to $0.66 per share  LVS returned a total of $518.9 million to shareholders during the quarter through its $0.65 per share recurring dividend, an increase of 30% First Quarter 2015 Highlights Despite Current Headwinds in Macao – Increasing Returns of Capital to Shareholders 4 NOTE: All comparisons in this presentation compare the first quarter 2015 against the first quarter 2014 unless otherwise specified.
  • 5. $ in millions, except per share information 1Q14 1Q15 $ Change % Change Net Revenue 4,010.4$ 3,011.6$ (998.8)$ -24.9% Adjusted Property EBITDA 1,479.7$ 1,050.5$ (429.2)$ -29.0% Adjusted Property EBITDA Margin 36.9% 34.9% -200 bps Adjusted Diluted EPS 0.97$ 0.66$ (0.31)$ -32.0% Dividends per Common Share 0.50$ 0.65$ 0.15$ 30.0% Hold-Normalized Adjusted Property EBITDA 1,365.2$ 1,021.6$ (343.6)$ -25.2% Hold-Normalized Adj. Property EBITDA Margin 35.7% 34.3% -140 bps Hold-Normalized Adjusted Diluted EPS 0.87$ 0.64$ (0.23)$ -26.4% First Quarter 2015 Financial Results 5
  • 6.  Macao – Growth in retail mall continues, VIP and premium mass gaming soft — Mass table win decreased 24.2% to $1.01 billion (compared to a 27.1%¹ decrease in the Macao market) — Slot and ETG win decreased 26.0% to $136.4 million (compared to a 26.3%¹ decrease in the Macao market) — Retail mall revenue increased 25.0% to $87.4 million — Rolling win decreased 59.0% to $592.4 million  Singapore – Growth in mass and retail — Mass table and slot win increased 1.1% to $422.6 million ($4.70 million win per day) — Retail mall revenue increased 3.4% to $39.8 million — Rolling win decreased 22.2% to $343.7 million — RevPAR decreased 7.5% to $393, ADR decreased 3.3% to $414 and room revenue decreased 7.7% to $89.6 million Macao – Growth in Retail; Challenging Gaming Environment Singapore – Growth in Mass Gaming and Retail 61. Based on Macao DICJ disclosure.
  • 7. Year Year Year Quarter Ended Ended Ended Ended $ in millions 12/31/2012 12/31/2013 12/31/2014 3/31/2015 Total LVS Dividends Paid1 823$ 1,153$ 1,610$ 519$ 4,105$ LVS Special Dividend Paid 2,262 - - - 2,262 LVS Shares Repurchased - 570 1,665 - 2,235 Subtotal LVS 3,085$ 1,723$ 3,275$ 519$ 8,602$ SCL Dividends Paid 2 357 411 538 308 1,614 SCL Special Dividend Paid - - 239 - 239 Subtotal SCL 357$ 411$ 777$ 308$ 1,853$ Total 3,442$ 2,134$ 4,052$ 827$ 10,455$ $1.00 $1.40 $2.00 $2.60 $0.00 $0.50 $1.00 $1.50 $2.00 $2.50 $3.00 2012 2013 2014 2015 7 LVS Increasing Return of Capital to Shareholders Nearly $10.5 Billion of Capital Returned to Shareholders Over Last 13 Quarters LVS Recurring Dividends per Share1  In the fourth quarter of 2014, the LVS Board of Directors increased the LVS recurring dividend by 30.0% to $2.60 per share for the 2015 calendar year ($0.65 per share payable quarterly)  In the fourth quarter of 2014, the LVS Board of Directors also authorized an additional $2.0 billion stock repurchase program following the completion of the previous $2.0 billion program  The company remains committed to returning capital to shareholders via: — Recurring quarterly dividend program at Las Vegas Sands with a commitment to grow the recurring dividend each year — $2.0 billion Las Vegas Sands stock repurchase program ($1.77 billion remaining) to be used to return excess capital to shareholders 1. Excludes dividends paid by Sands China Ltd. and excludes the $2.75 per share special dividend paid in December 2012. 2. Reflects only the public (non-LVS) portion of dividends paid by Sands China Ltd. (total SCL dividends paid since 2011 were $6.2 billion). The Company Remains Committed to Returning Capital to Shareholders While Maintaining a Strong Balance Sheet and the Financial Flexibility to Pursue New Development Opportunities Total Capital Returned to Shareholders
  • 8. US$ in millions Interim Final Interim Final Interim Final Interim Final Total SCL Dividends Paid 1 600$ 602$ 696$ 685$ 906$ 894$ 1,030$ 5,413$ SCL Special Dividend Paid - - - - 801 - - 801 Total 600$ 602$ 696$ 685$ 1,707$ 894$ 1,030$ $6,214 ³ Year Ended 12/31/201512/31/2012 Year Ended Year Ended Year Ended 12/31/2013 12/31/2014 $1.16 $1.33 $1.73 $1.99 $0.00 $0.50 $1.00 $1.50 $2.00 $2.50 $3.00 2012 2013 2014 2015² 8 SCL Also Increasing Return of Capital to Shareholders Over US$6.2 Billion of Capital Returned to Shareholders Over Last 13 Quarters SCL Recurring Dividends per Share (HK$)1  The SCL Board of Directors recommended increasing the SCL 2015 dividend to HK$1.99 per share, including an interim dividend of HK$0.99 per share paid in February and a final recommended dividend of HK$1.00 per share²  The company remains committed to returning capital to shareholders via: — Recurring bi-annual dividend program at Sands China Ltd. with a commitment to grow the recurring dividend each year 1. Excludes the special dividend paid in 2014. 2. The full 2015 dividend of HK$1.99 per share includes the interim dividend of HK$0.99 per share and the proposed final dividend of HK$1.00 per share. The final dividend is subject to the approval of the SCL shareholders at the SCL Annual General Meeting on June 17, 2015. 3. Includes $4.36 billion in dividends paid to the parent company, Las Vegas Sands Corp. SCL Remains Committed to Returning Capital to Shareholders While Maintaining a Strong Balance Sheet and the Financial Flexibility to Pursue Development Opportunities SCL Total Capital Returned to Shareholders
  • 9. 5.2% 4.7% 4.3% 3.7% 3.3% 2.9% 0.0% 0.5% 1.0% 1.5% 2.0% 2.5% 3.0% 3.5% 4.0% 4.5% 5.0% 5.5% $50.00 $55.44 $60.00 $70.00 $80.00 $90.00 4.7% 2.2% 0.0% 0.5% 1.0% 1.5% 2.0% 2.5% 3.0% 3.5% 4.0% 4.5% 5.0% 5.5% LVS S&P500 LVS Generates Greater Forward Dividend Yield than the S&P500 Index 2015 Forward Dividend Yield of LVS and S&P5001 1. Reflects the 2015 dividend yield for LVS and the Bloomberg 2015 forward dividend yield estimate for the S&P500 on April 21, 2015. 2. Reflects the 2015 LVS dividend ($2.60) over the closing price for LVS on April 21, 2015. LVS’s 2015 Dividend Yield of 4.7% Reflects a 250 bps Premium Above the S&P500 Forward Dividend Yield Estimates Sensitivity of LVS Dividend Yield Dividend Yield as of 4/21/15² +250 bps 9
  • 10. Figures as of March 31, 2015 Sands China U.S. Corporate (US GAAP in $MM) Ltd. Singapore Operations2 and Other Total Cash, Cash Equivalents and Restricted Cash 1,183.4$ 474.9$ 606.6$ 148.5$ 2,413.4$ Debt 2,774.1$ 3,315.1$ 3,151.8$ -$ 9,241.0$ Net Debt 1,590.7$ 2,840.2$ 2,545.2$ (148.5)$ 6,827.6$ Trailing Twelve Months Adjusted Property EBITDA 2,856.5$ 1,703.3$ 432.2$ 1.2$ 4,993.2$ Gross Debt to Trailing Twelve Months EBITDA 1.0 x 1.9 x 7.3 x NM 1.9 x Net Debt to Trailing Twelve Months EBITDA 0.6 x 1.7 x 5.9 x NM 1.4 x At March 31, 2015:  Trailing Twelve Months Adjusted Property EBITDA – $4.99 billion  Trailing Twelve Months LVS Dividends Paid – $1.72 billion  Trailing Twelve Months SCL Dividends Paid – $575.3 million1  Trailing Twelve Months LVS Stock Repurchases – $854.7 million  Cash Balance – $2.41 billion  Net Debt – $6.83 billion  Net Debt to TTM EBITDA – 1.4x Strong Cash Flow, Balance Sheet and Liquidity Flexibility for Future Growth Opportunities and Increasing Return of Capital 10 1. Reflects only the public (non-LVS) portion of dividends paid by Sands China Ltd. Total TTM dividends paid by Sands China Ltd. were $1.92 billion. 2. U.S. Operations includes the cash and debt at the U.S. Restricted Group (plus $62.8 million in airplane and other financings) and adjusted property EBITDA from Las Vegas operations and Sands Bethlehem. 3. The net leverage ratio for covenant compliance purposes, which includes the dividends and royalty fees paid by Sands China Ltd. and Marina Bay Sands to the U.S. Operations, was 0.8x. 4. Does not reflect the $1 billion new term loan at SCL under its existing credit facility. Funding is expected to be on or around April 30, 2015. Strong Balance Sheet and Cash Flow Maximize Financial Flexibility 3 4
  • 11. $939.8 $527.7 $864.8 $527.7 34.9% 30.2% 33.8% 30.2% 0% 10% 20% 30% 40% 50% 60% $0 $100 $200 $300 $400 $500 $600 $700 $800 $900 $1,000 1Q14 1Q15 1Q14 1Q15 Macao Operating Performance 11 ($MM) Macao Property Operations Adjusted Property EBITDA and Adjusted Property EBITDA Margin Actual Hold-Normalized -39.0%-43.8%
  • 12. Mass Tables 53% Slots 8% Hotel 12% Mall 8% Other 1% VIP 18% Mass Tables 52% Slots 8% Hotel 14% Mall 10% Other 3% VIP 13% TTM 1Q14 Macao: Diversified and Stable Sources of Departmental Profit For Las Vegas Sands and Sands China 12 Mass Tables / Slots and Non-Gaming Generated 87% of Macao’s Departmental Profit in the TTM 1Q15 Period vs. 82% in the TTM 1Q14 Period Macao Departmental Profit Contribution by Segment TTM 1Q15
  • 13. $344 $372 $452 $559 $580 $547 $509 $461 $412 $0 $100 $200 $300 $400 $500 $600 $700 $800 $900 1Q13 2Q13 3Q13 4Q13 1Q14 2Q14 3Q14 4Q14 1Q15 $523 $557 $609 $659 $757 $702 $709 $645 $601 $0 $100 $200 $300 $400 $500 $600 $700 $800 $900 1Q13 2Q13 3Q13 4Q13 1Q14 2Q14 3Q14 4Q14 1Q15 13 SCL Base Mass Table Win by Quarter Macao: SCL Base Mass Showing Greater Stability Than Premium Mass in Current Softer Market Note: LVS base mass and premium mass table revenues as presented above are based on the geographic position of the tables on the gaming floor. Our Mass Table Offering is the Broadest and the Deepest in the Macao Market ($MM) SCL Premium Mass Table Win by Quarter SCL Departmental Profit Margin: 40% - 50% SCL Departmental Profit Margin: 25% - 40% ($MM) 215 Avg. Tables 248 326729 Avg. Tables 877 865 Avg. Win per Table per Day: $7,705 Avg. Win per Table per Day: $14,020
  • 14. Executing Our Mass Strategy in Macao Expansion of Mass Market Offerings Underway with The Parisian Family-friendly Entertainment World Class Concerts, Sporting Events and Other Entertainment Offerings Over 1.5 million sq. feet of World Class Shopping Market-Leading Customer Database Highly Themed Tourism Attractions Portfolio of Nearly 9,300 Suites and Hotel Rooms Over 2 million sq. feet of Conference, Exhibition and Carpeted Meeting Space The Broadest and Deepest Mass Tourism Offerings in Macao Our Diversified Convention-based Integrated Resort Offerings Appeal to the Broadest Set of Customers and Comprise a Unique Competitive Advantage in the Macao Market 14
  • 15. Macao Mass Visitation Drivers Future Growth Drivers  More efficient and affordable transportation infrastructure  Additional tourism attractions in Macao and Hengqin Island  Greater number of hotel rooms in Macao  Rapidly expanding middle-class with growing disposable income 15 As a result, Macao’s Mass visitors will:  Come From Farther Away  Stay Longer  Spend More On: • Dining • Lodging • Retail • Entertainment • Gaming
  • 16. Twelve Months Ended February 28, Population GDP Per Penetration Province 2014 2015 % Change (MM) Capita (US$) Rate Guangdong 8,317,884 9,160,041 +10% 104 $9,452 8.8% Fujian 783,432 916,013 +17% 37 $9,342 2.5% Hunan 668,484 772,130 +16% 66 $5,936 1.2% Zhejiang 652,932 697,980 +7% 54 $11,054 1.3% Hubei 567,318 685,640 +21% 58 $6,881 1.2% Jiangsu 523,927 583,640 +11% 79 $12,047 0.7% Shanghai 544,361 543,891 -0.1% 23 $14,547 2.4% Henan 381,666 518,693 +36% 94 $5,518 0.6% Guangxi 409,971 518,457 +26% 46 $4,939 1.1% Jiangxi 376,265 467,015 +24% 45 $5,130 1.0% Sichuan 379,725 403,849 +6% 80 $5,240 0.5% Beijing 368,546 378,296 +3% 20 $15,051 1.9% Hebei 259,681 347,888 +34% 72 $6,251 0.5% Liaoning 303,854 342,504 +13% 44 $9,961 0.8% Heilongjiang 251,611 309,565 +23% 38 $6,057 0.8% Shandong 274,265 309,456 +13% 96 $9,094 0.3% Chongqing 228,142 264,793 +16% 30 $6,910 0.9% All Other 3,761,812 4,196,808 +12% 407 N/A 1.0% Subtotal (Excluding Guangdong) 10,735,992 12,256,618 +14% 1,288 $6,617 1.0% Mainland China 19,053,876 21,416,659 +12% 1,392 $6,767 1.5% 16 NOTE: Penetration rates assume that each visitor to Macao from Mainland China is a unique visitor. Source: Macao DSEC; National Bureau of Statistics of China; LVS Estimates Year-Over-Year Visitation Growth Mainland Chinese Visitation to Macao Greater than 20% Data Not Available-10%- 0% 0% - 10% 10%- 20% Strong Growth in Mainland Chinese Visitation to Macao Strongest Growth Realized in Provinces Served by High Speed Rail Xinjiang Tibet Qinghai Sichuan Chongqing Henan Hubei Shanxi Hebei Shandong Beijing Liaoning Jilin Heilongjiang Jiangsu Anhui Hunan Jiangxi Zhejiang Guangxi Guizhou Yunnan Ningxia Shaanxi Inner Mongolia Gansu Guangdong Fujian Shanghai Tianjin Hong Kong Macao
  • 17. Expanding Our Critical Mass on the Cotai Strip The Parisian Macao 17LVS Operating Assets Third Party Operating Asset Third Party Future Development Construction Progress – April 20, 2015Map of Macao’s Cotai Strip  The Parisian Macao is a $2.7 billion themed, aspirational destination Integrated Resort  Construction continues to progress  Hotel rooms and suites: 3,000+  Gaming capacity: ~450 table games and 2,500 slots and ETGs  Additional amenities including a retail mall, 50% scale replica Eiffel Tower, MICE space, diverse food & beverage options and entertainment  The Parisian Macao will be interconnected to our other Cotai Strip properties through mall access and other pedestrian connectivity including a walkover bridge from Sands Cotai Central Rendering of The Parisian Macao LVS Future Development
  • 18. Expanding Our Critical Mass on the Cotai Strip The St. Regis Tower at Sands Cotai Central 18 Construction Progress – April 20, 2015Map of Macao’s Cotai Strip  St. Regis branded 5-star hotel and serviced apartments to complement the existing portfolio of brands on the Cotai Strip  Construction continues to progress  Hotel rooms and suites: ~400  Serviced Apartments: ~300 Rendering of The St. Regis Tower LVS Operating Assets Third Party Operating Asset Third Party Future Development LVS Future Development
  • 19. 28% 32% 35% 0% 10% 20% 30% 40% 2012 2013 2014 Macao Market Annual EBITDA Market Share by Operator SCL Expanded Market Share of Macao EBITDA by 700 bps Over the Last Two Years Source: Company Reports 1. Reflects reported adjusted property EBITDA for operating properties for the twelve months ended December 31. 2. Galaxy only includes EBITDA from Starworld and Galaxy Macau. Historical EBITDA Market Share1,2 19 Galaxy MPELSCL 2 SJM Wynn MGM SCL Macao Property Operations All Others 18% 18% 18% 14% 15% 14% 14% 12% 11% 16% 14% 13% 10% 9% 9% 0% 20% 40% 60% 80% 2012 2013 2014 Macao Leader in Market Share of EBITDA 72% 68% 65%
  • 20. $9,199 $9,421$354 -$131 $0 $1,000 $2,000 $3,000 $4,000 $5,000 $6,000 $7,000 $8,000 $9,000 $10,000 $11,000 2013 EBITDA SCL EBITDA Growth All Others EBITDA Growth 2014 EBITDA¹ $3,261 $1,720 $1,287 $1,258 $1,002 $894 $0 $500 $1,000 $1,500 $2,000 $2,500 $3,000 $3,500 LVS Galaxy² MPEL Wynn Macau SJM MGM China LVS Outperforming the Macao Market in EBITDA Generation and Growth LVS Had 35% Market Share of EBITDA in 2014 and Generated $354 million of Incremental EBITDA Y/Y Source: Company Reports 1. Reflects adjusted property EBITDA for operating properties based on US GAAP for the twelve months ended December 31, 2014. 2. Galaxy only includes revenue and EBITDA from Starworld and Galaxy Macau. EBITDA Margin 6% -7% -5% -11% 5% 2014 Macao Market EBITDA1 EBITDA TTM Growth 28% 27% 33% 17% 27% ($MM) 2014 Macao Market EBITDA Growth¹ ($MM) 12% 34% 18% 14% 13% 11% 9% Macao Market EBITDA Share (%) 35% 20
  • 21. $3.01 $3.11 $1.64 $1.59 $4.65 $4.70 $0.0 $2.0 $4.0 $6.0 1Q14 1Q15 Non-Rolling Tables Slot Machines $435.2 $415.3 $377.9 $371.3 52.1% 52.9% 49.5% 50.9% 20% 30% 40% 50% 60% 70% 80% $0 $100 $200 $300 $400 $500 $600 1Q14 1Q15 1Q14 1Q15 Marina Bay Sands Operations Strong Retail and Mass Gaming Performance¹ 21 Actual  Adjusted property EBITDA of $415.3 million, a decrease of 4.6% (Adjusted Property EBITDA increased 0.2% on a constant-currency basis) — Hold-normalized adjusted property EBITDA of $371.3 million, a decrease of 1.7%  Total mass (non-rolling tables and slots) win per day increased 1.1% to reach $4.70 million (+5.9% on a constant-currency basis) — Total mass win was a property record in Singapore dollars — Non-Rolling win increased 3.3% to $280.0 million — Slot win decreased 3.4% to $142.7 million  Room revenue decreased 7.7% as RevPAR decreased 7.5% to $393 and ADR decreased 3.3% to $414  Retail mall revenue increased 3.4% to $39.8 million  Rolling win decreased 22.2% to $343.7 million (rolling volume decreased 22.0% to $10.09 billion) ($MM) ($MM) Adjusted Property EBITDA and Adjusted Property EBITDA Margin Continued Growth in Mass Table and Retail Businesses Despite Headwind from Stronger US$ Non-Rolling Table and Slot Win Per Day Hold-Normalized 1. Due to a strengthened USD in 1Q15 compared to 1Q14, MBS faced a currency headwind of approximately 4.7 percentage points in 1Q15 compared to 1Q14
  • 22. VIP 11% Mass Tables 38% Slots 21% Hotel 18% Mall 8% Other 4% VIP 15% Mass Tables 37% Slots 19% Hotel 18% Mall 7% Other 4% TTM 1Q14¹ Singapore: Diversified and Stable Sources of Departmental Profit For Las Vegas Sands 22 Mass Tables / Slots and Non-Gaming Generated 89% of Singapore’s Hold-Normalized Departmental Profit in TTM 1Q15 Singapore Hold-Normalized Departmental Profit Contribution by Segment TTM 1Q15¹ 1. In TTM 1Q15, VIP hold was 3.29% compared to 2.67% in TTM 1Q14. On a non hold-normalized basis, VIP contribution would have been 12% in TTM 1Q14 and 17% in TTM 1Q15.
  • 23. $177 $182 $188 $192 $198 $126 $125 $129 $132 $139 $43 $45 $52 $57 $61 $156 $160 $167 $169 $171 $502 $512 $536 $551 $569 $0 $100 $200 $300 $400 $500 $600 1Q14 2Q14 3Q14 4Q14 1Q15 Venetian Macao Four Seasons Macao Sands Cotai Central¹ Marina Bay Sands Asia Retail Mall Portfolio Continues to Generate Strong Growth in Revenue and Operating Profit 23 ($MM) Trailing Twelve Months Retail Mall Revenue 88%86% 86% 86% Operating Profit Margin 88% 1. At March 31, 2015, 324,408 square feet of gross leasable area were occupied out of a total of up to 600,000 square feet of retail mall space that will be featured at completion of all phases of Sands Cotai Central. 2. Tenant sales per square foot is the sum of reported comparable sales for the trailing 12-months divided by the comparable square footage for the same period. Only tenants that have occupied mall space for a minimum of 12 months are included in the tenant sales per square foot calculation. $503M$430M $442M $463M Operating Profit $482M TTM 1Q15 Sales per Sq. Foot² MBS: $1,409 SCC: $1,407 Four Seasons: $5,246 Venetian: $1,636
  • 24. $67.7 $69.6 $77.9 $80.9 $85.7 $8.4 $26.8 $46.9 $69.9 $78.0 $104.7 $127.8 $87.4 $- $20 $40 $60 $80 $100 $120 $140 $160 1Q14 2Q14 3Q14 4Q14 1Q15 Base Rent and Other Fees Turnover Rent Macao Quarterly Retail Revenue Composition 24 Strong Growth In Macao Retail Mall Revenue ($MM) Strong Retail Revenue Growth Across Macao Property Portfolio $2.2 $1.6
  • 25. South Korea Promising Areas of Future Development Interest for Las Vegas Sands Japan  As the global leader in Integrated Resort development and operation, Las Vegas Sands is uniquely positioned to bring its unmatched track record and powerful convention-based business model to the world’s most promising Integrated Resort development opportunities  Development opportunity parameters: — Targeting minimum of 20% return on total invested capital — 25% - 35% of total project costs to be funded with equity (project financing to fund 65% - 75% of total project costs) Disciplined Execution of Our Global Growth Strategy 25 Macao The Parisian Macao St. Regis Tower at Sands Cotai Central Vietnam
  • 26.
  • 28. $ in millions 1Q14 2Q14 3Q14 4Q14 1Q15 Macao Property Operations Reported 939.8$ 801.3$ 809.0$ 711.2$ 527.7$ Hold-Normalized 864.8$ 752.5$ 772.1$ 686.2$ 527.7$ Marina Bay Sands Reported 435.2$ 417.8$ 351.7$ 518.5$ 415.3$ Hold-Normalized 377.9$ 368.5$ 366.5$ 461.0$ 371.3$ Las Vegas Operations Reported 79.7$ 66.1$ 90.2$ 78.0$ 74.1$ Hold-Normalized 97.3$ 70.4$ 83.6$ 87.6$ 89.2$ Sands Bethlehem Reported 26.5$ 27.9$ 29.8$ 36.2$ 29.9$ Hold-Normalized 26.5$ 27.9$ 29.8$ 36.2$ 29.9$ LVS Consolidated2 Reported 1,479.7$ 1,312.6$ 1,283.9$ 1,346.1$ 1,050.5$ Hold-Normalized 1,365.2$ 1,218.8$ 1,255.1$ 1,273.3$ 1,021.6$ Historical Hold-Normalized Adj. Property EBITDA1 28 1. This schedule presents hold-normalized adjusted property EBITDA based on the following methodology: (a) for Macao operations and Marina Bay Sands: if the quarter’s rolling win percentage is outside of the 2.70%-3.00% band, then a hold-adjustment is calculated by applying a rolling win percentage of 2.85% to the rolling table volume for the quarter. (b) for Las Vegas operations: starting with 1Q15, if the quarter’s Baccarat win percentage is outside of the 21.0%-29.0% band, then a hold-adjustment is calculated by applying a Baccarat win percentage of 25.0%, and if the quarter’s non-Baccarat win percentage is outside of the 16.0%-20.0% band, then a hold-adjustment is calculated by applying a non-Baccarat win percentage of 18.0%. Our expected Baccarat win percentage in the prior quarters was 22.0% to 30.0% (26.0% normalized) and our expected non-Baccarat win percentage in prior quarters was 14.0% to 18.0% (16.0% normalized). (c) for Sands Bethlehem: no hold-adjustment is made. (d) for all properties: gaming taxes, commissions paid to third parties on incremental win, bad debt expense, discounts and other incentives are applied to determine the EBITDA impact. 2. Reflects consolidated adjusted property EBITDA inclusive of Other Asia (principally CotaiJet operations) segment.
  • 29. $1,086 $2,229 $3,532 $3,791 $4,763 $5,422 $4,993 $0 $1,000 $2,000 $3,000 $4,000 $5,000 $6,000 2009 2010¹ 2011 2012² 2013 2014 TTM 1Q15 $4,563 $6,853 $9,411 $11,131 $13,770 $14,584 $13,585 $0 $2,000 $4,000 $6,000 $8,000 $10,000 $12,000 $14,000 $16,000 2009 2010¹ 2011 2012² 2013 2014 TTM 1Q15 LVS Historical Net Revenue ($MM) Strong Historical Revenue and EBITDA Growth Over the Last Five Years LVS Historical Adjusted Property EBITDA ($MM) Margin 23.8% 32.5% 34.1%37.5% 34.6% 1. Marina Bay Sands opened in April 2010. 2. Sands Cotai Central opened in April 2012. The Strength and Consistency of our Convention-Based Integrated Resort Business Model is Reflected in our Financial Results 37.2% 29 36.8%
  • 30. $0.07 $0.98 $2.02 $2.14 $2.90 $3.58 $3.27 $0.00 $0.50 $1.00 $1.50 $2.00 $2.50 $3.00 $3.50 $4.00 $4.50 2009 2010¹ 2011 2012² 2013 2014 TTM 1Q15 $48 $775 $1,644 $1,768 $2,399 $2,894 $2,631 $0 $500 $1,000 $1,500 $2,000 $2,500 $3,000 $3,500 2009 2010¹ 2011 2012² 2013 2014 TTM 1Q15 LVS Historical Adjusted Net Income Strong Historical Adjusted Net Income and Adjusted EPS Growth Over the Last Five Years LVS Historical Adjusted Diluted Earnings per Share ($MM) Diluted Shares Outstanding 728M 792M 825M812M 826M 1. Marina Bay Sands opened in April 2010. 2. Sands Cotai Central opened in April 2012. 3. Reflects the simple average of the diluted shares outstanding for the four component quarters. The Strength and Consistency of our Convention-Based Integrated Resort Business Model is Reflected in our Financial Results 808M 30 804M³
  • 31. $472 $447 $445 $500 $500 $500 $125 $830 $192 $75 $100 $210 $390 $825 $960 $200 $190 $475 $100 $107 $1,449 $898 $1,179 $2,025 $1,560 $700 $0 $500 $1,000 $1,500 $2,000 $2,500 $3,000 2012A 2013A 2014A 2015E 2016E 2017E Maintenance Investments in Current Properties¹ Sands Cotai Central The Parisian Macao² St. Regis at SCC Other Capital Expenditures Expectations Future Investments Include The Parisian Macao, St. Regis at SCC and Maintenance Future Capital Expenditures Focused on Growth in Asia ($MM) 1. Reflects investments that will generate future income in our current property portfolio (including the Four Seasons Apart-Hotel and a third gaming area at Sands Cotai Central). 2. The timing of capex is subject to the receipt of timely government approvals. Sands Cotai Central The Parisian Macao2 St. Regis at Sands Cotai Central LVS Capex Expectations Development Timeline Pre-Opening Post-Opening 31 $40 $49 $60 $19
  • 32. 180 418 979 1,192218 1,105 1,808 883 2,115 $73 $97 $327 $1,520 $2,118 $5,115 $0 $1,000 $2,000 $3,000 $4,000 $5,000 $6,000 2015 2016 2017 2018 2019 2020 SCL MBS USRG LVSC Debt Maturity Profile Debt Maturity by Year at March 31, 2015 ¹ Long Term and Low Cost Financing in Place ($MM) 1% 1% 16%% of Total 4% 23% 55% 321. Does not reflect the $1 billion new term loan at SCL under its existing credit facility. Funding is expected to be on or around April 30, 2015. On a proforma basis reflecting the loan, $1,595 million would be due in 2018, $2,293 million would be due in 2019, $5,525 million would be due in 2020 and $340 million would be due in 2021.
  • 33. $70 $208 $285 $361 $510 $561 $656 $780 $822 $896 $1,045$1,087$1,059$1,120$1,016$1,068$1,028 $984 $1,001$1,011 0.0% 8.4% 9.6% 12.9% 11.3% 14.6% 18.2% 19.8% 23.4% 26.8% 26.7% 27.8% 30.3% 32.0% 37.2% 37.5% 40.9% 41.9% 40.0% 37.6% 0.0% 10.0% 20.0% 30.0% 40.0% 50.0% $0 $300 $600 $900 $1,200 2Q10 3Q10 4Q10 1Q11 2Q11 3Q11 4Q11 1Q12 2Q12 3Q12 4Q12 1Q13 2Q13 3Q13 4Q13 1Q14 2Q14 3Q14 4Q14 1Q15 Gross Casino A/R Balance at End of Period Reserve Against Casino A/R Balance $40 $146 $203 $250 $271 $345 $314 $418 $311 $317 $378 $368 $408 $342 $403 $326 $361 $281 $272 $291 $0 $75 $150 $225 $300 $375 $450 2Q10 3Q10 4Q10 1Q11 2Q11 3Q11 4Q11 1Q12 2Q12 3Q12 4Q12 1Q13 2Q13 3Q13 4Q13 1Q14 2Q14 3Q14 4Q14 1Q15 MBS – Credit Collections Remain Healthy Reserve Balance Of $380 Million Represents 37.6% of Gross A/R 33 ($MM) Reserve Balance Of $380 Million Represents 37.6% of Gross Accounts Receivable Casino Credit Collections Remain Stable $0 Quarterly Provision $17M $24M $37M $32M $40M $40M$11M$19M$10M Life to Date Provision of $572 Million Represents 9.6% of Rolling Win Since Opening of Property $38M $39M $37M $39M $36M $36M $33M $30M $30M $24M
  • 34. $293 $281 $225 $252 $519 $533 $0 $100 $200 $300 $400 $500 $600 $700 1Q14 1Q15 Baccarat Non-Baccarat $79.7 $74.1 $97.3 $89.2 20.8% 19.7% 24.1% 22.6% 0% 10% 20% 30% 40% $0 $20 $40 $60 $80 $100 $120 1Q14 1Q15 1Q14 1Q15 Las Vegas Operations 34 Composition of Table Games Drop  Adjusted property EBITDA was $74.1 million, a decrease of 7.0% — On a hold-normalized basis, adjusted property EBITDA was $89.2 million, a decrease of 8.4%  ADR increased 1.2% to $244 with 86.2% occupancy, RevPAR decreased 1.9% to $210  Table games drop increased 2.8% to $533.1 million driven by a 12.0% increase in non-Baccarat drop  Slot win increased 8.5% to $44.1 million Best opportunities for future growth: — High-end Asian gaming growth — Increase in group room pricing in 2015 — Non-gaming amenities ($MM) Adjusted Property EBITDA and Adjusted Property EBITDA Margin Best Opportunity for Future Growth in Group Room Business and Baccarat Actual ($MM) Hold-Normalized
  • 35. $116 $125 $132 $139 $248 $263 $0 $100 $200 $300 1Q14 1Q15 Baccarat Non-Baccarat $26.5 $29.9 22.6% 23.4% 0% 10% 20% 30% 40% $0 $5 $10 $15 $20 $25 $30 $35 1Q14 1Q15 Sands Bethlehem Operations Record Quarter for Leading Tri-State Region Property 35  Adjusted property EBITDA increased 12.8% to a first quarter record $29.9 million  Table games drop increased 6.4% to reach $263.4 million, driven by a 7.8% increase in Baccarat drop  Slot handle increased 6.0% to $1.01 billion  ADR increased 2.1% to $149 with occupancy of 84.5%, RevPAR increased 24.8% to $126  The Outlets at Sands Bethlehem (130,000 SF) feature 29 stores including Coach, Tommy Hilfiger, DKNY, GUESS, European Body Concepts Day Spa and Joli French Bakery and Cafe  The Sands Bethlehem Event Center (50,000 SF) — Headline events have included Tiesto, Yes, Willie Nelson, The Beach Boys, Incubus, Bellator MMA, Glenn Frey, Crosby, Stills and Nash, NBC Fight Night, Diana Krall and Bill Maher ($MM) ($MM) Adjusted Property EBITDA and Adjusted Property EBITDA Margin Composition of Table Games Drop
  • 36. Macao Market Background and Infrastructure Slides
  • 37. $16,146 $23,181 $39,327 $0 $5,000 $10,000 $15,000 $20,000 $25,000 $30,000 $35,000 $40,000 $45,000 Gross Gaming Revenue Mass Tables and Slots VIP Gaming 41% 74% 59% 26% 0% 20% 40% 60% 80% 100% Gross Gaming Revenue Operating Profit Mass Tables and Slots VIP Gaming TTM 1Q15 Macao Market Gross Gaming Revenue VIP Gaming Represents 59% of Total Macao GGR… …but Mass Tables and Slots Generate ~74% of Gaming Operating Profit ($MM) Composition of Macao Market Gross Gaming Revenue and Est. Gaming Operating Profit2 Source: Macao DICJ 1. In the first quarter of 2015, the mass table segment decreased 27.1% and the slot business decreased 26.3% compared to the first quarter of 2014. 2. This presentation reflects an assumed operating profit margin of 10.0% on gross VIP revenue and a blended margin of 40% on mass table and slot gross revenue. Mass Gaming Generates 41% of the Gaming Revenue, but ~74% of the Gaming Operating Profit 37 1Q15 YoY Growth -37% -42% -27%1 ~1.8X
  • 38. $3,580 $4,670 $6,123 $6,960 $6,459 $2,446 $2,637 $2,985 $2,661 $2,318 $6,026 $7,307 $9,108 $9,621 $8,777 $0 $2,000 $4,000 $6,000 $8,000 $10,000 $12,000 2011 2012 2013 2014 TTM 1Q15 Mass Tables, Slots and ETGs VIP Tables Macao Market VIP and Mass Gaming Estimated Operating Profit 1,2 The Mass Business Remains the Principal Profit Pool and the Primary Driver of Earnings Growth in Macao ($MM) Source: Macao DICJ 1. This presentation reflects an assumed operating profit margin of 10.0% on gross VIP revenue and a blended margin of 40% on mass table and slot gross revenue. 2. The percentages presented in parentheses represent the % of total operating profit for the period. The Mass Business is the Primary Driver of Gaming Profit in Macao 38 (59%) (64%) (67%) (72%)(41%) (36%) (33%) (28%) (XX%) = % of total operating profit for period (74%) (26%)
  • 39. $2,084 $2,409 $3,355 $4,358 $4,952 $6,587 $8,949 $11,674 $15,309 $17,400 $16,146 $4,648 $3,394 16% 39% 30% 14% 33% 36% 30% 31% 14% -2% -10% 0% 10% 20% 30% 40% 50% 60% $0 $2,000 $4,000 $6,000 $8,000 $10,000 $12,000 $14,000 $16,000 $18,000 $20,000 2005 2006 2007 2008 2009 2010 2011 2012 2013 2014 TTM 1Q15 1Q14 1Q15¹ Mass Table and Slot GGR Year-over-Year Growth Macao Base Mass Business Remains More Resilient Than Premium Mass in the Current Challenging Environment 39 Macao Mass Table and Slot Gross Gaming Revenue ($MM) Source: Macao DICJ 1. In the first quarter of 2015, the mass table segment decreased -27.1% and the slot business decreased -26.3% compared to the first quarter of 2014. Strong Historical Growth in Mass, Recent Headwinds Especially at the High-End of the Mass Segment
  • 40. Five Trends that Should Contribute To Growth in the Macao Market In The Future 1 2 3 4 5 200 million Chinese are expected to travel outside of China by 2020, compared to 83 million in 2012 and 97 million in 2013 Infrastructure and transportation connectivity throughout China, especially in the Pearl River Delta region, will be meaningfully expanded Increasing length of stay in Macao Hengqin Island will contribute to Macao’s diversification and to its further development as a business and leisure tourism destination Over 12,000 new hotel rooms will open in Macao by 2018 Sources: McKinsey, Ernst & Young, CLSA 40
  • 41. 0% 5% 10% 15% 20% 25% 30% 35% 40% 45% 50% '56 '60 '64 '68 '72 '76 '80 '84 '88 '92 '96 '00 '04 '08 '12 $4 $8 $11 $14 $15 $22 $30 $44 $55 $70 $102 $120 5 5 9 12 20 31 41 48 57 73 83 97 108 119 132 147 163 180 200 $138 $157 $179 $205 $234 $268 $306 0 50 100 150 200 250 300 350 '95 '97 '99 '01 '03 '05 '07 '09 '11 '13 '15 '17 '19 Outbound Travel from China China Is The World’s Largest and Fastest Growing Outbound Tourism Market 41 Outbound Travel Penetration¹ Wealth Generation and Increased Mobility in China Have Driven Strong Growth in Outbound Trips and Tourism Spend, And Comparative Outbound Travel Penetration Rates Show a Meaningful Opportunity for Continued Long-Term Growth Expenditure (US$bn) Chinese outbound tourists (millions) CLSA estimates Source: CLSA, UNWTO 1. Outbound travel penetration is defined as total departures by residents as a percentage of the respective country’s population. 1 China Japan Taiwan Korea 2009-2013 2012-2020 Expenditure 27.2% 14.3% Tourists 16.1% 10.9% CAGR 44.5% 27.5% 14.5% 6.1%
  • 42. $1.1 $1.2 $1.2 $1.3 $1.4 $2.3 $2.5 $4.0 $10.0 $12.8 $- $5 $10 $15 France Brazil Mexico Germany Russia Japan Indonesia USA China India Chinese Middle Class Consumption Growth Chinese Middle Class Consumption in 2030 is Projected to Reach $10.0 trillion 42 Global Middle Class Consumption in 2030 (US$ trillion) NOTE: Brookings Institution defines the global middle class as those households with daily expenditures between $10 and $100 per person in purchasing power parity terms. Source: Brookings Institution; UN; World Bank; Financial Times. Continued Growth of the Chinese Middle Class Will Drive Macao Mass Tourism Opportunity 1 (US$ trillion)
  • 43. Twelve Months Ended February 28, Population GDP Per Penetration Province 2014 2015 % Change (MM) Capita (US$) Rate Guangdong 8,317,884 9,160,041 +10% 104 $9,452 8.8% Fujian 783,432 916,013 +17% 37 $9,342 2.5% Hunan 668,484 772,130 +16% 66 $5,936 1.2% Zhejiang 652,932 697,980 +7% 54 $11,054 1.3% Hubei 567,318 685,640 +21% 58 $6,881 1.2% Jiangsu 523,927 583,640 +11% 79 $12,047 0.7% Shanghai 544,361 543,891 -0.1% 23 $14,547 2.4% Henan 381,666 518,693 +36% 94 $5,518 0.6% Guangxi 409,971 518,457 +26% 46 $4,939 1.1% Jiangxi 376,265 467,015 +24% 45 $5,130 1.0% Sichuan 379,725 403,849 +6% 80 $5,240 0.5% Beijing 368,546 378,296 +3% 20 $15,051 1.9% Hebei 259,681 347,888 +34% 72 $6,251 0.5% Liaoning 303,854 342,504 +13% 44 $9,961 0.8% Heilongjiang 251,611 309,565 +23% 38 $6,057 0.8% Shandong 274,265 309,456 +13% 96 $9,094 0.3% Chongqing 228,142 264,793 +16% 30 $6,910 0.9% All Other 3,761,812 4,196,808 +12% 407 N/A 1.0% Subtotal (Excluding Guangdong) 10,735,992 12,256,618 +14% 1,288 $6,617 1.0% Mainland China 19,053,876 21,416,659 +12% 1,392 $6,767 1.5% 43 NOTE: Penetration rates assume that each visitor to Macao from Mainland China is a unique visitor. Source: Macao DSEC; National Bureau of Statistics of China; LVS Estimates Year-Over-Year Visitation Growth Mainland Chinese Visitation to Macao Greater than 20% Data Not Available-10%- 0% 0% - 10% 10%- 20% Xinjiang Tibet Qinghai Sichuan Chongqing Henan Hubei Shanxi Hebei Shandong Beijing Liaoning Jilin Heilongjiang Jiangsu Anhui Hunan Jiangxi Zhejiang Guangxi Guizhou Yunnan Ningxia Shaanxi Inner Mongolia Gansu Guangdong Fujian Shanghai Tianjin Hong Kong Macao Strong Growth in Mainland Chinese Visitation to Macao Strongest Growth Realized in Provinces Served by High Speed Rail 1
  • 44. Infrastructure: China’s High-Speed Rail Connecting More of Mainland China to Macao Source: SCMP, LVS, NYT 44 2 China’s Ministry of Railways Plans to Spend Greater than US$100 billion per Year on Rail Development for the Foreseeable Future, and Highlighted Rail Development in the February 2014 Stimulus Plan Beijing – Guangzhou High-Speed Rail  World’s longest high-speed rail route  Covers 2,298km in ~10 hours (compared to 22 hours previously) at a cost of 862 yuan (~US$140) per one way ticket  Provides seamless connection from Northern China to the Macao border via the Guangzhou-Zhuhai Intercity Rail  5 trains in each direction each day Guangzhou – Zhuhai Intercity Rail  Rail line connecting Guangzhou to Zhuhai, where the Gongbei border gate to Macao is located  Guangzhou is the largest city in Guangdong province and is a key economic and transportation hub  Reduces travel time from Guangzhou to Zhuhai from 2+ hours by bus to as short as 60 minutes  Zhuhai station opened in Jan 2013  Future link to Macao Light Rail System  40-45 trains in each direction each day Wuhan – Guangzhou High-Speed Rail  Wuhan is the capital of Hubei Province and one of the most populous cities in Central China with ~10 million people  Wuhan is an important economic and transportation hub in Central China  HSR reduces travel time to Guangzhou from 11 hours by bus to 3.5 hours by train  One of the most successful routes with 75-85 trains in each direction each day Hong Kong Macao
  • 45. Infrastructure: Meaningful Improvements Throughout the Pearl River Delta Region Source: World Bank, China Daily, Chinatrainguide.com, Analyst reports. Note: population and GDP data from 2013. 45 Guangzhou Population: 13M GDP Per Capita: US$14,000 Macao Population: 0.6M GDP Per Capita: US$91,300 Hengqin Island • Special economic area • Over $20B of overall investment • Over 10,000 hotel rooms • First phase of Chimelong theme park opened in Jan. 2014 and expected to attract 20M visitors annually at completion of all phases Hong Kong Population: 7.2M GDP Per Capita: US$38,000 Hong Kong-Macao-Zhuhai Bridge (expected completion TBD) Wuhan – Guangzhou High-Speed Rail • 3.5 hour train ride • 75-80 trains in each direction per day Shenzhen Population: 10M GDP Per Capita: US$22,000China Border Gate Expansion • Daily capacity increased from 150,000 to 350,000 people in 2H13 • Reduced average wait times on China side of border Guangzhou – Zhuhai Intercity Rail • 70 - 90 minute train ride (2+ hours by bus) • 25 - 35 trains in each direction per day • Final link to Gongbei border gate completed in January 2013 Guangzhou – Shenzhen – Hong Kong Rail • 2 hour train ride from Guangzhou to Hong Kong • 25 trains in each direction per day Infrastructure Legend Existing Future Gongbei – Hengqin Railway • Connects the Gongbei border crossing with Hengqin Island • Stops at Lotus Bridge crossing and ends at Chimelong theme park • Expected completion 2017 2
  • 46. 5.2 6.3 7.3 8.1 8.9 9.7 0.0 2.0 4.0 6.0 8.0 10.0 12.0 2009 2010 2011 2012 2013 2014 5.8 6.9 8.8 8.8 9.7 11.5 0.0 2.0 4.0 6.0 8.0 10.0 12.0 14.0 2009 2010 2011 2012 2013 2014 Mainland China Day-Trip Visitors to Macao Mainland China Overnight Visitors to Macao Chinese Day-Trip and Overnight Visitation To Macao Both Continue to Grow (MM) Source: Macao DSEC 46 -9% +19% +28% 0% (MM) Growth -1% +22% +16% +10%Growth Chinese Visitation Continues to Grow and Additional Hotel Capacity and Transportation Infrastructure will Enhance Overnight Visitation Growth to Macao in the Future +10% +10% 3 +19% +9%
  • 47. 11.0 13.2 16.2 16.9 18.6 21.3 18.0 22.7 28.1 34.9 40.7 47.2 0.0 5.0 10.0 15.0 20.0 25.0 30.0 35.0 40.0 45.0 50.0 Mainland China Visitation to Macao and Hong Kong Visitation to Macao Can Meaningfully Grow 47.2 Million Residents of Mainland China Visited Hong Kong in 2014 (MM) Source: Macao DSEC; Hong Kong Tourism Board 47 -5% +20% +22% +5%Macao +6%Hong Kong +26% +24% +24% Robust Transportation Infrastructure, 74,000 Hotel Rooms and World-Class Dining and Shopping Amenities Enabled 47.2 Million Mainland Chinese Visitors to Travel to Hong Kong in 2014 In 2014 Hong Kong Received 25.9M More Visitors from China than Macao 2009 2010 2011 2012 2013 +10% +17% 3 Macao Hong Kong 2014 +14% +16%
  • 48. 19.5 64.9 0.0 10.0 20.0 30.0 40.0 50.0 60.0 70.0 2.0 3.4 0.0 0.5 1.0 1.5 2.0 2.5 3.0 3.5 4.0 (Days) Total 2014 Mainland Chinese Visitor Nights¹ (MM)(MM) Daytrip Visitors Opportunity for Increased Overnight Visitation and Length of Stay In Macao 48 1. Calculated as total overnight visitors from Mainland China multiplied by average length of stay for Mainland overnight visitors in each market for 2014. Hong Kong has not yet released their 2014 average length of stay figure, so the 3.4 average length of stay presented reflects the 2013 figure. Source: Macao DSEC, Hong Kong Tourism Board Composition of 2014 Visitation from Mainland China Mainland Visitors Spent 64.9 Million Visitor Nights in Hong Kong in 2014 Compared to Just 19.5 Million Visitor Nights Spent in Macao Overnight Visitors Avg. Length of Stay for Mainland Chinese Overnight Visitors in 2014 Macao Hong Kong 3 11.5 9.7 28.2 19.1 0.0 5.0 10.0 15.0 20.0 25.0 30.0
  • 49. Hengqin Island Expands Critical Mass of Tourism Offerings for Visitors to the Region 49 Map of Hengqin Island New Area Important Facts  Island adjacent to Macao (3X the size of Macao) that has been welcomed by President Xi Jinping as a strategic zone for cooperation among Guangdong Province, Hong Kong and Macao  Master-planned island with greater than US$20 billion of investment focused on tourism development, industrial and technological innovation and education  One of three current “New Area” reform zones in China — Support from the Central Government to enable long term success — Empowerment to have broad flexibility on economic and legal matters  Designed to contribute to the diversification of Macao — US$3.2 billion Chimelong International Ocean Resort opened January 28, 2014 and is expected to generate 20 million visits in the future after completion of all phases¹ — Hengqin’s central business district will feature a 1.2 million square foot convention center — More than 10,000 hotel rooms expected to open over the next five years Source: Macau Daily, Zhuhai Daily, Chimelong Group, Hengqin New Area Administrative Committee 1. Phase 1 currently includes the Hengqin Bay Hotel, the Ocean Kingdom theme park, the Circus World show and a waterpark in the Hengqin Bay Hotel. The theme park received over 8 million visitors in 2014, with over 500,000 visitors during the 2014 Chinese New Year holiday. 4
  • 50. SandsCotai Central 5,723 The VenetianMacao 2,905 Sands Macao,289 GalaxyMacau 2,250 Grand Waldo,550 Starworld,509 Cityof Dreams 1,461 AltiraMacau, 216 WynnMacau 1,014 Grand Lisboa,431 Sofitel Macau,408 MGM Grand,587 9,277 3,309 1,677 1,014 839 587 0 1,000 2,000 3,000 4,000 5,000 6,000 7,000 8,000 9,000 10,000 Sands China Galaxy Entertainment Melco Crown Wynn Resorts SJM Holdings² MGM China Hotel % of Gaming % of Total Gaming Operator Rooms Operators Market Sands China 9,277 56% 38% Galaxy Entertainment 3,309 20% 14% Melco Crown 1,677 10% 7% Wynn Resorts 1,014 6% 4% SJMHoldings² 839 5% 4% MGMChina 587 4% 2% Subtotal Gaming Operators 16,703 100% 68% Other 4/5 Star 7,537 0% 32% Total 24,240 100% 100% Market Leading Hotel Capacity at SCL Sands China Operates 38% of Macao’s Current 4/5-Star Hotel Inventory 1. In addition to the hotel rooms that are owned by gaming operators presented here, there are 7,537 additional four- and five-star hotel rooms in Macao. 2. Reflects only SJM Holdings self-owned hotels. Source: Company filings, Macao DSEC 50 With a Market-Leading US$9 billion of Investment, SCL Hotel Inventory Represents 56% of Macao Competitor Hotel Inventory Macao Market Gaming Operator Hotel Rooms1 Four Seasons Macao, 360 5 `
  • 51. SandsCotai Central 5,723 The VenetianMacao 2,905 Sands Macao,289 The Parisian Macao 3,000 GalaxyMacau 2,250 Grand Waldo, 550 Starworld,509 GalaxyMacau Phase II 1,350 Cityof Dreams 1,461 AltiraMacau, 216 Macau StudioCity 1,600 Grand Lisboa, 431 Sofitel Macau, 408 SJMCotai 2,000 WynnMacau, 1,014 WynnCotai 1,700 MGM Grand,587 MGM Cotai 1,600 12,677 4,659 3,277 2,839 2,714 2,187 0 2,000 4,000 6,000 8,000 10,000 12,000 14,000 Sands China Galaxy Entertainment Melco Crown SJM Holdings² Wynn Resorts MGM China Hotel % of Gaming % of Total Gaming Operator Rooms Operators Market Sands China 12,677 45% 35% Galaxy Entertainment 4,659 16% 13% Melco Crown 3,277 12% 9% SJMHoldings² 2,839 10% 8% Wynn Resorts 2,714 10% 8% MGMChina 2,187 8% 6% Subtotal Gaming Operators 28,353 100% 78% Other 4/5 Star 7,773 0% 22% Total 36,126 100% 100% 1. In addition to the hotel rooms that are owned by gaming operators presented here, there will be approximately 7,773 additional four- and five-star hotel rooms in Macao. 2. Reflects only SJM Holdings self-owned hotels. Source: Company filings, Macao DSEC 51 Macao Market Gaming Operator Hotel Rooms at December 31, 20171 Four Seasons Macao, 360 St. Regis Macao, 400 5 ` With a Market-Leading US$13 billion of Investment, SCL Hotel Inventory Will Represent 45% of Macao Competitor Hotel Inventory Market Leading Hotel Capacity at SCL Projected Macao Market 4/5 Star Hotel Rooms at December 31, 2017
  • 53. $7.8 $5.3 $1.3 $14.4 $2.5 $16.9 $5.8 $4.4 $0.7 $10.8 $2.0 $12.8 $0.0 $5.0 $10.0 $15.0 $20.0 Venetian Macao Sands Cotai Central Plaza Casino (Four Seasons) Total Cotai Strip Sands Macao Total Macao Ops 1Q14 1Q15 Mass Table, Slot and ETG Win Per Day ($MM) SCL’s Mass Gaming Segment Impacted by Headwinds… Especially at the High-End of the Mass Market 53 Cotai Strip Properties Peninsula Total Mass Tables 494 394 95567 236 1,191 Slots ETGs 1,443 1,042 2,624139 544 3,168 668 667 1,3438 375 1,718 1Q15 Average Table, Slot and ETG Units
  • 54. $867 $930 $1,061 $1,219 $1,337 $1,249 $1,218 $1,106 $1,013 28.8% 29.9% 29.8% 30.5% 31.6% 30.5% 30.0% 32.4% 31.0% 0% 5% 10% 15% 20% 25% 30% 35% 40% 45% 50% 55% 60% $0 $200 $400 $600 $800 $1,000 $1,200 $1,400 $1,600 1Q13 2Q13 3Q13 4Q13 1Q14 2Q14 3Q14 4Q14 1Q15 Mass Table Win % of Macao Mass Table Win $10,204 $10,190 $10,961 $12,143 $13,210 $11,963 $11,518 $10,469 $9,447 $0 $2,000 $4,000 $6,000 $8,000 $10,000 $12,000 $14,000 $16,000 1Q13 2Q13 3Q13 4Q13 1Q14 2Q14 3Q14 4Q14 1Q15 Mass Table Win Mass Table Win per Table per Day2 54 ($MM) 1,191 Avg. Tables 1,124 The Mass Business Continues to Face Headwinds, Particularly at the “High-End” of Mass Source: Macao DICJ 1. LVS’s mass table market share as presented above reflects the Macao DICJ’s presentation methodology, which includes live dealer ETG configurations within the mass table segment and Paiza cash revenue within the VIP segment. For financial reporting purposes, LVS presents a non-rolling table segment (which includes Paiza cash and excludes all ETGs) and a slot segment (which includes all ETGs). 2. Excludes revenue from all ETGs. SCL: Mass Table Segment Mass Business in Macao is Facing Headwinds (Particularly at the “High-End” of Mass) 1 944
  • 55. $149 $149 $166 $174 $184 $178 $176 $157 $136 29.6% 30.1% 32.6% 32.7% 32.2% 32.5% 31.5% 32.9% 31.4% 0% 10% 20% 30% 40% 50% 60% $0 $20 $40 $60 $80 $100 $120 $140 $160 $180 $200 $220 1Q13 2Q13 3Q13 4Q13 1Q14 2Q14 3Q14 4Q14 1Q15 Slot & ETG Win % of Macao Market Slot Win $283 $285 $327 $353 $388 $401 $424 $362 $310 $0 $50 $100 $150 $200 $250 $300 $350 $400 $450 $500 1Q13 2Q13 3Q13 4Q13 1Q14 2Q14 3Q14 4Q14 1Q15 Macao Slot and ETG Win Macao Slot and ETG Win per Unit per Day 55 ($MM) 4,885 Avg. Units 5,277 Slot Business Soft, Particularly at High-End, with Electronic Table Games Showing More Resilience Source: Macao DICJ 1. LVS’s slot market share as presented above reflects the Macao DICJ’s slot revenue reporting methodology, which excludes ETG play. Live dealer ETG configurations are reported within the mass table segment. For financial reporting purposes, LVS presents a non-rolling table segment (which excludes all ETGs) and a slot segment (which includes all ETGs). SCL: Slot and ETG Segment Slot Business Facing Headwinds…Particularly at “High End” 1 5,843
  • 56. $1,223 $1,184 $1,303$1,327 $1,445 $1,117 $1,019 $838 $592 17.2% 16.8% 18.4% 16.9% 18.3% 16.8% 17.9% 15.6% 14.6% 0% 5% 10% 15% 20% 25% 30% $0 $200 $400 $600 $800 $1,000 $1,200 $1,400 $1,600 1Q13 2Q13 3Q13 4Q13 1Q14 2Q14 3Q14 4Q14 1Q15 Rolling Win % of Macao Market Rolling Win $26,269 $24,763 $30,365 $32,837 $39,167 $32,568 $29,893 $24,084 $19,012 $0 $5,000 $10,000 $15,000 $20,000 $25,000 $30,000 $35,000 $40,000 $45,000 1Q13 2Q13 3Q13 4Q13 1Q14 2Q14 3Q14 4Q14 1Q15 Rolling Win per Table per Day 56 Rolling Win 346Avg. Tables 410 Declining Segment Contributed Less Than 15% of Operating Profit in the TTM Period Ending March 31, 2015 ($MM) SCL: VIP Rolling Segment VIP Segment in Macao Continues to Decline 2.81%3.18%Rolling Win % 5172.97%
  • 57. Department TTM 1Q14 TTM 1Q15 YoY Growth (%) Departmental Profit Margin Range Retail Mall $346 $398 15% 85%+ Hotel 584 635 9% 75% - 80% Convention, F&B, Entertainment & Other 492 514 4% Varies Base Mass 2,583 2,657 3% 40% - 50% Slots 673 647 -4% 40% - 50%+ Premium Mass 1,963 1,930 -2% 25% - 40% VIP Gaming 5,260 3,566 -32% ~10% Adj. Property EBITDA from Macao Property Operations Hold Normalized Adj. Prop. EBITDA from Macao Prop. Operations -14% Gross Revenue (US$MM) $3,217 $2,849 -11% $3,173 $2,739 Macao Annual Operating Performance Most Diversified and Defensive Cash Flows in the Macao Market 57 SCL Departmental Revenue and Profit Margins – TTM 1Q15 vs TTM 1Q14 SCL Continues to Focus on the High-Margin Non-Gaming and Mass Segments 1 1. Hold-Normalized Adjusted Property EBITDA from Macao Property Operations represents the sum of the hold-normalized figures from the four quarters ended March 31.
  • 58. Department Quarter Ended 3/31/2014 Quarter Ended 3/31/2015 YoY Growth (%) Departmental Profit Margin Range Retail Mall $70 $87 25% 85%+ Hotel 165 148 -10% 75% - 80% Convention, F&B, Entertainment & Other 125 114 -8% Varies Base Mass 757 601 -21% 40% - 50% Slots 184 136 -26% 40% - 50%+ Premium Mass 580 412 -29% 25% - 40% VIP Gaming 1,445 592 -59% ~10% Adj. Property EBITDA from Macao Property Operations Hold Normalized Adj. Prop. EBITDA from Macao Prop. Operations Gross Revenue (US$MM) $940 $528 -44% $865 $528 -39% Macao First Quarter Operating Performance Most Diversified and Defensive Cash Flows in the Macao Market 58 SCL Departmental Revenue and Profit Margins – Quarter Ended 3/31/2015 vs 3/31/2014 SCL Continues to Focus on the High-Margin Non-Gaming and Mass Segments
  • 59. $40 $49 $198 $576 $593 $688 $817 $1,030 $1,381 $1,626 $1,615 $0 $500 $1,000 $1,500 $2,000 2005 2006 2007 2008 2009 2010 2011 2012 2013 2014 TTM 1Q15 Non-Gaming Revenue (US$MM) Macao Annual Non-Gaming Revenue Most Diversified and Defensive Cash Flows in the Macao Market 59 ($MM) SCL Gross Non-Gaming Revenue SCL’s High-Margin Non-Gaming Revenue Has Remained Strong Despite Headwinds in the Gaming Segments