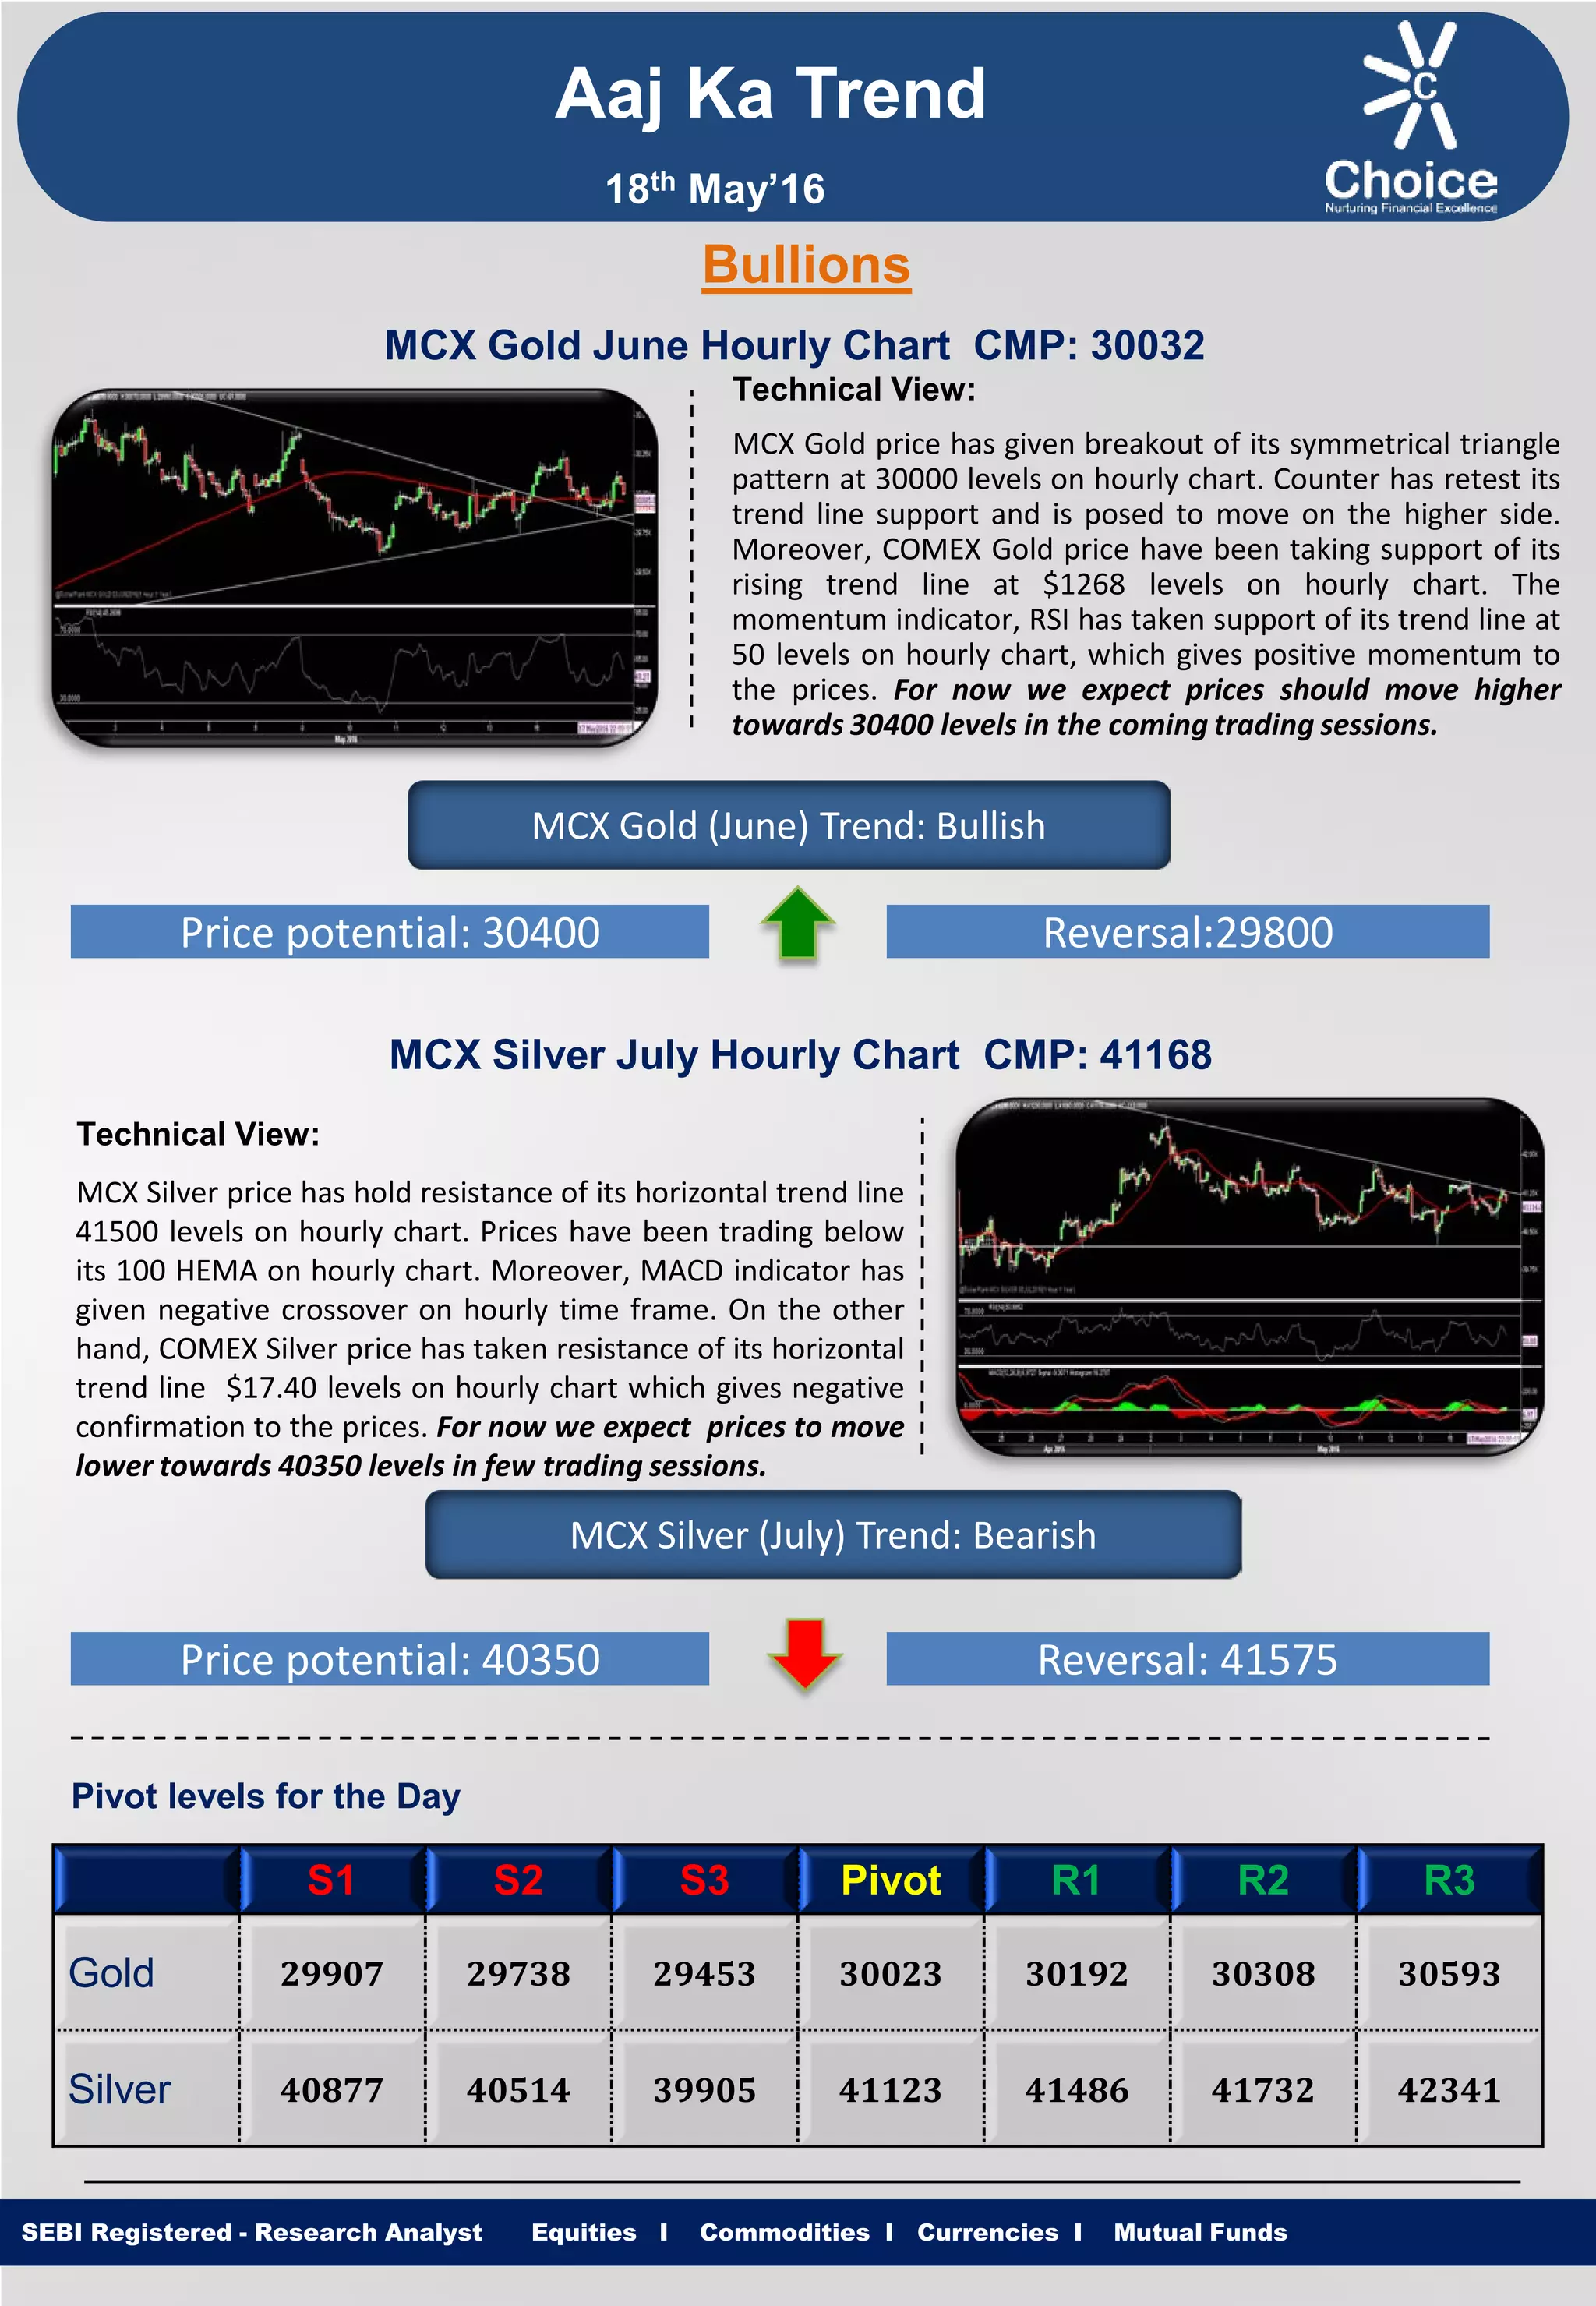
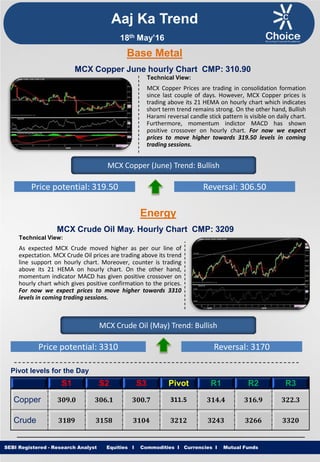
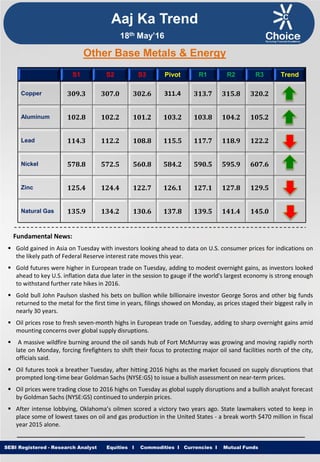
Equities I Commodities I Currencies I Mutual Funds
Aaj Ka Trend
Technical View:
MCX Gold price has given breakout of its symmetrical triangle
pattern at 30000 levels on hourly chart. Counter has retest its
trend line support and is posed to move on the higher side.
Moreover, COMEX Gold price have been taking support of its
rising trend line at $1268 levels on hourly chart. The
momentum indicator, RSI has taken support of its trend line at
50 levels on hourly chart, which gives positive momentum to
the prices. For now we expect prices should move higher
towards 30400 levels in the coming trading sessions.
SEBI Registered - Research Analyst Equities I Commodities I Currencies I Mutual Funds
Bullions
MCX Gold June Hourly Chart CMP: 30032
MCX Gold (June) Trend: Bullish
Price potential: 30400 Reversal:29800
MCX Silver July Hourly Chart CMP: 41168
Technical View:
MCX Silver price has hold resistance of its horizontal trend line
41500 levels on hourly chart. Prices have been trading below
its 100 HEMA on hourly chart. Moreover, MACD indicator has
given negative crossover on hourly time frame. On the other
hand, COMEX Silver price has taken resistance of its horizontal
trend line $17.40 levels on hourly chart which gives negative
confirmation to the prices. For now we expect prices to move
lower towards 40350 levels in few trading sessions.
MCX Silver (July) Trend: Bearish
Price potential: 40350 Reversal: 41575
Pivot levels for the Day
S1 S2 S3 Pivot R1 R2 R3
Gold 29907 29738 29453 30023 30192 30308 30593
Silver 40877 40514 39905 41123 41486 41732 42341
18th May’16
Equities I Commodities I Currencies I Mutual Funds
Technical View:
MCX Copper Prices are trading in consolidation formation
since last couple of days. However, MCX Copper prices is
trading above its 21 HEMA on hourly chart which indicates
short term trend remains strong. On the other hand, Bullish
Harami reversal candle stick pattern is visible on daily chart.
Furthermore, momentum indictor MACD has shown
positive crossover on hourly chart. For now we expect
prices to move higher towards 319.50 levels in coming
trading sessions.
SEBI Registered - Research Analyst Equities I Commodities I Currencies I Mutual Funds
MCX Copper June hourly Chart CMP: 310.90
MCX Copper (June) Trend: Bullish
Price potential: 319.50 Reversal: 306.50
MCX Crude Oil May. Hourly Chart CMP: 3209
Technical View:
As expected MCX Crude moved higher as per our line of
expectation. MCX Crude Oil prices are trading above its trend
line support on hourly chart. Moreover, counter is trading
above its 21 HEMA on hourly chart. On the other hand,
momentum indicator MACD has given positive crossover on
hourly chart which gives positive confirmation to the prices.
For now we expect prices to move higher towards 3310
levels in coming trading sessions.
MCX Crude Oil (May) Trend: Bullish
Price potential: 3310 Reversal: 3170
Pivot levels for the Day
S1 S2 S3 Pivot R1 R2 R3
Copper 309.0 306.1 300.7 311.5 314.4 316.9 322.3
Crude 3189 3158 3104 3212 3243 3266 3320
Base Metal
Energy
Aaj Ka Trend
18th May’16
Equities I Commodities I Currencies I Mutual FundsSEBI Registered - Research Analyst Equities I Commodities I Currencies I Mutual Funds
Other Base Metals & Energy
S1 S2 S3 Pivot R1 R2 R3 Trend
Copper 309.3 307.0 302.6 311.4 313.7 315.8 320.2
Aluminum 102.8 102.2 101.2 103.2 103.8 104.2 105.2
Lead 114.3 112.2 108.8 115.5 117.7 118.9 122.2
Nickel 578.8 572.5 560.8 584.2 590.5 595.9 607.6
Zinc 125.4 124.4 122.7 126.1 127.1 127.8 129.5
Natural Gas 135.9 134.2 130.6 137.8 139.5 141.4 145.0
Fundamental News:
 Gold gained in Asia on Tuesday with investors looking ahead to data on U.S. consumer prices for indications on
the likely path of Federal Reserve interest rate moves this year.
 Gold futures were higher in European trade on Tuesday, adding to modest overnight gains, as investors looked
ahead to key U.S. inflation data due later in the session to gauge if the world's largest economy is strong enough
to withstand further rate hikes in 2016.
 Gold bull John Paulson slashed his bets on bullion while billionaire investor George Soros and other big funds
returned to the metal for the first time in years, filings showed on Monday, as prices staged their biggest rally in
nearly 30 years.
 Oil prices rose to fresh seven-month highs in European trade on Tuesday, adding to sharp overnight gains amid
mounting concerns over global supply disruptions.
 A massive wildfire burning around the oil sands hub of Fort McMurray was growing and moving rapidly north
late on Monday, forcing firefighters to shift their focus to protecting major oil sand facilities north of the city,
officials said.
 Oil futures took a breather Tuesday, after hitting 2016 highs as the market focused on supply disruptions that
prompted long-time bear Goldman Sachs (NYSE:GS) to issue a bullish assessment on near-term prices.
 Oil prices were trading close to 2016 highs on Tuesday as global supply disruptions and a bullish analyst forecast
by Goldman Sachs (NYSE:GS) continued to underpin prices.
 After intense lobbying, Oklahoma’s oilmen scored a victory two years ago. State lawmakers voted to keep in
place some of lowest taxes on oil and gas production in the United States - a break worth $470 million in fiscal
year 2015 alone.
Aaj Ka Trend
18th May’16
Equities I Commodities I Currencies I Mutual FundsSEBI Registered - Research Analyst Equities I Commodities I Currencies I Mutual Funds
International Market
Commodity Closing Price
Gold 1279.84
Silver 17.25
Crude Oil 48.33
Brent Crude Oil 49.35
Natural Gas 2.05
COMEX/NYMEX/ICE ( Precious Metals & Energy) Currency & Commodity Index
Currency (Spot) Current Price
USD / INR 66.88
Dollar Index 94.55
EUR / USD 1.1315
CRB Index* 185.85
Closing as on 17.05.16 *Closing as on 17.05.16
LME (Base Metals) ( $ per tones)
Commodity Closing Price
Copper 4657
Aluminum 1545
Zinc 1903.50
Lead 1722
Nickel 8641
SHFE (Base Metals) (Yuan per tones)
Commodity Closing Price
Copper 35630
Aluminum 12210
Zinc 15010
Lead 14750
Closing as on 17.05.16 Closing as on 17.05.16
LME INVENTORY DATA
Aaj Ka Trend
11-May-16 12-May-16 13-May-16 16-May-16 17-May-16
Aluminium -7375 -8900 -4825 -6625 -2050
Copper 725 -1625 -3325 -2350 -2275
Lead -50 750 25 -250 -175
Nickel -690 -6 -1674 -5880 -606
Zinc -875 -1100 -1125 -325 -575
18th May’16
Equities I Commodities I Currencies I Mutual Funds
This is solely for information of clients of Choice Broking and does not construe to be an investment advice. It is also not intended as an offer or solicitation
for the purchase and sale of any financial instruments. Any action taken by you on the basis of the information contained herein is your responsibility alone
and Choice Broking its subsidiaries or its employees or associates will not be liable in any manner for the consequences of such action taken by you. We
have exercised due diligence in checking the correctness and authenticity of the information contained in this recommendation, but Choice Broking or any of
its subsidiaries or associates or employees shall not be in any way responsible for any loss or damage that may arise to any person from any inadvertent
error in the information contained in this recommendation or any action taken on basis of this information. Technical analysis studies market psychology,
price patterns and volume levels. It is used to forecast future price and market movements. Technical analysis is complementary to fundamental analysis
and news sources. The recommendations issued herewith might be contrary to recommendations issued by Choice Broking in the company research
undertaken as the recommendations stated in this report is derived purely from technical analysis. Choice Broking has based this document on information
obtained from sources it believes to be reliable but which it has not independently verified; Choice Broking makes no guarantee, representation or warranty
and accepts no responsibility or liability as to its accuracy or completeness. The opinions contained within the report are based upon publicly available
information at the time of publication and are subject to change without notice. The information and any disclosures provided herein are in summary form
and have been prepared for informational purposes. The recommendations and suggested price levels are intended purely for trading purposes. The
recommendations are valid for the day of the report however trading trends and volumes might vary substantially on an intraday basis and the
recommendations may be subject to change. The information and any disclosures provided herein may be considered confidential. Any use, distribution,
modification, copying, forwarding or disclosure by any person is strictly prohibited. The information and any disclosures provided herein do not constitute a
solicitation or offer to purchase or sell any security or other financial product or instrument. The current performance may be unaudited. Past performance
does not guarantee future returns. There can be no assurance that investments will achieve any targeted rates of return, and there is no guarantee against
the loss of your entire investment.
POTENTIAL CONFLICT OF INTEREST DISCLOSURE (as on date of report) Disclosure of interest statement – • Analyst interest of the stock
/Instrument(s): - No. • Firm interest of the stock / Instrument (s): - No.
Disclaimer
Contact Us
Amit Pathania
Research Associate
amit.pathania@choiceindia.com
Rohan Patil
Research Associate
rohan.patil@choiceindia.com
www.choiceindia.comcustomercare@choiceindia.com
SEBI Registered - Research Analyst Equities I Commodities I Currencies I Mutual Funds
Aaj Ka Trend
18th May’16
Neeraj Yadav
Research Advisor
neeraj.yadav@choiceindia.com
Anish Vyas
Senior Research Associate
anish.vyas@choiceindia.com
Amit Pathania
Digitally signed by Amit Pathania
DN: cn=Amit Pathania, o=Choice Equity Broking Pvt. ltd,
ou=Research Department,
email=amit.pathania@choiceindia.com, c=IN
Date: 2016.05.18 08:42:04 +05'30'

Aaj ka trend 18.05.16

  • 1.
    Equities I CommoditiesI Currencies I Mutual Funds Aaj Ka Trend Technical View: MCX Gold price has given breakout of its symmetrical triangle pattern at 30000 levels on hourly chart. Counter has retest its trend line support and is posed to move on the higher side. Moreover, COMEX Gold price have been taking support of its rising trend line at $1268 levels on hourly chart. The momentum indicator, RSI has taken support of its trend line at 50 levels on hourly chart, which gives positive momentum to the prices. For now we expect prices should move higher towards 30400 levels in the coming trading sessions. SEBI Registered - Research Analyst Equities I Commodities I Currencies I Mutual Funds Bullions MCX Gold June Hourly Chart CMP: 30032 MCX Gold (June) Trend: Bullish Price potential: 30400 Reversal:29800 MCX Silver July Hourly Chart CMP: 41168 Technical View: MCX Silver price has hold resistance of its horizontal trend line 41500 levels on hourly chart. Prices have been trading below its 100 HEMA on hourly chart. Moreover, MACD indicator has given negative crossover on hourly time frame. On the other hand, COMEX Silver price has taken resistance of its horizontal trend line $17.40 levels on hourly chart which gives negative confirmation to the prices. For now we expect prices to move lower towards 40350 levels in few trading sessions. MCX Silver (July) Trend: Bearish Price potential: 40350 Reversal: 41575 Pivot levels for the Day S1 S2 S3 Pivot R1 R2 R3 Gold 29907 29738 29453 30023 30192 30308 30593 Silver 40877 40514 39905 41123 41486 41732 42341 18th May’16
  • 2.
    Equities I CommoditiesI Currencies I Mutual Funds Technical View: MCX Copper Prices are trading in consolidation formation since last couple of days. However, MCX Copper prices is trading above its 21 HEMA on hourly chart which indicates short term trend remains strong. On the other hand, Bullish Harami reversal candle stick pattern is visible on daily chart. Furthermore, momentum indictor MACD has shown positive crossover on hourly chart. For now we expect prices to move higher towards 319.50 levels in coming trading sessions. SEBI Registered - Research Analyst Equities I Commodities I Currencies I Mutual Funds MCX Copper June hourly Chart CMP: 310.90 MCX Copper (June) Trend: Bullish Price potential: 319.50 Reversal: 306.50 MCX Crude Oil May. Hourly Chart CMP: 3209 Technical View: As expected MCX Crude moved higher as per our line of expectation. MCX Crude Oil prices are trading above its trend line support on hourly chart. Moreover, counter is trading above its 21 HEMA on hourly chart. On the other hand, momentum indicator MACD has given positive crossover on hourly chart which gives positive confirmation to the prices. For now we expect prices to move higher towards 3310 levels in coming trading sessions. MCX Crude Oil (May) Trend: Bullish Price potential: 3310 Reversal: 3170 Pivot levels for the Day S1 S2 S3 Pivot R1 R2 R3 Copper 309.0 306.1 300.7 311.5 314.4 316.9 322.3 Crude 3189 3158 3104 3212 3243 3266 3320 Base Metal Energy Aaj Ka Trend 18th May’16
  • 3.
    Equities I CommoditiesI Currencies I Mutual FundsSEBI Registered - Research Analyst Equities I Commodities I Currencies I Mutual Funds Other Base Metals & Energy S1 S2 S3 Pivot R1 R2 R3 Trend Copper 309.3 307.0 302.6 311.4 313.7 315.8 320.2 Aluminum 102.8 102.2 101.2 103.2 103.8 104.2 105.2 Lead 114.3 112.2 108.8 115.5 117.7 118.9 122.2 Nickel 578.8 572.5 560.8 584.2 590.5 595.9 607.6 Zinc 125.4 124.4 122.7 126.1 127.1 127.8 129.5 Natural Gas 135.9 134.2 130.6 137.8 139.5 141.4 145.0 Fundamental News:  Gold gained in Asia on Tuesday with investors looking ahead to data on U.S. consumer prices for indications on the likely path of Federal Reserve interest rate moves this year.  Gold futures were higher in European trade on Tuesday, adding to modest overnight gains, as investors looked ahead to key U.S. inflation data due later in the session to gauge if the world's largest economy is strong enough to withstand further rate hikes in 2016.  Gold bull John Paulson slashed his bets on bullion while billionaire investor George Soros and other big funds returned to the metal for the first time in years, filings showed on Monday, as prices staged their biggest rally in nearly 30 years.  Oil prices rose to fresh seven-month highs in European trade on Tuesday, adding to sharp overnight gains amid mounting concerns over global supply disruptions.  A massive wildfire burning around the oil sands hub of Fort McMurray was growing and moving rapidly north late on Monday, forcing firefighters to shift their focus to protecting major oil sand facilities north of the city, officials said.  Oil futures took a breather Tuesday, after hitting 2016 highs as the market focused on supply disruptions that prompted long-time bear Goldman Sachs (NYSE:GS) to issue a bullish assessment on near-term prices.  Oil prices were trading close to 2016 highs on Tuesday as global supply disruptions and a bullish analyst forecast by Goldman Sachs (NYSE:GS) continued to underpin prices.  After intense lobbying, Oklahoma’s oilmen scored a victory two years ago. State lawmakers voted to keep in place some of lowest taxes on oil and gas production in the United States - a break worth $470 million in fiscal year 2015 alone. Aaj Ka Trend 18th May’16
  • 4.
    Equities I CommoditiesI Currencies I Mutual FundsSEBI Registered - Research Analyst Equities I Commodities I Currencies I Mutual Funds International Market Commodity Closing Price Gold 1279.84 Silver 17.25 Crude Oil 48.33 Brent Crude Oil 49.35 Natural Gas 2.05 COMEX/NYMEX/ICE ( Precious Metals & Energy) Currency & Commodity Index Currency (Spot) Current Price USD / INR 66.88 Dollar Index 94.55 EUR / USD 1.1315 CRB Index* 185.85 Closing as on 17.05.16 *Closing as on 17.05.16 LME (Base Metals) ( $ per tones) Commodity Closing Price Copper 4657 Aluminum 1545 Zinc 1903.50 Lead 1722 Nickel 8641 SHFE (Base Metals) (Yuan per tones) Commodity Closing Price Copper 35630 Aluminum 12210 Zinc 15010 Lead 14750 Closing as on 17.05.16 Closing as on 17.05.16 LME INVENTORY DATA Aaj Ka Trend 11-May-16 12-May-16 13-May-16 16-May-16 17-May-16 Aluminium -7375 -8900 -4825 -6625 -2050 Copper 725 -1625 -3325 -2350 -2275 Lead -50 750 25 -250 -175 Nickel -690 -6 -1674 -5880 -606 Zinc -875 -1100 -1125 -325 -575 18th May’16
  • 5.
    Equities I CommoditiesI Currencies I Mutual Funds This is solely for information of clients of Choice Broking and does not construe to be an investment advice. It is also not intended as an offer or solicitation for the purchase and sale of any financial instruments. Any action taken by you on the basis of the information contained herein is your responsibility alone and Choice Broking its subsidiaries or its employees or associates will not be liable in any manner for the consequences of such action taken by you. We have exercised due diligence in checking the correctness and authenticity of the information contained in this recommendation, but Choice Broking or any of its subsidiaries or associates or employees shall not be in any way responsible for any loss or damage that may arise to any person from any inadvertent error in the information contained in this recommendation or any action taken on basis of this information. Technical analysis studies market psychology, price patterns and volume levels. It is used to forecast future price and market movements. Technical analysis is complementary to fundamental analysis and news sources. The recommendations issued herewith might be contrary to recommendations issued by Choice Broking in the company research undertaken as the recommendations stated in this report is derived purely from technical analysis. Choice Broking has based this document on information obtained from sources it believes to be reliable but which it has not independently verified; Choice Broking makes no guarantee, representation or warranty and accepts no responsibility or liability as to its accuracy or completeness. The opinions contained within the report are based upon publicly available information at the time of publication and are subject to change without notice. The information and any disclosures provided herein are in summary form and have been prepared for informational purposes. The recommendations and suggested price levels are intended purely for trading purposes. The recommendations are valid for the day of the report however trading trends and volumes might vary substantially on an intraday basis and the recommendations may be subject to change. The information and any disclosures provided herein may be considered confidential. Any use, distribution, modification, copying, forwarding or disclosure by any person is strictly prohibited. The information and any disclosures provided herein do not constitute a solicitation or offer to purchase or sell any security or other financial product or instrument. The current performance may be unaudited. Past performance does not guarantee future returns. There can be no assurance that investments will achieve any targeted rates of return, and there is no guarantee against the loss of your entire investment. POTENTIAL CONFLICT OF INTEREST DISCLOSURE (as on date of report) Disclosure of interest statement – • Analyst interest of the stock /Instrument(s): - No. • Firm interest of the stock / Instrument (s): - No. Disclaimer Contact Us Amit Pathania Research Associate amit.pathania@choiceindia.com Rohan Patil Research Associate rohan.patil@choiceindia.com www.choiceindia.comcustomercare@choiceindia.com SEBI Registered - Research Analyst Equities I Commodities I Currencies I Mutual Funds Aaj Ka Trend 18th May’16 Neeraj Yadav Research Advisor neeraj.yadav@choiceindia.com Anish Vyas Senior Research Associate anish.vyas@choiceindia.com Amit Pathania Digitally signed by Amit Pathania DN: cn=Amit Pathania, o=Choice Equity Broking Pvt. ltd, ou=Research Department, email=amit.pathania@choiceindia.com, c=IN Date: 2016.05.18 08:42:04 +05'30'