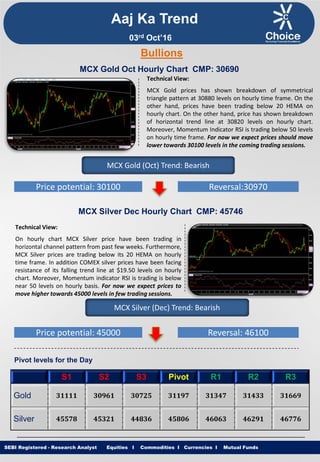
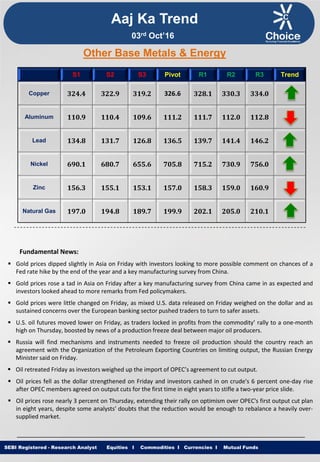
Equities I Commodities I Currencies I Mutual Funds
Aaj Ka Trend
Technical View:
MCX Gold prices has shown breakdown of symmetrical
triangle pattern at 30880 levels on hourly time frame. On the
other hand, prices have been trading below 20 HEMA on
hourly chart. On the other hand, price has shown breakdown
of horizontal trend line at 30820 levels on hourly chart.
Moreover, Momentum Indicator RSI is trading below 50 levels
on hourly time frame. For now we expect prices should move
lower towards 30100 levels in the coming trading sessions.
SEBI Registered - Research Analyst Equities I Commodities I Currencies I Mutual Funds
Bullions
MCX Gold Oct Hourly Chart CMP: 30690
MCX Gold (Oct) Trend: Bearish
Price potential: 30100 Reversal:30970
MCX Silver Dec Hourly Chart CMP: 45746
Technical View:
On hourly chart MCX Silver price have been trading in
horizontal channel pattern from past few weeks. Furthermore,
MCX Silver prices are trading below its 20 HEMA on hourly
time frame. In addition COMEX silver prices have been facing
resistance of its falling trend line at $19.50 levels on hourly
chart. Moreover, Momentum indicator RSI is trading is below
near 50 levels on hourly basis. For now we expect prices to
move higher towards 45000 levels in few trading sessions.
MCX Silver (Dec) Trend: Bearish
Price potential: 45000 Reversal: 46100
Pivot levels for the Day
S1 S2 S3 Pivot R1 R2 R3
Gold 31111 30961 30725 31197 31347 31433 31669
Silver 45578 45321 44836 45806 46063 46291 46776
03rd Oct’16
Equities I Commodities I Currencies I Mutual Funds
Technical View:
On hourly chart MCX Copper has witnessed pullback to its
neck line of Inverted Head & Shoulder formation at 327
levels on hourly time frame. Furthermore, Counter is
trading above its 50 HEMA on hourly chart. Moreover,
momentum indicator MACD has observed positive
crossover on hourly time frame. In addition, Momentum
indicator RSI is trading above 50 levels on hourly basis. For
now we expect prices to move higher towards 334.20
levels in coming trading sessions.
SEBI Registered - Research Analyst Equities I Commodities I Currencies I Mutual Funds
MCX Copper Nov hourly Chart CMP: 325.85
MCX Copper (Nov) Trend: Bullish
Price potential: 334.20 Reversal: 322.20
MCX Crude Oil Oct. Hourly Chart CMP: 3210
Technical View:
MCX Crude Oil prices have witnessed breakout of its Triangle
pattern at 3144 levels on hourly time frame. Furthermore,
Counter is trading above its 20 HEMA on hourly chart.
Looking at ADX, positive directional index (+DMI) is in
domination position with rising average direction index.
Moreover, Momentum indicator RSI is trading above 60
levels on hourly basis. For now we expect prices to move
higher towards 3285 levels in coming trading sessions.
MCX Crude Oil (Oct) Trend: Bullish
Price potential: 3285 Reversal: 3160
Pivot levels for the Day
S1 S2 S3 Pivot R1 R2 R3
Copper 324.4 322.9 319.2 326.6 328.1 330.3 334.0
Crude 3106 3007 2845 3169 3268 3331 3493
Base Metal
Energy
Aaj Ka Trend
03rd Oct’16
Equities I Commodities I Currencies I Mutual FundsSEBI Registered - Research Analyst Equities I Commodities I Currencies I Mutual Funds
Other Base Metals & Energy
S1 S2 S3 Pivot R1 R2 R3 Trend
Copper 324.4 322.9 319.2 326.6 328.1 330.3 334.0
Aluminum 110.9 110.4 109.6 111.2 111.7 112.0 112.8
Lead 134.8 131.7 126.8 136.5 139.7 141.4 146.2
Nickel 690.1 680.7 655.6 705.8 715.2 730.9 756.0
Zinc 156.3 155.1 153.1 157.0 158.3 159.0 160.9
Natural Gas 197.0 194.8 189.7 199.9 202.1 205.0 210.1
Fundamental News:
 Gold prices dipped slightly in Asia on Friday with investors looking to more possible comment on chances of a
Fed rate hike by the end of the year and a key manufacturing survey from China.
 Gold prices rose a tad in Asia on Friday after a key manufacturing survey from China came in as expected and
investors looked ahead to more remarks from Fed policymakers.
 Gold prices were little changed on Friday, as mixed U.S. data released on Friday weighed on the dollar and as
sustained concerns over the European banking sector pushed traders to turn to safer assets.
 U.S. oil futures moved lower on Friday, as traders locked in profits from the commodity’ rally to a one-month
high on Thursday, boosted by news of a production freeze deal between major oil producers.
 Russia will find mechanisms and instruments needed to freeze oil production should the country reach an
agreement with the Organization of the Petroleum Exporting Countries on limiting output, the Russian Energy
Minister said on Friday.
 Oil retreated Friday as investors weighed up the import of OPEC’s agreement to cut output.
 Oil prices fell as the dollar strengthened on Friday and investors cashed in on crude's 6 percent one-day rise
after OPEC members agreed on output cuts for the first time in eight years to stifle a two-year price slide.
 Oil prices rose nearly 3 percent on Thursday, extending their rally on optimism over OPEC's first output cut plan
in eight years, despite some analysts' doubts that the reduction would be enough to rebalance a heavily over-
supplied market.
Aaj Ka Trend
03rd Oct’16
Equities I Commodities I Currencies I Mutual FundsSEBI Registered - Research Analyst Equities I Commodities I Currencies I Mutual Funds
International Market
Commodity Closing Price
Gold 1315.87
Silver 19.17
Crude Oil 48.24
Brent Crude Oil 5.19
Natural Gas 2.903
COMEX/NYMEX/ICE ( Precious Metals & Energy) Currency & Commodity Index
Currency (Spot) Current Price
USD / INR 66.61
Dollar Index 95.46
EUR / USD 1.1235
CRB Index* 186.31
Closing as on 30.09.16 *Closing as on 30.09.16
LME (Base Metals) ( $ per tones)
Commodity Closing Price
Copper 4865
Aluminum 1673
Zinc 2377
Lead 2123
Nickel 10575
SHFE (Base Metals) (Yuan per tones)
Commodity Closing Price
Copper 37690
Aluminum 12520
Zinc 18225
Lead 15310
Closing as on 30.09.16 Closing as on 30.09.16
LME INVENTORY DATA
Aaj Ka Trend
26-Sept-16 27-Sept-16 28-Sept-16 29-Sept-16 03-Oct-16
Aluminium -10701 -10175 7776 -10175 -4352
Copper 7252 7350 -2402 7350 -6952
Lead 250 250 -251 -504 -251
Nickel -854 -504 25 -65 -655
Zinc -648 -525 -827 -525 -626
03rd Oct’16
Equities I Commodities I Currencies I Mutual Funds
This is solely for information of clients of Choice Broking and does not construe to be an investment advice. It is also not intended as an offer or solicitation
for the purchase and sale of any financial instruments. Any action taken by you on the basis of the information contained herein is your responsibility alone
and Choice Broking its subsidiaries or its employees or associates will not be liable in any manner for the consequences of such action taken by you. We
have exercised due diligence in checking the correctness and authenticity of the information contained in this recommendation, but Choice Broking or any of
its subsidiaries or associates or employees shall not be in any way responsible for any loss or damage that may arise to any person from any inadvertent
error in the information contained in this recommendation or any action taken on basis of this information. Technical analysis studies market psychology,
price patterns and volume levels. It is used to forecast future price and market movements. Technical analysis is complementary to fundamental analysis
and news sources. The recommendations issued herewith might be contrary to recommendations issued by Choice Broking in the company research
undertaken as the recommendations stated in this report is derived purely from technical analysis. Choice Broking has based this document on information
obtained from sources it believes to be reliable but which it has not independently verified; Choice Broking makes no guarantee, representation or warranty
and accepts no responsibility or liability as to its accuracy or completeness. The opinions contained within the report are based upon publicly available
information at the time of publication and are subject to change without notice. The information and any disclosures provided herein are in summary form
and have been prepared for informational purposes. The recommendations and suggested price levels are intended purely for trading purposes. The
recommendations are valid for the day of the report however trading trends and volumes might vary substantially on an intraday basis and the
recommendations may be subject to change. The information and any disclosures provided herein may be considered confidential. Any use, distribution,
modification, copying, forwarding or disclosure by any person is strictly prohibited. The information and any disclosures provided herein do not constitute a
solicitation or offer to purchase or sell any security or other financial product or instrument. The current performance may be unaudited. Past performance
does not guarantee future returns. There can be no assurance that investments will achieve any targeted rates of return, and there is no guarantee against
the loss of your entire investment.
POTENTIAL CONFLICT OF INTEREST DISCLOSURE (as on date of report) Disclosure of interest statement – • Analyst interest of the stock
/Instrument(s): - No. • Firm interest of the stock / Instrument (s): - No.
Disclaimer
Contact Us
Amit Pathania
Research Associate
amit.pathania@choiceindia.com
Rohan Patil
Research Associate
rohan.patil@choiceindia.com
www.choicebroking.incustomercare@choiceindia.com
SEBI Registered - Research Analyst Equities I Commodities I Currencies I Mutual Funds
Aaj Ka Trend
03rd Oct’16
Neeraj Yadav
Research Advisor
neeraj.yadav@choiceindia.com
Anish Vyas
Senior Research Associate
anish.vyas@choiceindia.com
Anish Vyas
Digitally signed by Anish Vyas
DN: cn=Anish Vyas, o=Choice Merchandise
Broking Pvt. Ltd, ou=Sr. Research Associate,
email=anish.vyas@choiceindia.com, c=IN
Date: 2016.10.01 12:25:53 +05'30'

Aaj ka trend 03.10.16

  • 1.
    Equities I CommoditiesI Currencies I Mutual Funds Aaj Ka Trend Technical View: MCX Gold prices has shown breakdown of symmetrical triangle pattern at 30880 levels on hourly time frame. On the other hand, prices have been trading below 20 HEMA on hourly chart. On the other hand, price has shown breakdown of horizontal trend line at 30820 levels on hourly chart. Moreover, Momentum Indicator RSI is trading below 50 levels on hourly time frame. For now we expect prices should move lower towards 30100 levels in the coming trading sessions. SEBI Registered - Research Analyst Equities I Commodities I Currencies I Mutual Funds Bullions MCX Gold Oct Hourly Chart CMP: 30690 MCX Gold (Oct) Trend: Bearish Price potential: 30100 Reversal:30970 MCX Silver Dec Hourly Chart CMP: 45746 Technical View: On hourly chart MCX Silver price have been trading in horizontal channel pattern from past few weeks. Furthermore, MCX Silver prices are trading below its 20 HEMA on hourly time frame. In addition COMEX silver prices have been facing resistance of its falling trend line at $19.50 levels on hourly chart. Moreover, Momentum indicator RSI is trading is below near 50 levels on hourly basis. For now we expect prices to move higher towards 45000 levels in few trading sessions. MCX Silver (Dec) Trend: Bearish Price potential: 45000 Reversal: 46100 Pivot levels for the Day S1 S2 S3 Pivot R1 R2 R3 Gold 31111 30961 30725 31197 31347 31433 31669 Silver 45578 45321 44836 45806 46063 46291 46776 03rd Oct’16
  • 2.
    Equities I CommoditiesI Currencies I Mutual Funds Technical View: On hourly chart MCX Copper has witnessed pullback to its neck line of Inverted Head & Shoulder formation at 327 levels on hourly time frame. Furthermore, Counter is trading above its 50 HEMA on hourly chart. Moreover, momentum indicator MACD has observed positive crossover on hourly time frame. In addition, Momentum indicator RSI is trading above 50 levels on hourly basis. For now we expect prices to move higher towards 334.20 levels in coming trading sessions. SEBI Registered - Research Analyst Equities I Commodities I Currencies I Mutual Funds MCX Copper Nov hourly Chart CMP: 325.85 MCX Copper (Nov) Trend: Bullish Price potential: 334.20 Reversal: 322.20 MCX Crude Oil Oct. Hourly Chart CMP: 3210 Technical View: MCX Crude Oil prices have witnessed breakout of its Triangle pattern at 3144 levels on hourly time frame. Furthermore, Counter is trading above its 20 HEMA on hourly chart. Looking at ADX, positive directional index (+DMI) is in domination position with rising average direction index. Moreover, Momentum indicator RSI is trading above 60 levels on hourly basis. For now we expect prices to move higher towards 3285 levels in coming trading sessions. MCX Crude Oil (Oct) Trend: Bullish Price potential: 3285 Reversal: 3160 Pivot levels for the Day S1 S2 S3 Pivot R1 R2 R3 Copper 324.4 322.9 319.2 326.6 328.1 330.3 334.0 Crude 3106 3007 2845 3169 3268 3331 3493 Base Metal Energy Aaj Ka Trend 03rd Oct’16
  • 3.
    Equities I CommoditiesI Currencies I Mutual FundsSEBI Registered - Research Analyst Equities I Commodities I Currencies I Mutual Funds Other Base Metals & Energy S1 S2 S3 Pivot R1 R2 R3 Trend Copper 324.4 322.9 319.2 326.6 328.1 330.3 334.0 Aluminum 110.9 110.4 109.6 111.2 111.7 112.0 112.8 Lead 134.8 131.7 126.8 136.5 139.7 141.4 146.2 Nickel 690.1 680.7 655.6 705.8 715.2 730.9 756.0 Zinc 156.3 155.1 153.1 157.0 158.3 159.0 160.9 Natural Gas 197.0 194.8 189.7 199.9 202.1 205.0 210.1 Fundamental News:  Gold prices dipped slightly in Asia on Friday with investors looking to more possible comment on chances of a Fed rate hike by the end of the year and a key manufacturing survey from China.  Gold prices rose a tad in Asia on Friday after a key manufacturing survey from China came in as expected and investors looked ahead to more remarks from Fed policymakers.  Gold prices were little changed on Friday, as mixed U.S. data released on Friday weighed on the dollar and as sustained concerns over the European banking sector pushed traders to turn to safer assets.  U.S. oil futures moved lower on Friday, as traders locked in profits from the commodity’ rally to a one-month high on Thursday, boosted by news of a production freeze deal between major oil producers.  Russia will find mechanisms and instruments needed to freeze oil production should the country reach an agreement with the Organization of the Petroleum Exporting Countries on limiting output, the Russian Energy Minister said on Friday.  Oil retreated Friday as investors weighed up the import of OPEC’s agreement to cut output.  Oil prices fell as the dollar strengthened on Friday and investors cashed in on crude's 6 percent one-day rise after OPEC members agreed on output cuts for the first time in eight years to stifle a two-year price slide.  Oil prices rose nearly 3 percent on Thursday, extending their rally on optimism over OPEC's first output cut plan in eight years, despite some analysts' doubts that the reduction would be enough to rebalance a heavily over- supplied market. Aaj Ka Trend 03rd Oct’16
  • 4.
    Equities I CommoditiesI Currencies I Mutual FundsSEBI Registered - Research Analyst Equities I Commodities I Currencies I Mutual Funds International Market Commodity Closing Price Gold 1315.87 Silver 19.17 Crude Oil 48.24 Brent Crude Oil 5.19 Natural Gas 2.903 COMEX/NYMEX/ICE ( Precious Metals & Energy) Currency & Commodity Index Currency (Spot) Current Price USD / INR 66.61 Dollar Index 95.46 EUR / USD 1.1235 CRB Index* 186.31 Closing as on 30.09.16 *Closing as on 30.09.16 LME (Base Metals) ( $ per tones) Commodity Closing Price Copper 4865 Aluminum 1673 Zinc 2377 Lead 2123 Nickel 10575 SHFE (Base Metals) (Yuan per tones) Commodity Closing Price Copper 37690 Aluminum 12520 Zinc 18225 Lead 15310 Closing as on 30.09.16 Closing as on 30.09.16 LME INVENTORY DATA Aaj Ka Trend 26-Sept-16 27-Sept-16 28-Sept-16 29-Sept-16 03-Oct-16 Aluminium -10701 -10175 7776 -10175 -4352 Copper 7252 7350 -2402 7350 -6952 Lead 250 250 -251 -504 -251 Nickel -854 -504 25 -65 -655 Zinc -648 -525 -827 -525 -626 03rd Oct’16
  • 5.
    Equities I CommoditiesI Currencies I Mutual Funds This is solely for information of clients of Choice Broking and does not construe to be an investment advice. It is also not intended as an offer or solicitation for the purchase and sale of any financial instruments. Any action taken by you on the basis of the information contained herein is your responsibility alone and Choice Broking its subsidiaries or its employees or associates will not be liable in any manner for the consequences of such action taken by you. We have exercised due diligence in checking the correctness and authenticity of the information contained in this recommendation, but Choice Broking or any of its subsidiaries or associates or employees shall not be in any way responsible for any loss or damage that may arise to any person from any inadvertent error in the information contained in this recommendation or any action taken on basis of this information. Technical analysis studies market psychology, price patterns and volume levels. It is used to forecast future price and market movements. Technical analysis is complementary to fundamental analysis and news sources. The recommendations issued herewith might be contrary to recommendations issued by Choice Broking in the company research undertaken as the recommendations stated in this report is derived purely from technical analysis. Choice Broking has based this document on information obtained from sources it believes to be reliable but which it has not independently verified; Choice Broking makes no guarantee, representation or warranty and accepts no responsibility or liability as to its accuracy or completeness. The opinions contained within the report are based upon publicly available information at the time of publication and are subject to change without notice. The information and any disclosures provided herein are in summary form and have been prepared for informational purposes. The recommendations and suggested price levels are intended purely for trading purposes. The recommendations are valid for the day of the report however trading trends and volumes might vary substantially on an intraday basis and the recommendations may be subject to change. The information and any disclosures provided herein may be considered confidential. Any use, distribution, modification, copying, forwarding or disclosure by any person is strictly prohibited. The information and any disclosures provided herein do not constitute a solicitation or offer to purchase or sell any security or other financial product or instrument. The current performance may be unaudited. Past performance does not guarantee future returns. There can be no assurance that investments will achieve any targeted rates of return, and there is no guarantee against the loss of your entire investment. POTENTIAL CONFLICT OF INTEREST DISCLOSURE (as on date of report) Disclosure of interest statement – • Analyst interest of the stock /Instrument(s): - No. • Firm interest of the stock / Instrument (s): - No. Disclaimer Contact Us Amit Pathania Research Associate amit.pathania@choiceindia.com Rohan Patil Research Associate rohan.patil@choiceindia.com www.choicebroking.incustomercare@choiceindia.com SEBI Registered - Research Analyst Equities I Commodities I Currencies I Mutual Funds Aaj Ka Trend 03rd Oct’16 Neeraj Yadav Research Advisor neeraj.yadav@choiceindia.com Anish Vyas Senior Research Associate anish.vyas@choiceindia.com Anish Vyas Digitally signed by Anish Vyas DN: cn=Anish Vyas, o=Choice Merchandise Broking Pvt. Ltd, ou=Sr. Research Associate, email=anish.vyas@choiceindia.com, c=IN Date: 2016.10.01 12:25:53 +05'30'