Download to read offline
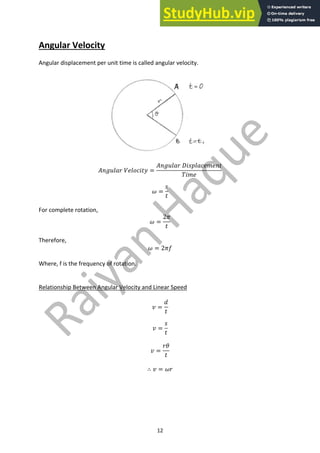

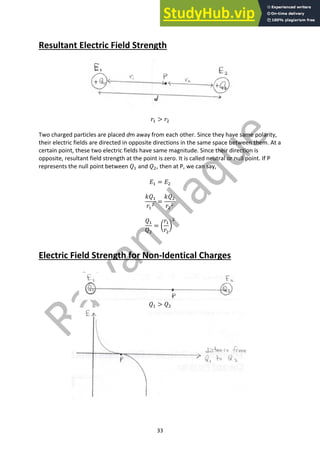
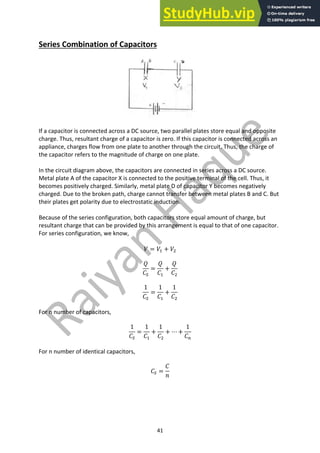
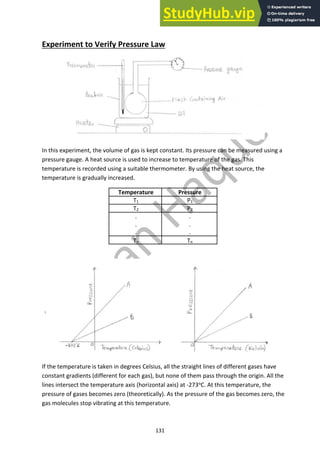
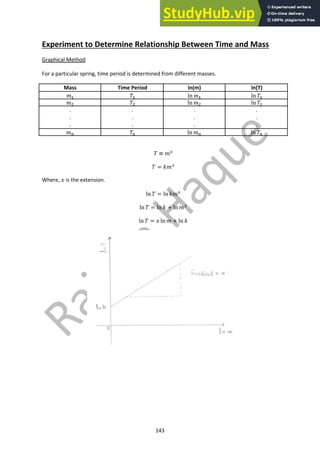
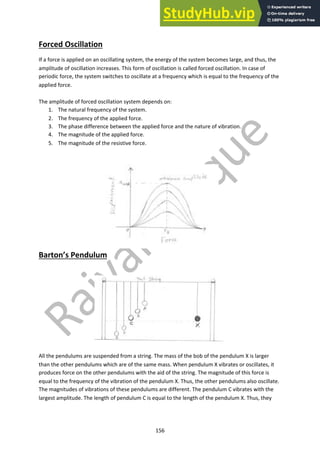
![50
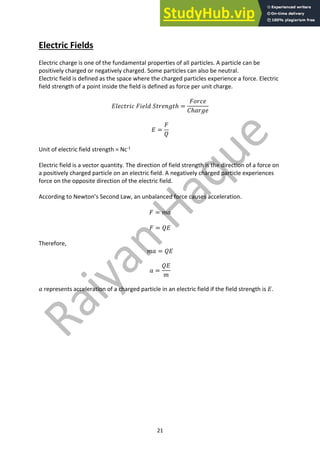
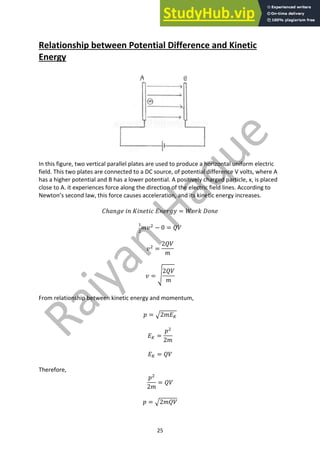
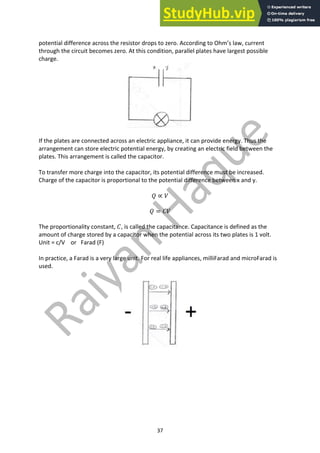
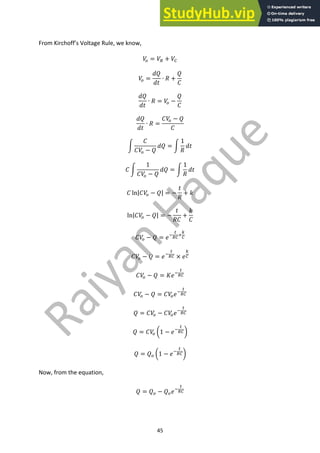
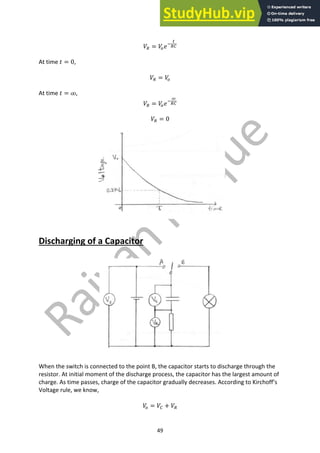
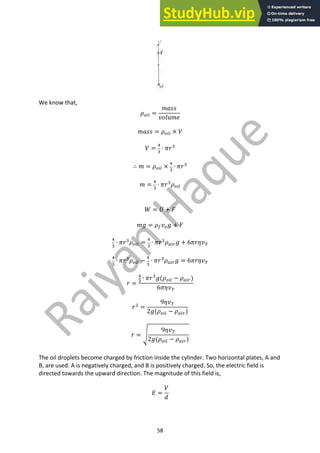
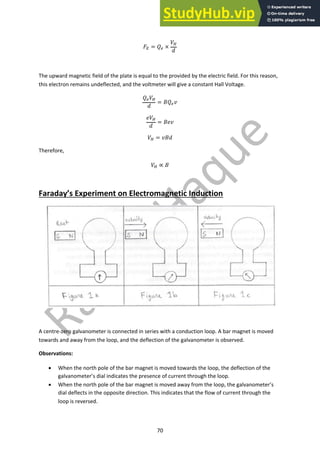
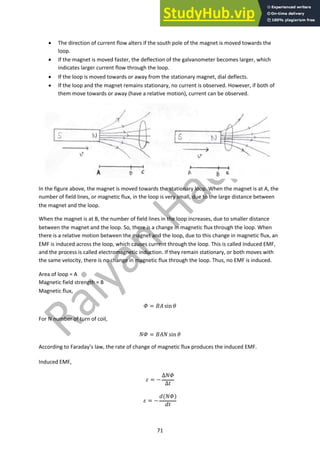
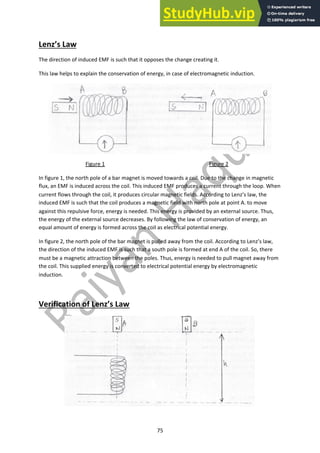
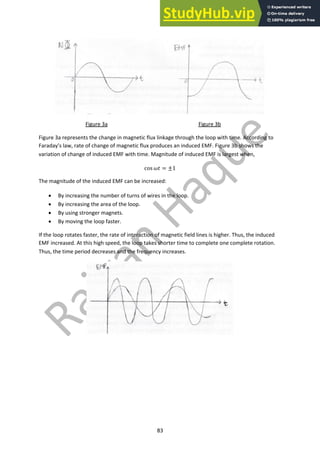
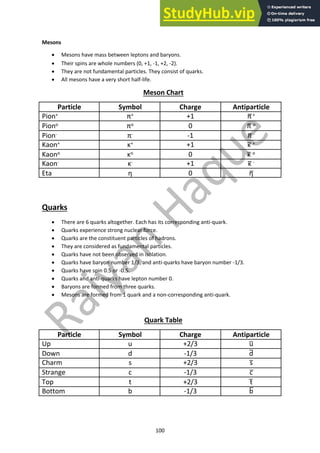
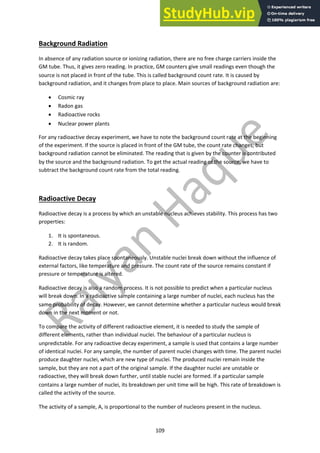
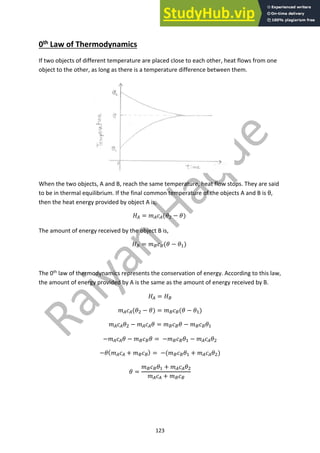
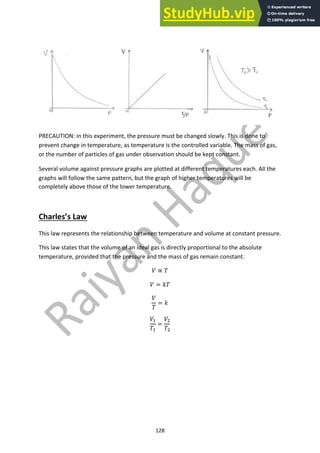
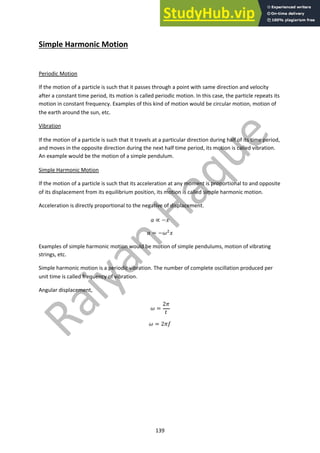
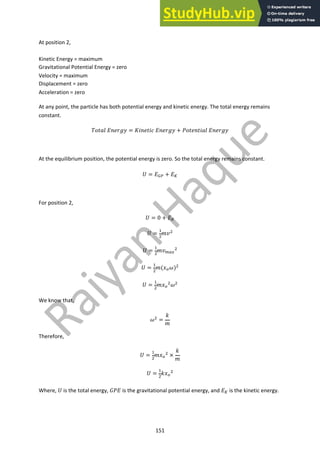
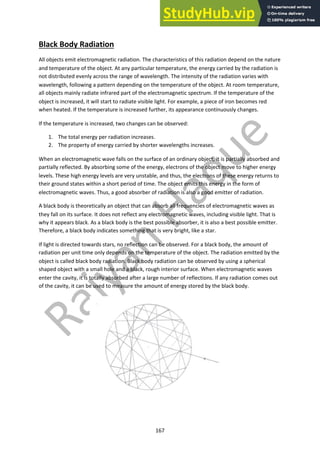
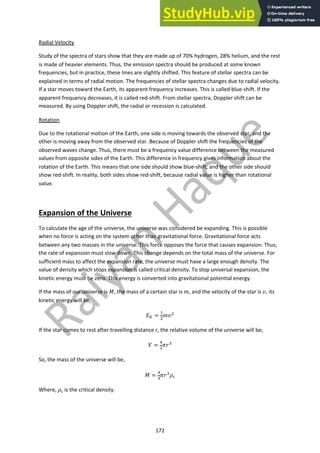
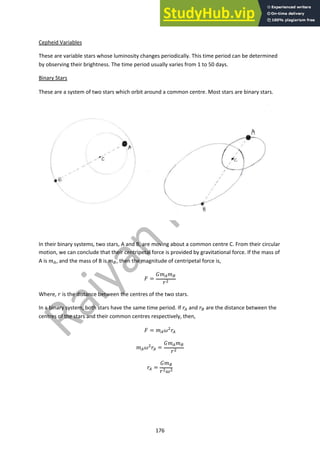
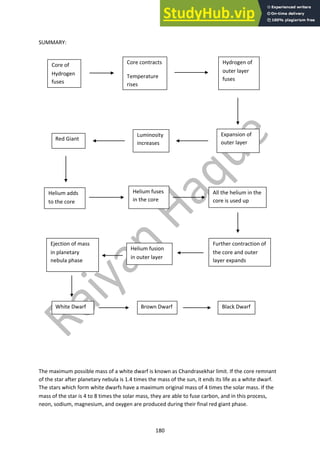
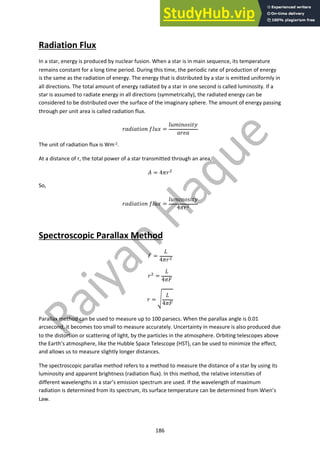
When the cell is removed, 𝑉? = 0
𝑉7 + 𝑉8 = 0
𝑉7 =
𝑄
𝐶
𝑉8 =
𝑑𝑄
𝑑𝑡
∙ 𝑅
Therefore,
𝑄
𝐶
+
𝑑𝑄
𝑑𝑡
∙ 𝑅 = 0
𝑑𝑄
𝑑𝑡
∙ 𝑅 = −
𝑄
𝐶
p
1
𝑄
𝑑𝑄
A
A'
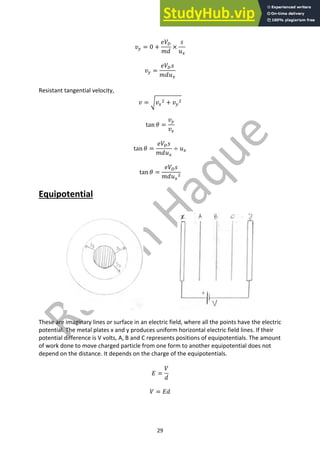
= − p
1
𝑅𝐶
𝑑𝑡
<
?
[ln 𝑄]A'
A
= − {
𝑡
𝑅𝐶
|
?
<
ln }
𝑄
𝑄9
} = −
𝑡
𝑅𝐶
𝑄
𝑄9
= 𝑒;
<
87
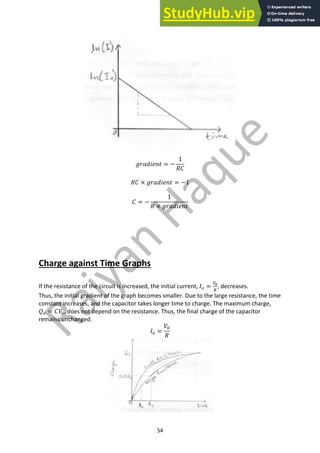
𝑄 = 𝑄9 ∙ 𝑒;
<
87
When 𝑡 = 𝜏,
𝜏 = 𝑅𝐶
𝑄 = 𝑄9 ∙ 𝑒;
87
87
𝑄 = 𝑄9 ∙ 𝑒;"
𝑄 = 0.37𝑄9](https://image.slidesharecdn.com/a2physics-notes-230807171612-f3b0ac4f/85/A2-PHYSICS-Notes-pdf-51-320.jpg)


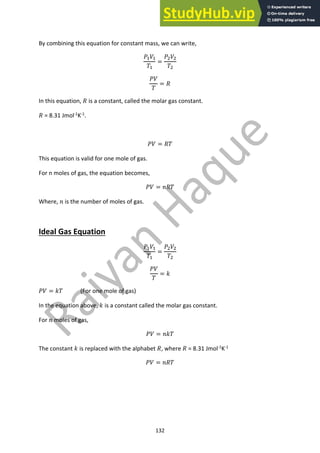
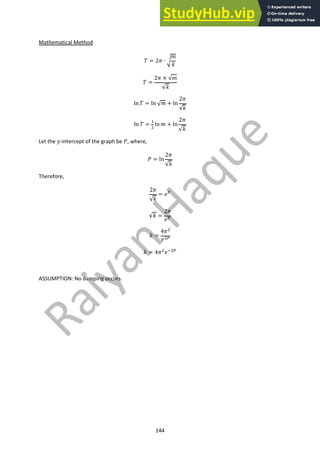
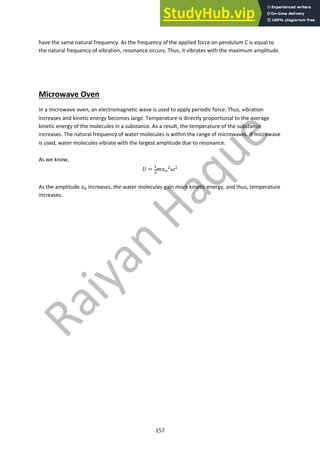
![110
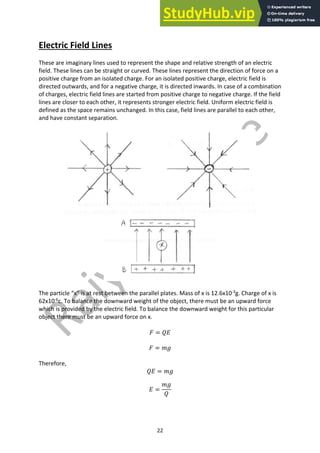
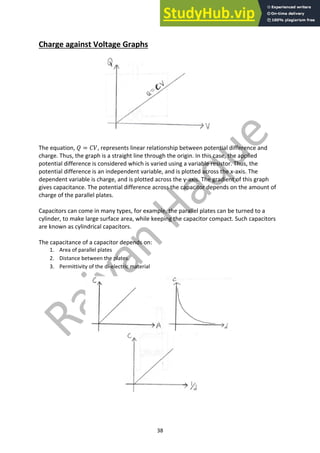
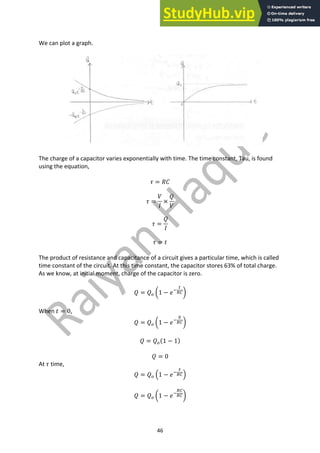
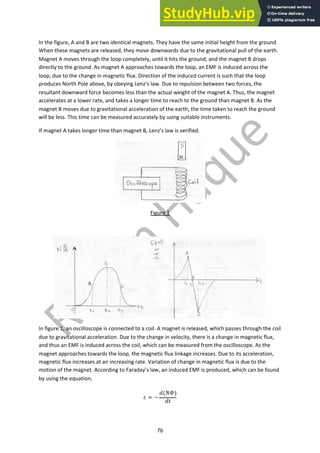
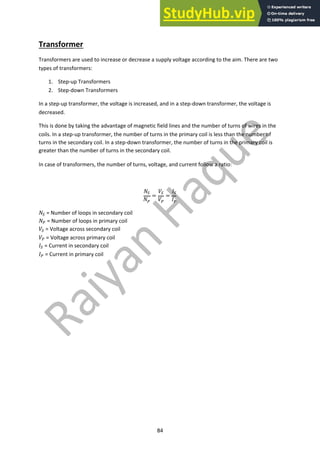
! ∝ −$
! =
&$
&'
Therefore,
&$
&'
∝ −$
&$
&'
= −($
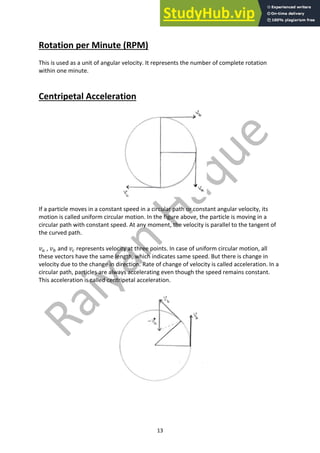
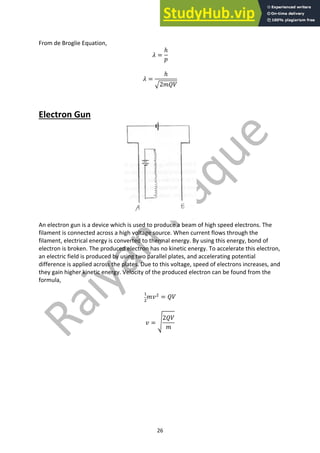
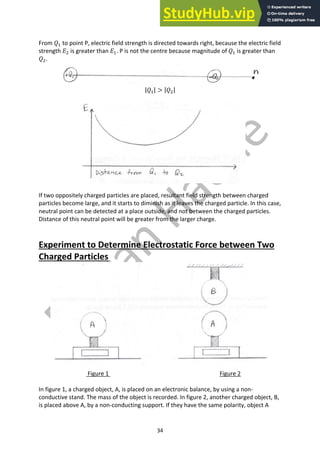
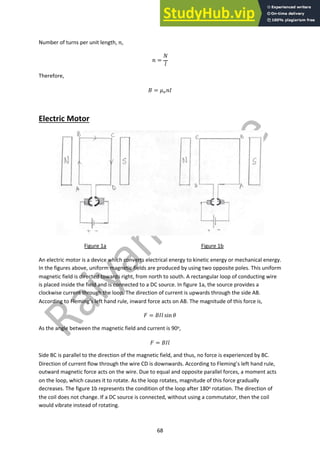
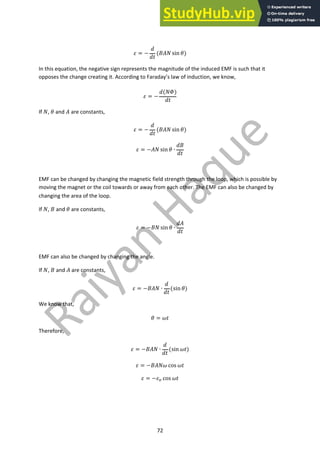
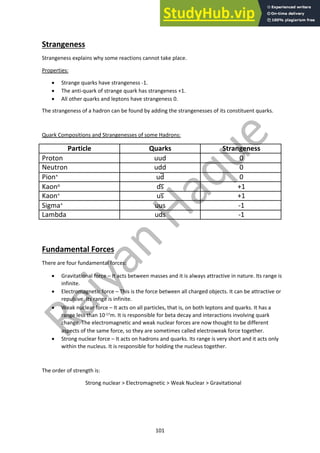
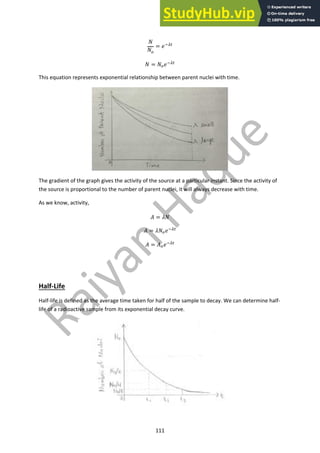
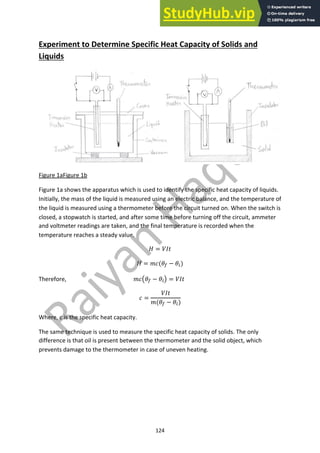
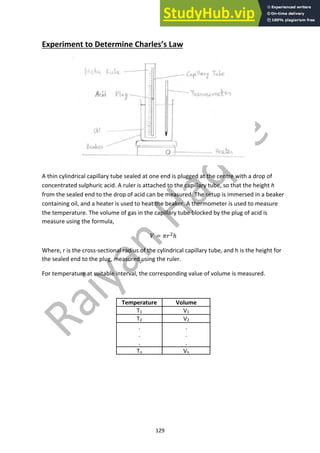
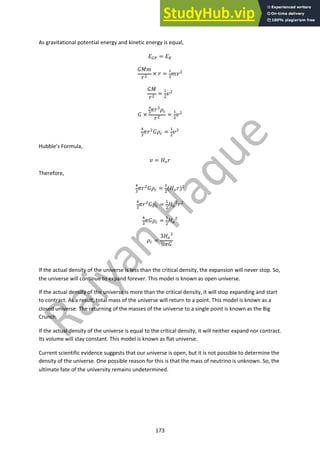
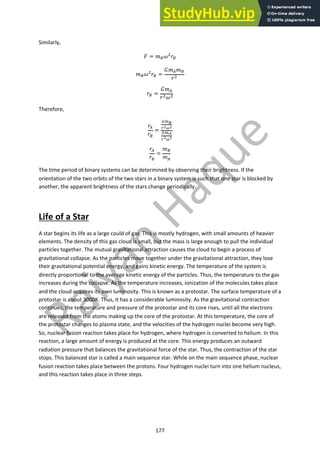
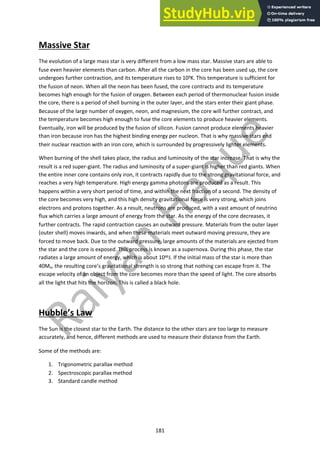
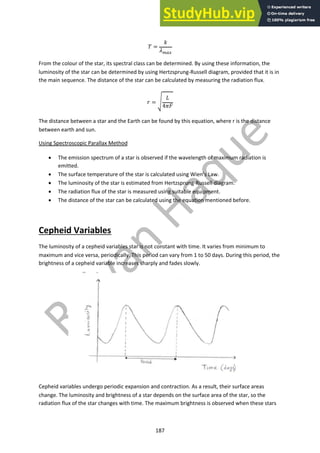
In this equation, the negative sign indicates that the number of parent nuclei decreases with time.
Lambda is called the decay constant. It is the constant of proportionality of decay of any nucleus in a
radioactive sample.
If we ignore the negative sign,
! = ($
( =
!
$
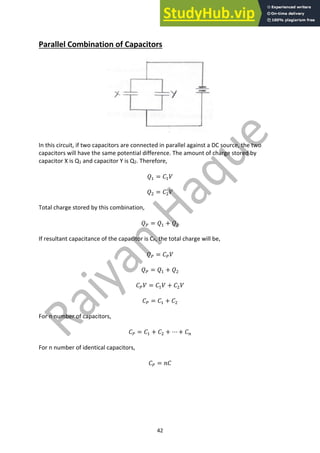
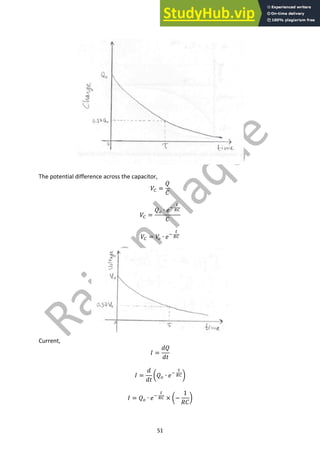
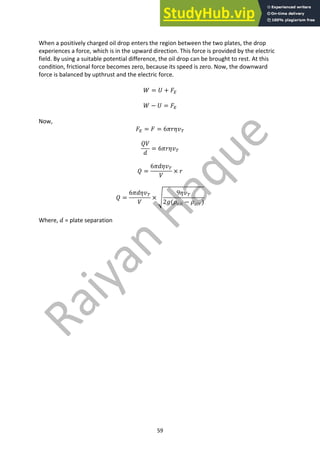
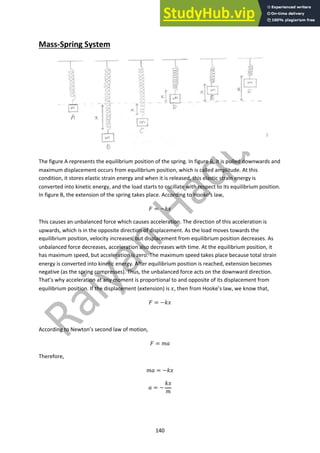
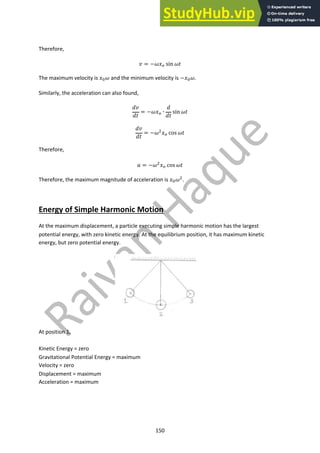
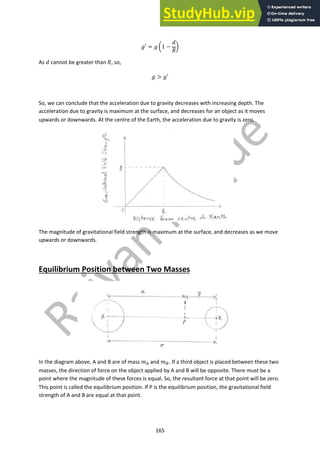
Exponential Decay
In a radioactive decay process, the number of parent nuclei decreases with time. At any moment,
the rate of breakdown can be represented by the equation,
&$
&'
= −($
At initial moment, when t=0, the sample contains maximum number of parent nuclei. Let us consider
this number to be N, which decreases with time, t seconds. The number of parent nuclei in the
sample can be found using the equation,
&$
&'
= −($
−)
1
$
&$
!
!!
= ) (
"
#
[ln|$|]!!
! = [−(']#
"
ln|$| − ln|$$| = −((' − 0)
ln 3
$
$$
3 = −('](https://image.slidesharecdn.com/a2physics-notes-230807171612-f3b0ac4f/85/A2-PHYSICS-Notes-pdf-111-320.jpg)

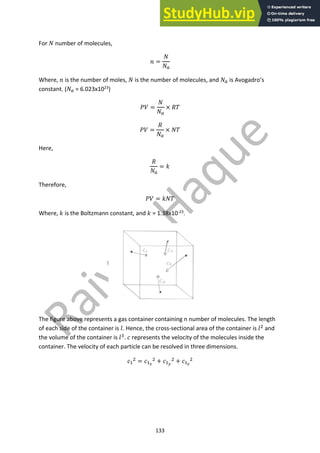
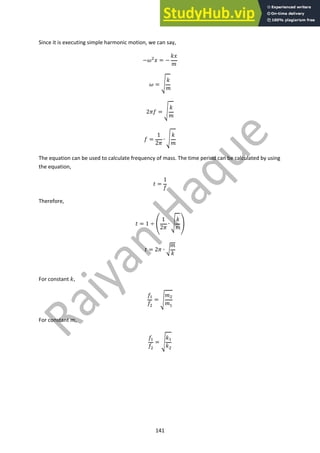
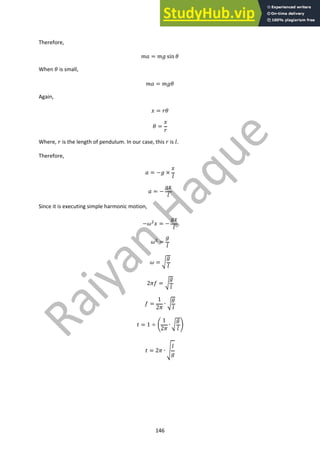
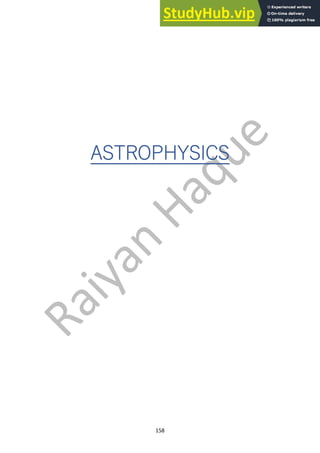
![145
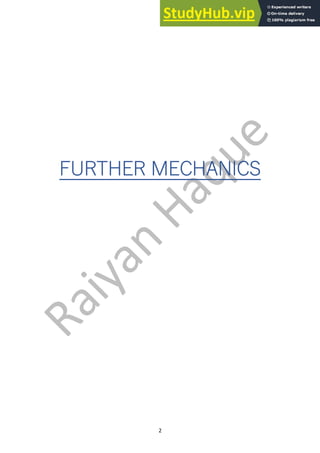
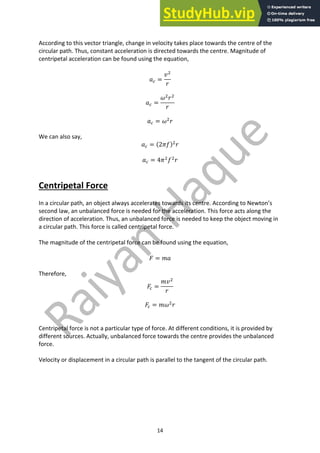
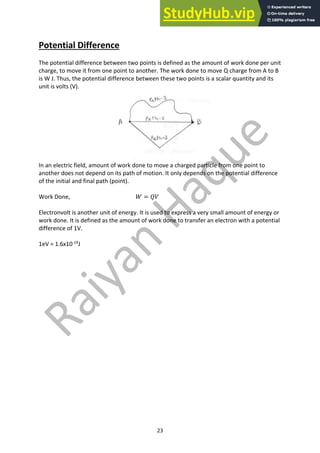
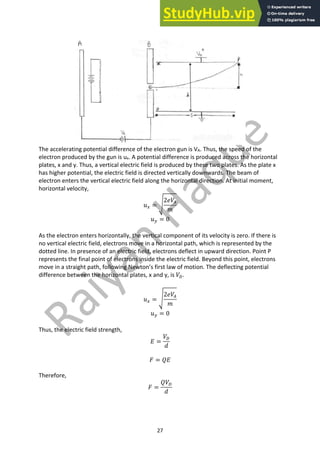
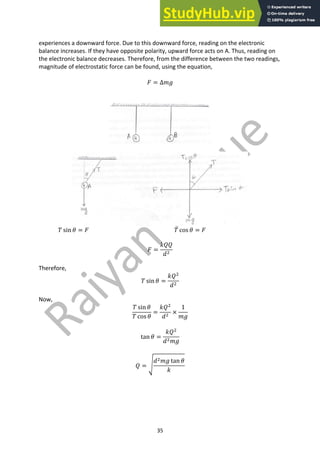
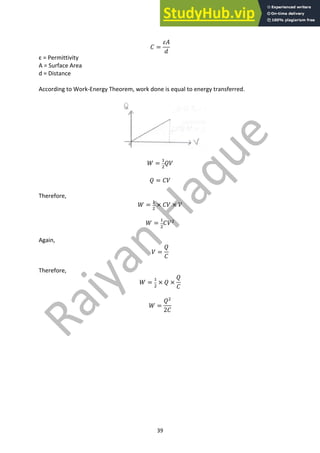
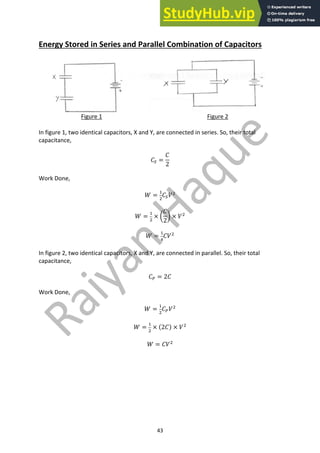
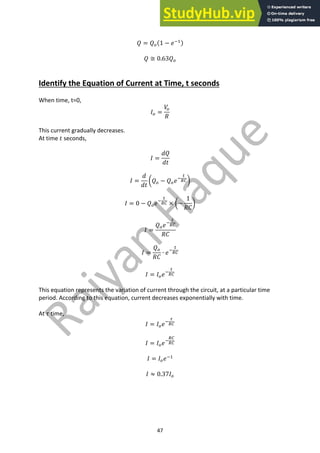
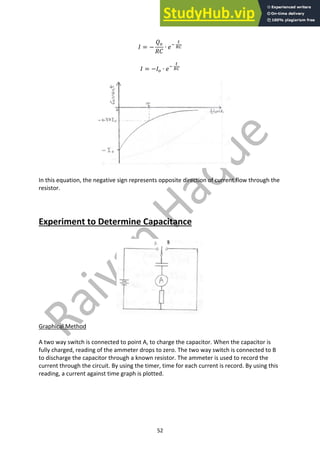
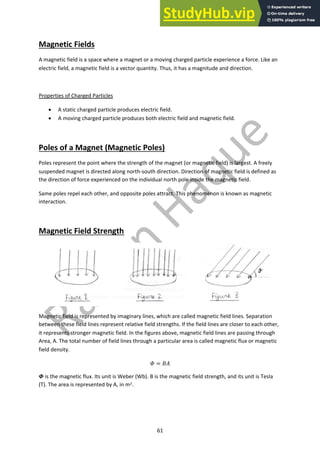
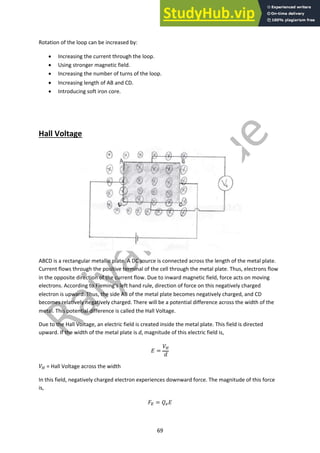
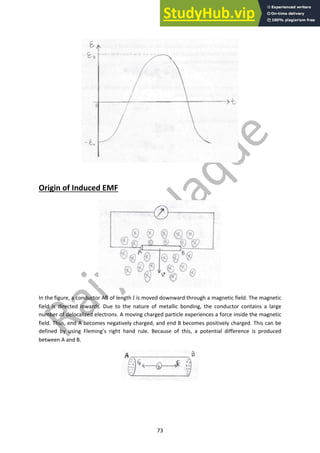
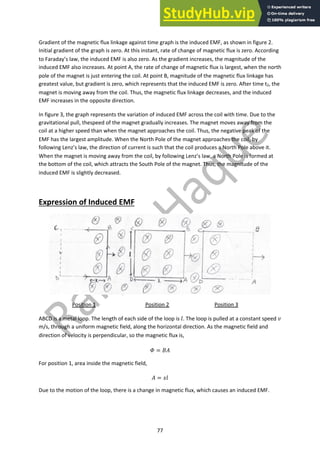
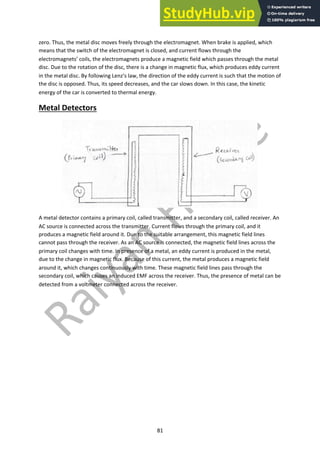
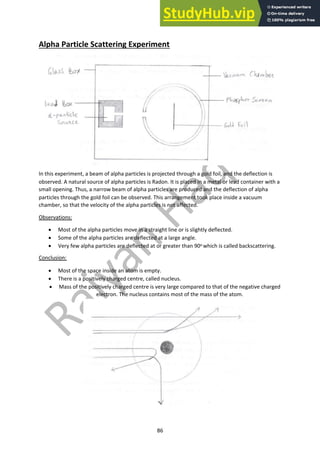
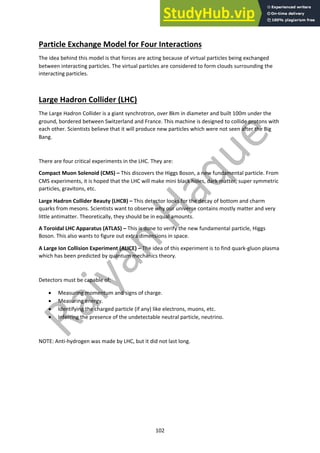
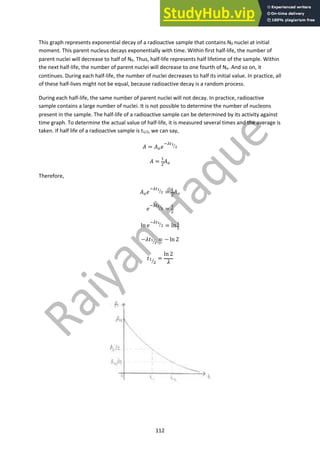
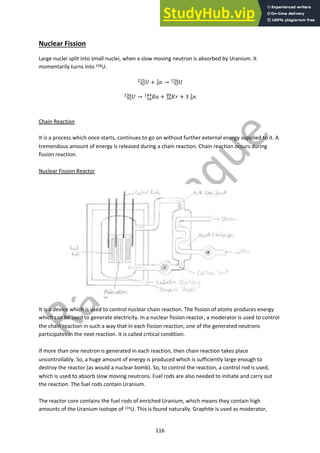
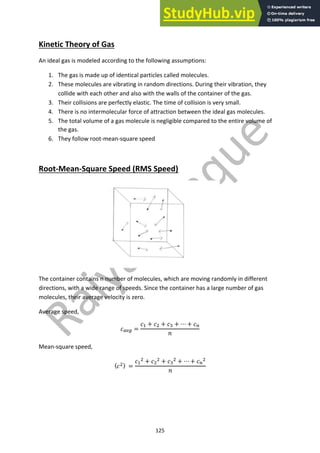
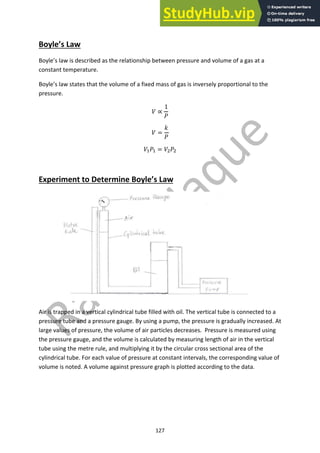
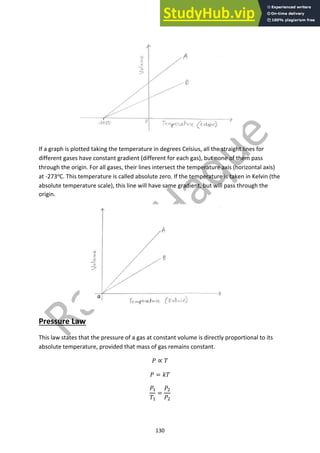
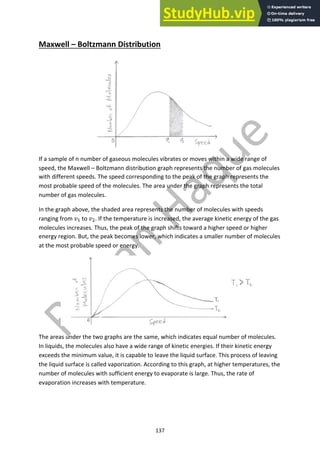
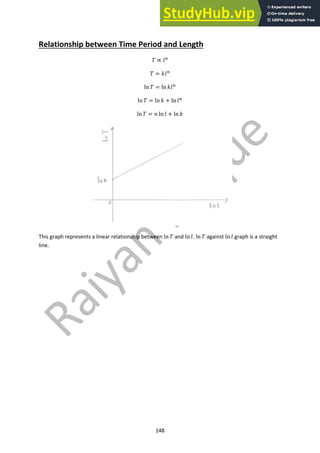
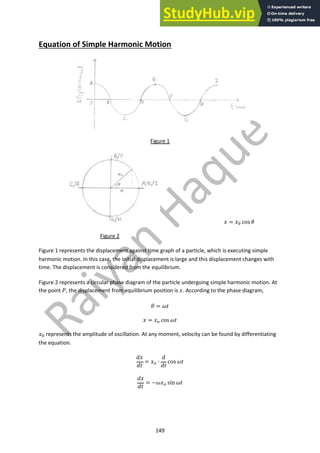
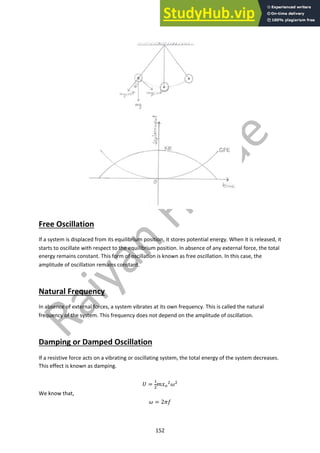
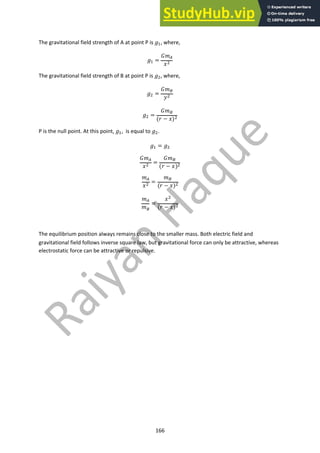
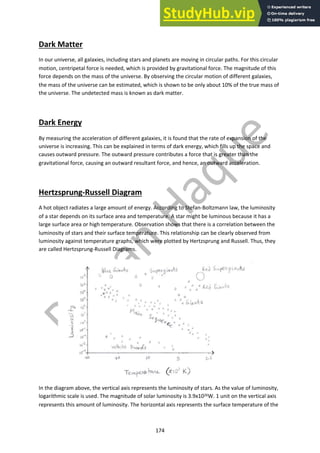
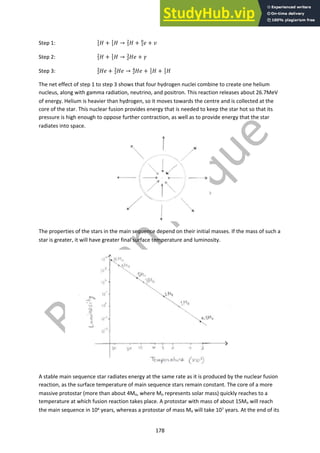
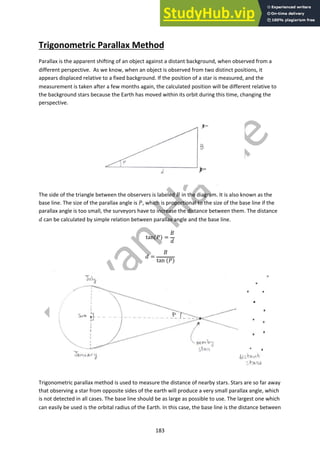
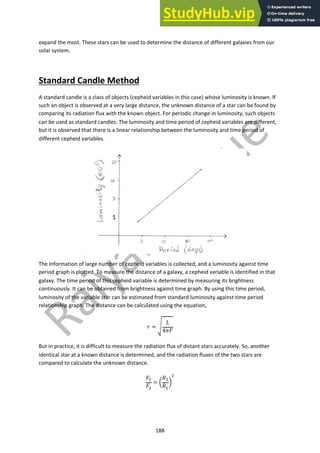
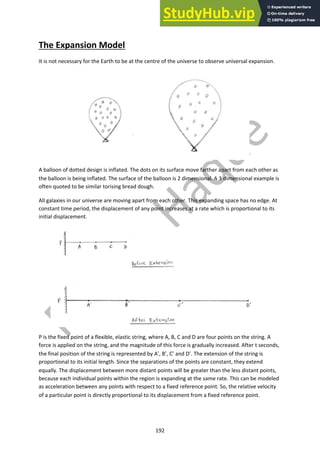
Simple Pendulum
A simple pendulum is constructed by a freely suspended load from a rigid point. The distance
between the point of suspension and the centre of gravity of the load is called the length of the
pendulum. So, we can say,
! = # + %
If the load is displaced from its equilibrium position, it stores gravitational potential energy. When it
is released, this energy is converted into kinetic energy and it oscillates with respect to its
equilibrium position. It executes simple harmonic motion as its acceleration is proportional to and
opposite of the direction of displacement. The weight of the load acts downwards. It can be resolved
in two components. The component &' cos + balances the tension, while the component &' sin +
acts towards the equilibrium position. This unbalanced component causes acceleration of the load. If
+ is very small, we can say,
sin + ≈ +
[Angle unit in radians]
/ = &0](https://image.slidesharecdn.com/a2physics-notes-230807171612-f3b0ac4f/85/A2-PHYSICS-Notes-pdf-146-320.jpg)
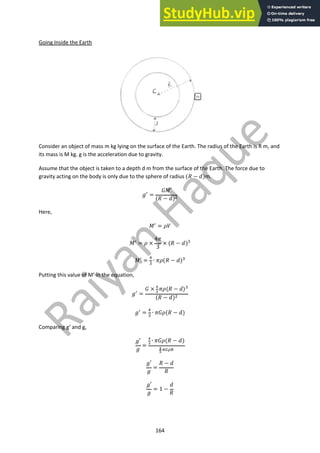
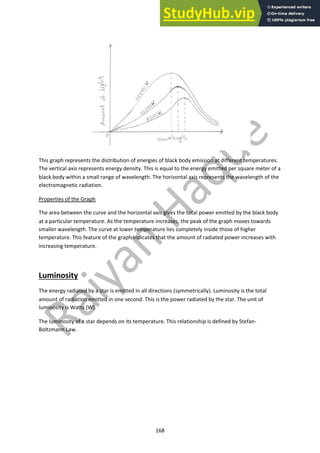


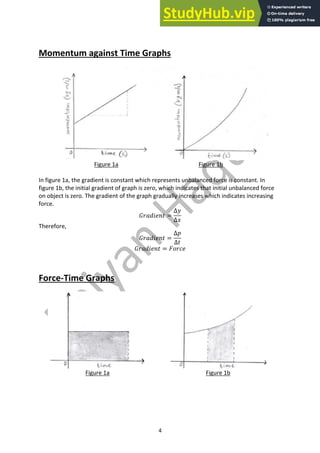
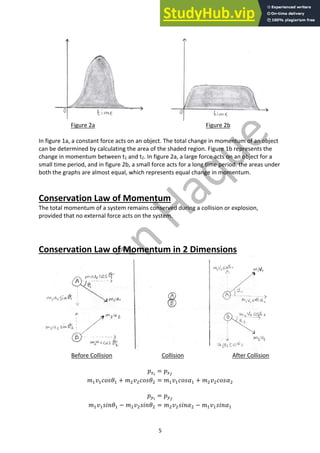
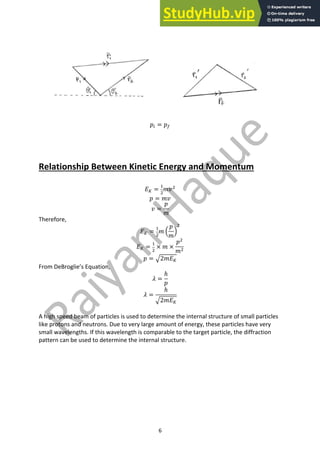
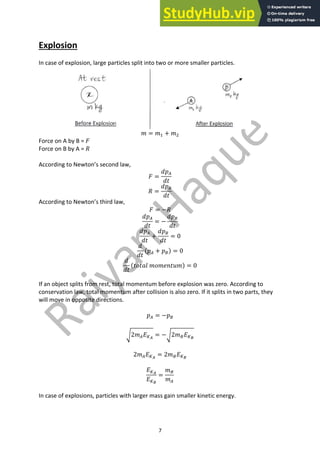
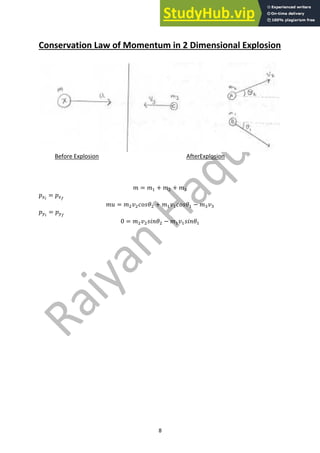
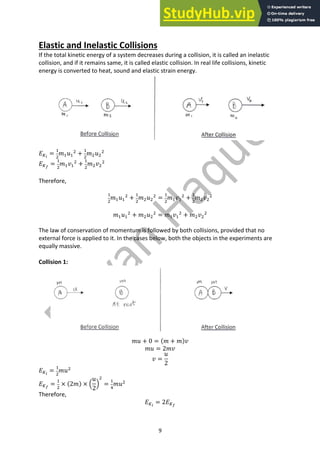
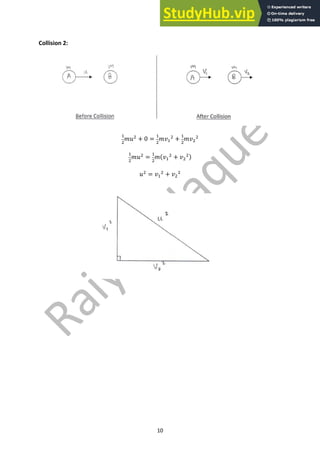
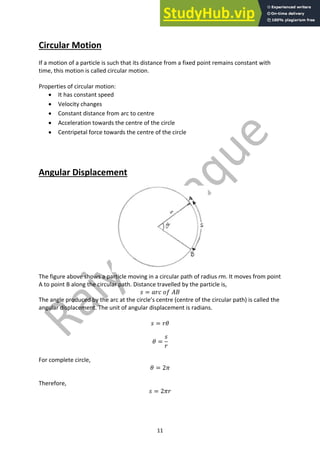
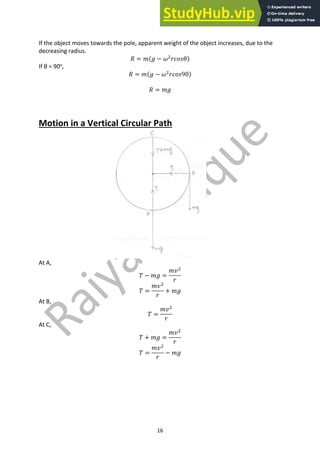
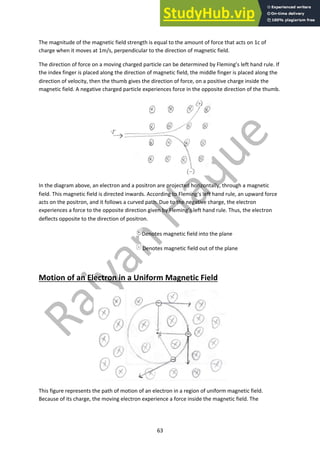
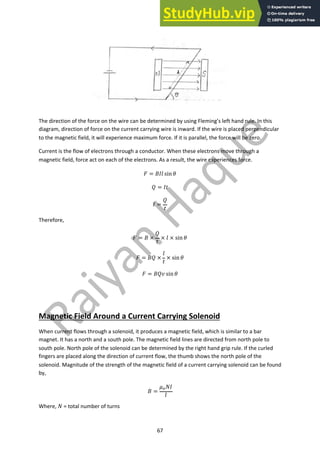
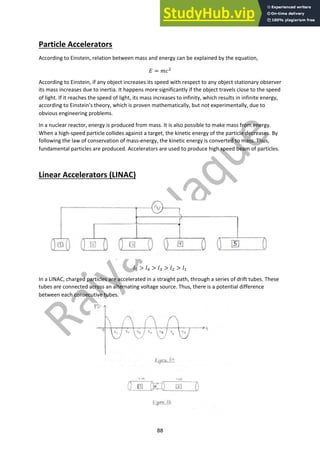
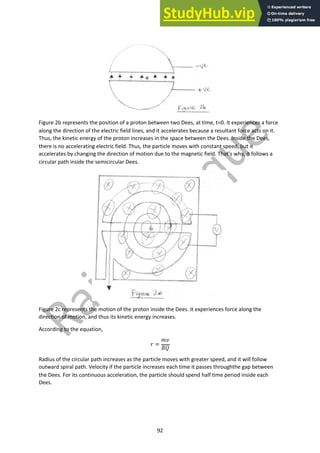
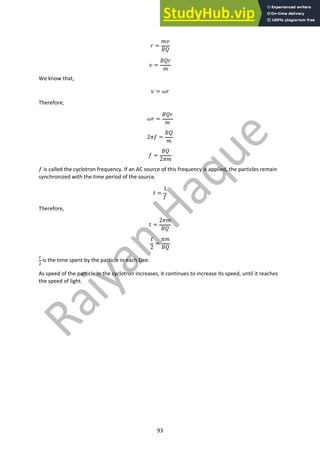
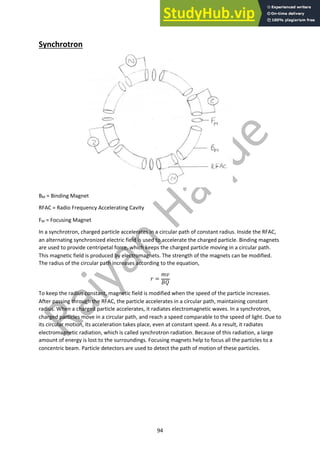
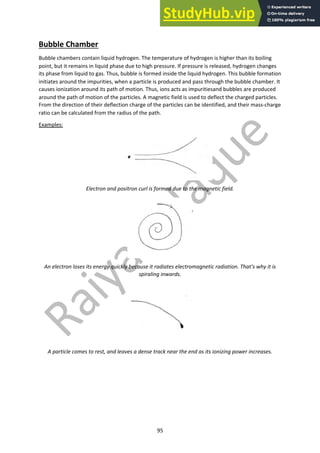
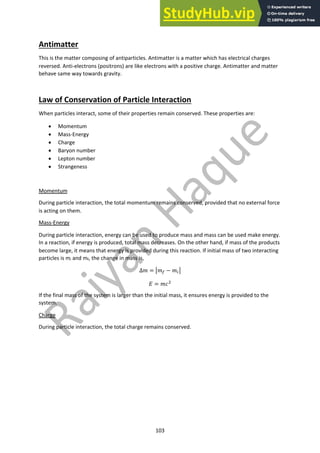
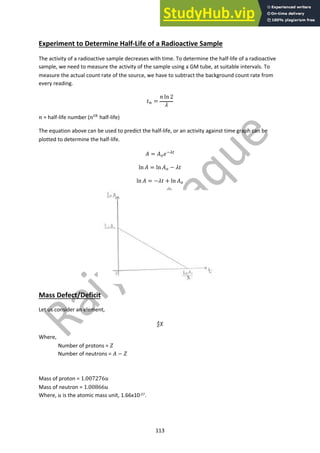
This document contains notes on various topics in physics including further mechanics, electric fields, magnetic fields, particle physics, nuclear physics, thermodynamics, oscillations, and astrophysics. The mechanics section covers concepts such as momentum, impulse, conservation of momentum, elastic and inelastic collisions, circular motion, centripetal force, and rotational motion. It includes diagrams of momentum-time graphs, force-time graphs, and free body diagrams related to rotational motion. Formulas for calculating momentum, force, velocity, acceleration, energy, and angular quantities are also provided.


