Climate Change Impact Assessment on Hydrological Regime of Kali Gandaki BasinHI-AWARE
The presentation focuses on the findings of the impact of climate change on the hydrological regime and water balance components of the Kali Gandaki basin in Nepal. The Soil and Water Assessment Tool (SWAT) has been used to predict future projections.
Presentation from the workshop 'Informing and Enabling a Climate Resilient Ireland”' - held 23 March 2012. This event launched 2 EPA Climate Change Research Programme reports:
CCRP9 'Ireland adapts to Climate Change' and CCRP10 'Integrating Climate Change Adaptation into Sectoral Policies in Ireland'
Slides from a presentation about modeling past and future climate as part of the "School of Ice" workshop for educators at Oregon State University on Aug. 2, 2021.
Late Noachian Icy Highlands climate model: Exploring the possibility of trans...Sérgio Sacani
The nature of the Late Noachian climate of Mars remains one of the outstanding questions in the
study of the evolution of martian geology and climate. Despite abundant evidence for flowing water (valley
networks and open/closed basin lakes), climate models have had difficulties reproducing mean annual
surface temperatures (MAT) > 273 K in order to generate the “warm and wet” climate conditions presumed
to be necessary to explain the observed fluvial and lacustrine features. Here, we consider a “cold
and icy” climate scenario, characterized by MAT ∼225 K and snow and ice distributed in the southern
highlands, and ask: Does the formation of the fluvial and lacustrine features require continuous “warm
and wet” conditions, or could seasonal temperature variation in a “cold and icy” climate produce suffi-
cient summertime ice melting and surface runoff to account for the observed features? To address this
question, we employ the 3D Laboratoire de Météorologie Dynamique global climate model (LMD GCM) for
early Mars and (1) analyze peak annual temperature (PAT) maps to determine where on Mars temperatures
exceed freezing in the summer season, (2) produce temperature time series at three valley network
systems and compare the duration of the time during which temperatures exceed freezing with seasonal
temperature variations in the Antarctic McMurdo Dry Valleys (MDV) where similar fluvial and lacustrine
features are observed, and (3) perform a positive-degree-day analysis to determine the annual volume
of meltwater produced through this mechanism, estimate the necessary duration that this process must
repeat to produce sufficient meltwater for valley network formation, and estimate whether runoff rates
predicted by this mechanism are comparable to those required to form the observed geomorphology of
the valley networks.
Simulated versus Satellite Retrieval Distribution Patterns of the Snow Water ...Agriculture Journal IJOEAR
Abstract— Snow is a very important component of the climate system which controls surface energy and water balances. Its high albedo, low thermal conductivity and properties of surface water storage impact regional to global climate. The various properties characterizing snow are highly variable and so have to be determined as dynamically active components of climate. However, on large spatial scales the properties of snow are not easily quantified either from numerical modelling or observations. Since neither observations (ground measurements or satellite retrievals) nor models alone are capable of providing enough adequate information about the time space variability of snow properties, it becomes necessary to combine their information. In the presented study the obtained with the regional climate model RegCM snow water equivalent (SWE) on monthly basis over Southeast Europe for a time window of 14 consecutive winters is compared with the Globsnow satellite product. The concordance between both datasets is evaluated with number of statistical scores. The result reveals the principal agreement between the two products, but however, with very significant discrepancies, mainly overestimations, for some years and gridcells.
Climate science part 3 - climate models and predicted climate changeLPE Learning Center
Many lines of evidence, from ice cores to marine deposits, indicate that Earth’s temperature, sea level, and distribution of plant and animal species have varied substantially throughout history. Ice cores from Antarctica suggest that over the past 400,000 years global temperature has varied as much as 10 degrees Celsius through ice ages and periods warmer than today. Before human influence, natural factors (such as the pattern of earth’s orbit and changes in ocean currents) are believed to be responsible for climate changes. For more, visit: http://www.extension.org/69150
GEORG Geothermal Workshop 2016 SESSION B2, Midstream. Presentation title: Feasibility study for utilizing an ORC cycle to cool medium temperature geothermal fluid to appropriate temperature for use at Seltjarnarnes district heating
GIS based spatial distribution of Temperature and Chlorophyll-a along Kalpakk...IJERA Editor
This paper briefly describes the status of Temperature and Chlorophyll-a trend in Kalpakkam Coast, discusses its ecological and temperature impacts recommending measures to achieve long term sustainability using advanced tools like Geographic Information System (GIS). Present study reveals the monthly spatial distribution of Temperature and Chlorophyll-a at Kalpakkam. Transect based in-situ Temperature and Chlorophyll-a collected at 200m, 500m and 1 km distance into the sea was interpolated using the Inverse Distance Weightage (IDW) method in ARC GIS. Data revealed the extent of spatial distribution of thermal effluent in Kalpakkam. It could be found that temperature range of 26.2 – 31.9°C provided substantial Chlorophyll-a concentration between 0.8 – 2.9 mg/m3 for surface and bottom waters. Further, increase of Chlorophyll-a levels did not lead to higher productivity. Combined temperature and chlorophyll a showed little synergistic effects. It is concluded that the effect of thermal discharge from the power plant into the receiving water body is quite localized and productivity of the coastal waters are not affected. From the results obtained, the spatial data has been found to be useful in determining zones of safe use of seawater and to understand the extent of relationship between the relatable parameters.
Impacts of climate change on the water availability, seasonality and extremes...asimjk
Projecting future hydrology for the mountainous, highly glaciated upper Indus basin (UIB) is a challenging task, because of uncertainties in the future climate projections and issues with the coverage and quality of available reference climatic data and hydrological modelling approaches. This study attempts to address these issues by utilizing tranthe semi-distributed hydrological model SWAT with new climate datasets with better spatial and altitudinal representation as well as a wider range of future climate forcing models (GCM_REG) from the CORDEX- project, to assess different aspects of future hydrology (mean flows, extremes and seasonal changes). Contour maps for the mean annual flow and actual evapotranspiration as a function of the downscaled projected mean annual precipitation and temperatures are produced which can serve as a “hands-on” forecast tool of the future hydrology. The overall results of these future SWAT- hydrological projections indicate similar trends of changes in magnitudes, seasonal patterns and extremes of the UIB- streamflows for almost all climate scenarios/models/periods -combinations analysed. In particular, all but one GCM_REG- model – the one predicting a very high future temperature rise - indicate mean annual flow increases throughout the 21st century, wherefore, interestingly, these are stronger for the middle (2041-2070) than at its end (2071-2100). The seasonal shifts as well as the extremes follow also similar trends for all climate scenarios/models/periods – combinations, e.g. an earlier future arrival (in May-June instead of July-August) of high flows and increased spring and winter flows, with upper flow extremes (peaks) projected to drastically increase by 50 to >100%, and this with significantly decreased annual recurrence intervals, i.e. a tremendously increased future flood hazard for the UIB. The future low flows projections also show more extreme values, with lower than nowadays-experienced minimal flows, occurring more frequently and also with much longer annual total duration.
Greetings all,
Nowadays, several datasets are -or will be- available in a near future to improve operational forecasting in most aspects, like the
ocean dynamics modeling, and the assimilation efficiency, that aims now to optimize the combination of temperature/salinity in
situ profiles, drifter's velocities, and sea surface height deduce from altimeter's data and GRACE or future Goce geoid. But also
strengthen forecasting system's applications, like the climate monitoring. For all these issues, an optimal use of ocean data,
always too sparse and not enough numerous, is mandatory.
Such studies are at the heart of this Newsletter issue. It begins with a Rio M.H. and Hernandez F. review of the Goce Mission,
dedicated to focus and document the shortest scales of the Earth's gravity field. Goce satellite is due to fly in December 2007.
With the next article Guinéhut S. and Larnicol G. investigate the influence of the in situ temperature profiles sampling on the
thermosteric sea level estimation. They show that the impact is not negligible, and can introduce large errors in the estimation. In
the second article, Benkiran M. and Greiner E. are evaluating the benefits of the drifter's velocities assimilation in the Mercator
Océan 1/3° Tropical and North Atlantic operational system. A description of the assimilation scheme upgrade to take into account
velocity control is given. Castruccio F. & al. describe in the third article the performance of an improved MDT reference for
altimetric data assimilation. They concentrate their study on the Tropical Pacific Ocean. Finally, the Newsletter comes to an end
with the Benkiran M. article. In his study, based on the 1/3° Mercator system, the impact of several altimeters data on the
assimilation performance is assessed
Have a good read
Impact of Future Climate Change on water availability in Kupang CityWillem Sidharno
Observed climate change could affect water availability in the future. Changes also
occurred Kupang city in recent decades, an increase in the magnitude of the damage caused
by drought due to climate change. In an attempt to explore the effects of drought can be
aggravated by climate change. in this paper, the author will be analyze impact of changes in
the water balance in Kupang city. To achieve that, the author will use the procedure consists
of two procedures: Temperature and precipitation are modeled under two typical emission
A1FI and B1 scenarios evaluated in this study for future projections in Kupang, discharge
simulations using rainfall Mock generated daily rainfall and water balance monthly Data
analysis WEAP (water Evaluation and Planning System) based simulation Mock. Due to the
significant uncertainty involved in forecasting future water consumption and water yield, the
author will use the three scenarios assumed water consumption and water three outcome
scenarios. Three scenarios of water consumption, ie, "Low", "Medium" and "High" in
accordance with the expected number of water consumption. Disposal obtained from mock
simulations during the simulation period. Finally, the water balance analysis conducted by
WEAP based on a combination of the three scenarios of water consumption. With this
procedure, it is possible to explore different scenarios of water consumption and water
results and the results of this study can be used to establish the proper planning to minimize
the impact of drought on water availability to support water requirement due to climate
change in Kupang city.
Greetings all,
This month’s newsletter is devoted to ocean indices aiming at a better understanding of the state of the ocean climate. Ocean
climate indices can be linked to major patterns of climate variability and usually have a significant social impact. The estimation of
the ocean climate indices along with their uncertainty is thus crucial: It gives an indication of our ability to measure the ocean. It is
as well a useful tool for decision making. Ocean climate indices also provide an at-a-glance overview of the state of the ocean
climate, and a way to talk to a wider audience about the ocean observing system. Several groups of experts are now working on
various ocean indicators using ocean forecast models, satellite data and reanalysis models in observing system simulation
experiments, among which the OOPC, NOAA and MERSEA/Boss4Gmes communities for example:
http://ioc3.unesco.org/oopc/state_of_the_ocean/index.php
http://www.cpc.ncep.noaa.gov/products/analysis_monitoring/enso_advisory/
http://www.aoml.noaa.gov/phod/cyclone/data/method.html
http://www.mersea.eu.org/Indicators-with-B4G.html
Scientific articles about Ocean indices in the present Newsletter are displayed as follows: The first article by Von Schuckmann et
al. is dealing with the estimation of global ocean indicators from a gridded hydrographic field. Then, Crosnier et al. are describing
the need to conduct intercomparison of model analyses and forecast in order for experts to provide a reliable scientific expertise
on ocean climate indicators. The next article by Coppini et al. is telling us about ocean indices computed from the Mediterranean
Forecasting System for the European Environment Agency and Boss4Gmes. Then Buarque et al. are revisiting the Tropical
Cyclone Heat Potential Index in order to better represent the ocean heat content that interacts with Hurricane. The last article by Greiner et al. is dealing with the assessment of robust ocean indicators and gives an example with oceanic predictors for the
Sahel precipitations.
The next July 2009 newsletter will review the current work on data assimilation and its techniques and progress for operational
oceanography.
We wish you a pleasant reading.
Forecasting long term global solar radiation with an ann algorithmmehmet şahin
and energy-efficient buildings, solar concentrators, photovoltaic-systems and a site-selection of sites for future
power plants). To establish long-term sustainability of solar energy, energy practitioners utilize versatile
predictive models of G as an indispensable decision-making tool. Notwithstanding this, sparsity of solar sites,
instrument maintenance, policy and fiscal issues constraint the availability of model input data that must be
used for forecasting the onsite value of G. To surmount these challenge, low-cost, readily-available satellite
products accessible over large spatial domains can provide viable alternatives. In this paper, the preciseness of
artificial neural network (ANN) for predictive modelling of G is evaluated for regional Queensland, which
employed Moderate Resolution Imaging Spectroradiometer (MODIS) land-surface temperature (LST) as an
effective predictor. To couple an ANN model with satellite-derived variable, the LST data over 2012–2014 are
acquired in seven groups, with three sites per group where the data for first two (2012–2013) are utilised for
model development and the third (2014) group for cross-validation. For monthly horizon, the ANN model is
optimized by trialing 55 neuronal architectures, while for seasonal forecasting, nine neuronal architectures are
trailed with time-lagged LST. ANN coupled with zero lagged LST utilised scaled conjugate gradient algorithm,
and while ANN with time-lagged LST utilised Levenberg-Marquardt algorithm. To ascertain conclusive results,
the objective model is evaluated via multiple linear regression (MLR) and autoregressive integrated moving
average (ARIMA) algorithms. Results showed that an ANN model outperformed MLR and ARIMA models
where an analysis yielded 39% of cumulative errors in smallest magnitude bracket, whereas MLR and ARIMA
produced 15% and 25%. Superiority of an ANN model was demonstrated by site-averaged (monthly) relative
error of 5.85% compared with 10.23% (MLR) and 9.60 (ARIMA) with Willmott's Index of 0.954 (ANN), 0.899
(MLR) and 0.848 (ARIMA). This work ascertains that an ANN model coupled with satellite-derived LST data
can be adopted as a qualified stratagem for the proliferation of solar energy applications in locations that have
an appropriate satellite footprint.
Data Preparation for Assessing Impact of Climate Change on Groundwater RechargeAM Publications
Climate change is a change in the statistical properties of the climate system when considered over long
periods of time. It significantly affects the various components of hydrological cycle like temperature, precipitation,
evapotranspiration and infiltration. All these components together affect the rate of groundwater recharge. So
understanding the effects of climate change on groundwater recharge is the need of time for the management of
groundwater resources. This paper presents the data preparation initiatives and a suitable methodology that can be
used to characterize the effect of climate change on groundwater recharge. The method is based on the hydrologic
model Visual HELP which can be used to estimate potential groundwater recharge at the regional scale. The success
of Modeling depends on the accuracy of data and the mode of collecting the data. Therefore, identifying the data
needs of a particular modeling study, collection/monitoring of required data and preparation of data set form an
integral part of any groundwater modeling exercise. The main objective of this paper is to describe the exact data
required and its preparation to simulate the groundwater recharge using HELP Model Software for Yavatmal as a
study area situated in Maharashtra state, India. The impact of climate change as a pilot study is modeled by using
computer software HELP (Hydrologic Evaluation of Landfill Performance). The initiatives for data preparation
presented herein may be useful to the researchers in this field.
The aim of this research is to utilize the new control algorithm of the sun tracker and the developed computer capabilities to improve the efficiency of tracking. The new tracking method installed on new innovative approach of water distillation taking advantage of high possible concentration of parabolic trough collector to reach a new level of daily harvest per square meter. Water distillation yield is predicted to score high percentage output of distillate due to the high temperature average about 40 degrees as maximum and 30 degrees as minimum. Also the high sunny hours about 9-12 hours per day. Mechanical system will be designed and tested for high ability to withstand the extra loading also some imperfections are forecasted. The present study may found more reliable and trusting techniques in tracking and water distillation. Saline water distillation as predicted will score a noticeable level because of the use of parabolic collector and promoted the efficiency. Keeping good temperature difference between vapor and condensation surface will increase the output and reduce the capacity of temperature. The mechanical design must be convenient to Sultanate Oman climate conditions and have to running, smoothly and safe.
Similar to A1 Renewability Assessment of the Reykjanes Geothermal System Gudni Axelsson (20)
GEORG Geothermal Workshop 2016
Presentation Title: Hydrogen Sulfide concentration in the vicinity of the Reykjavik Capital area due to two Geothermal Power Plants
GEORG Geothermal Workshop 2016
Presentation Title: Willingness to pay for the preservation of geothermal areas in Iceland – the contingent valuation studies of Eldvörp and Hverahl
GEORG Geothermal Workshop 2016
Presentation Title: Volcano-tectonostratigraphic characteristics of the Jan Mayen microcontinent and Iceland shelf area, lessons learned for geothermal exploration
Final project report on grocery store management system..pdfKamal Acharya
In today’s fast-changing business environment, it’s extremely important to be able to respond to client needs in the most effective and timely manner. If your customers wish to see your business online and have instant access to your products or services.
Online Grocery Store is an e-commerce website, which retails various grocery products. This project allows viewing various products available enables registered users to purchase desired products instantly using Paytm, UPI payment processor (Instant Pay) and also can place order by using Cash on Delivery (Pay Later) option. This project provides an easy access to Administrators and Managers to view orders placed using Pay Later and Instant Pay options.
In order to develop an e-commerce website, a number of Technologies must be studied and understood. These include multi-tiered architecture, server and client-side scripting techniques, implementation technologies, programming language (such as PHP, HTML, CSS, JavaScript) and MySQL relational databases. This is a project with the objective to develop a basic website where a consumer is provided with a shopping cart website and also to know about the technologies used to develop such a website.
This document will discuss each of the underlying technologies to create and implement an e- commerce website.
Saudi Arabia stands as a titan in the global energy landscape, renowned for its abundant oil and gas resources. It's the largest exporter of petroleum and holds some of the world's most significant reserves. Let's delve into the top 10 oil and gas projects shaping Saudi Arabia's energy future in 2024.
Student information management system project report ii.pdfKamal Acharya
Our project explains about the student management. This project mainly explains the various actions related to student details. This project shows some ease in adding, editing and deleting the student details. It also provides a less time consuming process for viewing, adding, editing and deleting the marks of the students.
About
Indigenized remote control interface card suitable for MAFI system CCR equipment. Compatible for IDM8000 CCR. Backplane mounted serial and TCP/Ethernet communication module for CCR remote access. IDM 8000 CCR remote control on serial and TCP protocol.
• Remote control: Parallel or serial interface.
• Compatible with MAFI CCR system.
• Compatible with IDM8000 CCR.
• Compatible with Backplane mount serial communication.
• Compatible with commercial and Defence aviation CCR system.
• Remote control system for accessing CCR and allied system over serial or TCP.
• Indigenized local Support/presence in India.
• Easy in configuration using DIP switches.
Technical Specifications
Indigenized remote control interface card suitable for MAFI system CCR equipment. Compatible for IDM8000 CCR. Backplane mounted serial and TCP/Ethernet communication module for CCR remote access. IDM 8000 CCR remote control on serial and TCP protocol.
Key Features
Indigenized remote control interface card suitable for MAFI system CCR equipment. Compatible for IDM8000 CCR. Backplane mounted serial and TCP/Ethernet communication module for CCR remote access. IDM 8000 CCR remote control on serial and TCP protocol.
• Remote control: Parallel or serial interface
• Compatible with MAFI CCR system
• Copatiable with IDM8000 CCR
• Compatible with Backplane mount serial communication.
• Compatible with commercial and Defence aviation CCR system.
• Remote control system for accessing CCR and allied system over serial or TCP.
• Indigenized local Support/presence in India.
Application
• Remote control: Parallel or serial interface.
• Compatible with MAFI CCR system.
• Compatible with IDM8000 CCR.
• Compatible with Backplane mount serial communication.
• Compatible with commercial and Defence aviation CCR system.
• Remote control system for accessing CCR and allied system over serial or TCP.
• Indigenized local Support/presence in India.
• Easy in configuration using DIP switches.
Hybrid optimization of pumped hydro system and solar- Engr. Abdul-Azeez.pdffxintegritypublishin
Advancements in technology unveil a myriad of electrical and electronic breakthroughs geared towards efficiently harnessing limited resources to meet human energy demands. The optimization of hybrid solar PV panels and pumped hydro energy supply systems plays a pivotal role in utilizing natural resources effectively. This initiative not only benefits humanity but also fosters environmental sustainability. The study investigated the design optimization of these hybrid systems, focusing on understanding solar radiation patterns, identifying geographical influences on solar radiation, formulating a mathematical model for system optimization, and determining the optimal configuration of PV panels and pumped hydro storage. Through a comparative analysis approach and eight weeks of data collection, the study addressed key research questions related to solar radiation patterns and optimal system design. The findings highlighted regions with heightened solar radiation levels, showcasing substantial potential for power generation and emphasizing the system's efficiency. Optimizing system design significantly boosted power generation, promoted renewable energy utilization, and enhanced energy storage capacity. The study underscored the benefits of optimizing hybrid solar PV panels and pumped hydro energy supply systems for sustainable energy usage. Optimizing the design of solar PV panels and pumped hydro energy supply systems as examined across diverse climatic conditions in a developing country, not only enhances power generation but also improves the integration of renewable energy sources and boosts energy storage capacities, particularly beneficial for less economically prosperous regions. Additionally, the study provides valuable insights for advancing energy research in economically viable areas. Recommendations included conducting site-specific assessments, utilizing advanced modeling tools, implementing regular maintenance protocols, and enhancing communication among system components.
Explore the innovative world of trenchless pipe repair with our comprehensive guide, "The Benefits and Techniques of Trenchless Pipe Repair." This document delves into the modern methods of repairing underground pipes without the need for extensive excavation, highlighting the numerous advantages and the latest techniques used in the industry.
Learn about the cost savings, reduced environmental impact, and minimal disruption associated with trenchless technology. Discover detailed explanations of popular techniques such as pipe bursting, cured-in-place pipe (CIPP) lining, and directional drilling. Understand how these methods can be applied to various types of infrastructure, from residential plumbing to large-scale municipal systems.
Ideal for homeowners, contractors, engineers, and anyone interested in modern plumbing solutions, this guide provides valuable insights into why trenchless pipe repair is becoming the preferred choice for pipe rehabilitation. Stay informed about the latest advancements and best practices in the field.
NO1 Uk best vashikaran specialist in delhi vashikaran baba near me online vas...Amil Baba Dawood bangali
Contact with Dawood Bhai Just call on +92322-6382012 and we'll help you. We'll solve all your problems within 12 to 24 hours and with 101% guarantee and with astrology systematic. If you want to take any personal or professional advice then also you can call us on +92322-6382012 , ONLINE LOVE PROBLEM & Other all types of Daily Life Problem's.Then CALL or WHATSAPP us on +92322-6382012 and Get all these problems solutions here by Amil Baba DAWOOD BANGALI
#vashikaranspecialist #astrologer #palmistry #amliyaat #taweez #manpasandshadi #horoscope #spiritual #lovelife #lovespell #marriagespell#aamilbabainpakistan #amilbabainkarachi #powerfullblackmagicspell #kalajadumantarspecialist #realamilbaba #AmilbabainPakistan #astrologerincanada #astrologerindubai #lovespellsmaster #kalajaduspecialist #lovespellsthatwork #aamilbabainlahore#blackmagicformarriage #aamilbaba #kalajadu #kalailam #taweez #wazifaexpert #jadumantar #vashikaranspecialist #astrologer #palmistry #amliyaat #taweez #manpasandshadi #horoscope #spiritual #lovelife #lovespell #marriagespell#aamilbabainpakistan #amilbabainkarachi #powerfullblackmagicspell #kalajadumantarspecialist #realamilbaba #AmilbabainPakistan #astrologerincanada #astrologerindubai #lovespellsmaster #kalajaduspecialist #lovespellsthatwork #aamilbabainlahore #blackmagicforlove #blackmagicformarriage #aamilbaba #kalajadu #kalailam #taweez #wazifaexpert #jadumantar #vashikaranspecialist #astrologer #palmistry #amliyaat #taweez #manpasandshadi #horoscope #spiritual #lovelife #lovespell #marriagespell#aamilbabainpakistan #amilbabainkarachi #powerfullblackmagicspell #kalajadumantarspecialist #realamilbaba #AmilbabainPakistan #astrologerincanada #astrologerindubai #lovespellsmaster #kalajaduspecialist #lovespellsthatwork #aamilbabainlahore #Amilbabainuk #amilbabainspain #amilbabaindubai #Amilbabainnorway #amilbabainkrachi #amilbabainlahore #amilbabaingujranwalan #amilbabainislamabad
Hierarchical Digital Twin of a Naval Power SystemKerry Sado
A hierarchical digital twin of a Naval DC power system has been developed and experimentally verified. Similar to other state-of-the-art digital twins, this technology creates a digital replica of the physical system executed in real-time or faster, which can modify hardware controls. However, its advantage stems from distributing computational efforts by utilizing a hierarchical structure composed of lower-level digital twin blocks and a higher-level system digital twin. Each digital twin block is associated with a physical subsystem of the hardware and communicates with a singular system digital twin, which creates a system-level response. By extracting information from each level of the hierarchy, power system controls of the hardware were reconfigured autonomously. This hierarchical digital twin development offers several advantages over other digital twins, particularly in the field of naval power systems. The hierarchical structure allows for greater computational efficiency and scalability while the ability to autonomously reconfigure hardware controls offers increased flexibility and responsiveness. The hierarchical decomposition and models utilized were well aligned with the physical twin, as indicated by the maximum deviations between the developed digital twin hierarchy and the hardware.
Planning Of Procurement o different goods and services
A1 Renewability Assessment of the Reykjanes Geothermal System Gudni Axelsson
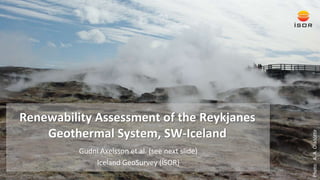
1. Renewability Assessment of the Reykjanes
Geothermal System, SW-Iceland
Gudni Axelsson et al. (see next slide)
Iceland GeoSurvey (ÍSOR)
2. GGW 2016
2
Gudni Axelsson et al.
Contributors
Iceland GeoSurvey (ÍSOR):
Gudni Axelsson, Egill Á. Gudnason, Ragna Karlsdóttir and Ingvar Th. Magnússon
Institute of Earth Sciences, University of Iceland:
Sigrún Hreinsdóttir, Karolina L. Michalczewska and Freysteinn Sigmundsson
Vatnaskil Consulting Engineers:
Andri Arnaldsson and Jean-Claude C. Berthet
GNS-Science, New Zealand:
Chris J. Bromley and Sigrún Hreinsdóttir
HS-Orka:
Ómar Sigurdsson
Financial support by the GEORG Research Fund in Iceland is acknowledged
3. Renewability of geothermal resources
Geothermal resources are generally classified as renewable
This is an oversimplification, classification is too simple
In essence of a double nature, i.e. a combination of:
a) energy current (through heat convection and conduction) and
b) vast stored energy
Renewability of these aspects is quite different:
a) energy current is steady and fully renewable
b) stored energy is renewed relatively slowly by heat conduction
Relative importance of the two components depends on both the geological
nature of a system and the rate of energy extraction during utilization
GGW 2016
3
Gudni Axelsson et al.
4. Project purpose
Main objective of project was to add significantly to the understanding of the
nature of geothermal resources
Particular emphasis on their recharge and mass balance under production, i.e.
to improve understanding of their renewability
Done through unifying analysis and modelling of data from different sources
Emphasis on the Reykjanes geothermal system in SW-Iceland
Purpose to evaluate the relative importance of the two renewability aspects
(energy current vs. stored energy) for the Reykjanes system, in particular,
under the current state of utilization
GGW 2016
4
Gudni Axelsson et al.
5. Project background
Based on compilation of reservoir
monitoring data, as well as collection and
analysis of micro-gravity and geodetic data
Consequently the data were jointly
interpreted
i) by simple modelling and
ii) by simulating data by an up-to-date
numerical reservoir model of the system
Also repeated TEM-resistivity surveying to
try to follow the growth of a steam-zone at
the top of the geothermal system
GGW 2016
5
Gudni Axelsson et al.
Photo courtesy of HS-Orka
6. Project phases
The project aimed to join together the results of several different scientific methods/
disciplines to address the issue in question, in particular the following methods:
A) High-resolution 3-D surface deformation monitoring (InSAR and GPS monitoring)
B) Micro-gravity monitoring
C) Repeated TEM (transient electromagnetic) resistivity surveying
D) Reservoir pressure- and temperature monitoring
E) Chemical content monitoring
F) Dynamic geothermal reservoir modelling, to jointly interpret data
GGW 2016
6
Gudni Axelsson et al.
8. Reykjanes development
GGW 2016
8
Gudni Axelsson et al.
Characterized by SW-NE striking tectonic and volcanic activity as well as
steam-vents, mud-pools and warm ground in an area of about 2 km2
Reservoir temperature 280 – 350°C
The reservoir fluid is hydrothermally modified sea-water
Development started as early as 1956 with shallow drilling
Seven wells drilled during 1968 – 1970; deepest well 1750 m
Followed by intermittent, small-scale industrial utilization; salt and sea-
mineral production along with fish drying
Exploration and development picked up again in 1998
Included drilling of 14 deep production wells
A 100 MWe capacity geothermal power plant commissioned in May 2006
9. Reykjanes production history
Average yearly mass
production from the
Reykjanes geothermal
system from 1970 up to
2013; the operation of the
100 MWe power-plant
started in 2006, while
significant reinjection
started in 2009
GGW 2016
9
Gudni Axelsson et al.
10. Reykjanes pressure decline
Pressure monitoring data
from wells at Reykjanes,
measured at a depth of
1500 m b.s.l.; most of the
data-points are measured
in production wells during
breaks in production while
some are measured in
observation wells, e.g. RN-
16 at the margin of the
main production field
GGW 2016
10
Gudni Axelsson et al.
11. GGW 2016
11
Gudni Axelsson et al.
Reykjanes subsidence
Subsidence in Reykjanes (RNES) and Svartsengi (SVAR) estimated from GPS
measurements spanning 1992 to 2014; GARD/GASK is shown here for reference
12. GGW 2016
12
Gudni Axelsson et al.
Reykjanes subsidence (cont.)
Average subsidence rate
from January 2009 to July
2013 in Reykjanes
estimated from the
combination of sets of
ascending and descending
TerraSAR-X InSAR
interferograms
13. GGW 2016
13
Gudni Axelsson et al.
Purpose of estimating the mass
changes in the geothermal system
during the period 2006–2010
Hence the renewal (recharge) of the
fluid reserves in the geothermal
system
Gravity surveys conducted during the
summers of 2004 (prior to the start-up
of the power plant), 2008 and 2010
Micro-gravity monitoring
14. GGW 2016
14
Gudni Axelsson et al.
Gravity change modelling
The analysis involved three main steps:
1) An estimation of the mass changes in the geothermal system through
a Gauss-integral of the observed gravity changes during two periods,
2004–2008 and 2008–2010; 30 – 50% during the latter period
2) A simulation of the gravity-change anomaly for 2008–2010 by two
simple mass change models; center of mass change at 1300 – 1700 m
depth
3) A calculation of gravity changes at the observation points of the
gravity grid on basis of mass changes in the numerical model of the
geothermal system – see next slides
See Gudnason et al. (WGC 2015)
15. GGW 2016
15
Gudni Axelsson et al.
Numerical reservoir model
A TOUGH2 model
Calibrated by various
reservoir data
Gravity changes due to
mass changes in the
model were calculated at
the observation points of
the gravity grid
Modelled anomaly
comparable to observed
one, not exactly however
16. Chemical content
GGW 2016
16
Gudni Axelsson et al.
No clear indications of major changes in chemical content of produced fluid (i.e. due to
colder recharge) have been observed to date in Reykjanes
This result can be used to estimate the minimum volume of the Reykjanes reservoir
On basis of the fluid volume extracted during the first 8 years of operation of the power
plant a volume of about 1.2 km3 is estimated (assuming a porosity of 10%)
Considerably less than the minimum estimated volume of the system, which is of the
order of 3 km3
This result, along with the limited recharge, likely explains why no chemical changes
have been observed so far
17. Main results
GGW 2016
17
Gudni Axelsson et al.
During 2008 – 2010 the renewal of reservoir fluid through recharge is estimated to
have been of the order of 30 – 50%, or about 250 ± 60 kg/s on average; the renewal for
2006 – 2008 is expected to have been correspondingly less
Rough mass-balance estimates based on the limited fluid renewal in the geothermal
system, during the current large-scale utilization, and the small size of the geothermal
system, show that reservoir fluid content may be depleted in some decades; this
identifies the need for substantial reinjection; associated research is ongoing
In spite of the limited size and recharge the energy in-place in the system is enormous;
it is estimated that only a small fraction (2%) will have been extracted after 100 years
under current extraction and recharge conditions
18. Conclusions/recommendations
GGW 2016
18
Gudni Axelsson et al.
Simple as well as finite-element modelling of observed deformation can further
constrain the mass change in, and the renewability of, the Reykjanes system
Gravity change data should be used as a direct calibration parameter in numerical
reservoir modelling, when possible
The ultimate goal is to set up one all-embracing model to simulate gravity change,
deformation and chemical data, along with all reservoir data, in a fully coupled
manner
Interpretation of the repeated TEM resistivity soundings indicates some shallow
changes due to the growth of steam cap of the Reykjanes system, supporting the
contention that resistivity methods may be a useful monitoring tool; in this case it
didn’t yield quantitative results