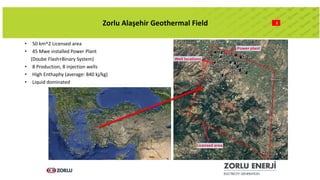
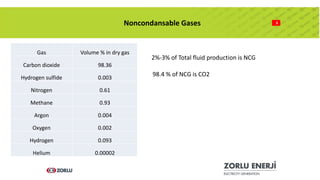
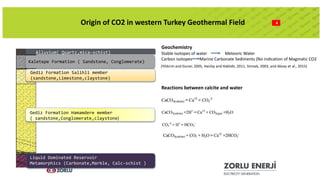
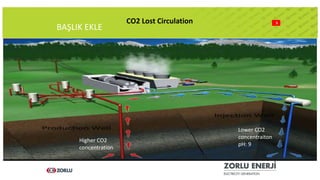
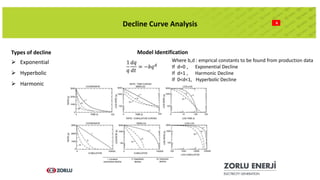
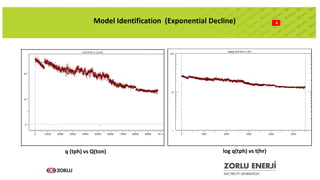
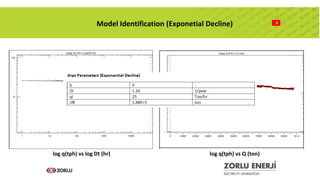
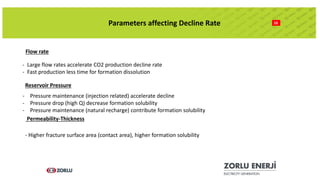
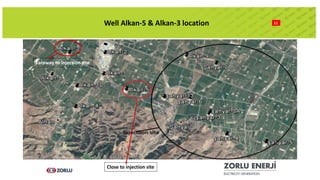
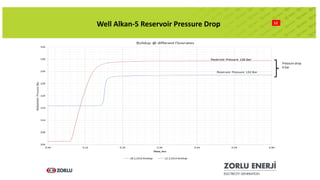
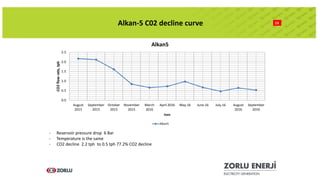
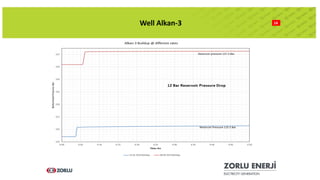
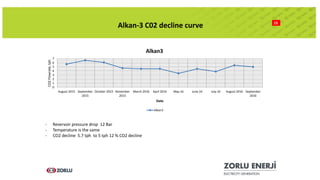
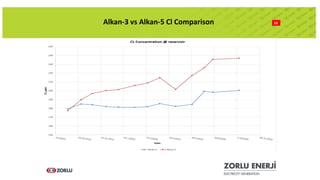
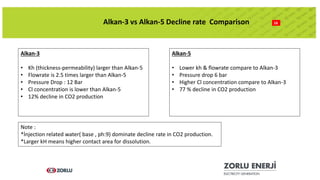
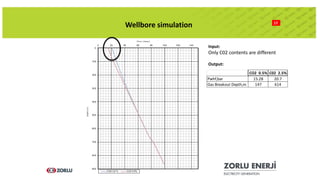
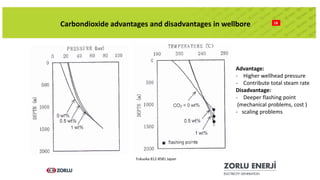
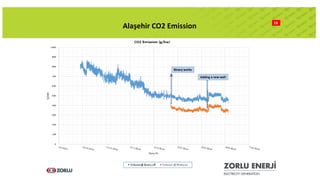
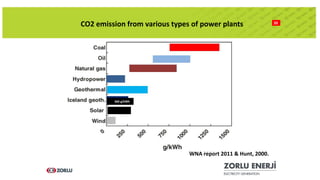
Overview of CO2 Production in Alaşehir
Geothermal Field, Manisa,Turkey
HAKKI AYDIN
Reservoir Engineer , Msc METU
1
 Alaşehir Geothermal Field
 Origin of CO2 in western Turkey geothermal field
 CO2 decline Curve Analysis of Alaşehir Field
 Parameters affecting CO2 decline
 Effects of CO2 decline in wellbore
 CO2 Emission from the field
Outline
2Zorlu Alaşehir Geothermal Field
• 50 km^2 Licensed area
• 45 Mwe installed Power Plant
(Doube Flash+Binary System)
• 8 Production, 8 injection wells
• High Enthaphy (average: 840 kj/kg)
• Liquid dominated
BAŞLIK EKLE
Metin ekle
3Noncondansable Gases
Gas Volume % in dry gas
Carbon dioxide 98.36
Hydrogen sulfide 0.003
Nitrogen 0.61
Methane 0.93
Argon 0.004
Oxygen 0.002
Hydrogen 0.093
Helium 0.00002
2%-3% of Total fluid production is NCG
98.4 % of NCG is CO2
Stable isotopes of water Meteoric Water
Carbon isotopes Marine Carbonate Sediments (No indication of Magmatic CO2
4Origin of CO2 in western Turkey Geothermal Field
Alluvium( Quartz,mica-schist)
Kaletepe Formation ( Sandstone, Conglomerate)
Gediz Formation Salihli member
(sandstone,Limestone,claystone)
Gediz Formation Hamamdere member
( sandstone,Conglomerate,claystone)
Liquid Dominated Reservoir
Metamorphics (Carbonate,Marble, Calc-schist )
Geochemistry
(Yildırım and Guner, 2005, Haizlip and Haklidir, 2011, Simsek, 2003, and Aksoy et al., 2015)
Reactions between calcite and water
Metin ekle
• Metin ekle
Metin ekle
• Metin ekle
BAŞLIK EKLE
5CO2 Lost Circulation
Higher CO2
concentration
Lower CO2
concentraiton
pH: 9
6
Decline Curve Analysis
Types of decline
 Exponential
 Hyperbolic
 Harmonic
Model Identification
Where b,d : emprical constants to be found from production data
If d=0 , Exponential Decline
If d=1 , Harmonic Decline
If 0<d<1, Hyperbolic Decline
8Model Identification (Exponential Decline)
q (tph) vs Q(ton) log q(tph) vs t(hr)
9Model Identification (Exponetial Decline)
log q(tph) vs log Dt (hr) log q(tph) vs Q (ton)
10Parameters affecting Decline Rate
Flow rate
- Large flow rates accelerate CO2 production decline rate
- Fast production less time for formation dissolution
Reservoir Pressure
- Pressure maintenance (injection related) accelerate decline
- Pressure drop (high Q) decrease formation solubility
- Pressure maintenance (natural recharge) contribute formation solubility
Permeability-Thickness
- Higher fracture surface area (contact area), higher formation solubility
11Well Alkan-5 & Alkan-3 location
Close to injection site
Faraway to injection site
12
Well Alkan-5 Reservoir Pressure Drop
Pressure drop
6 bar
13Alkan-5 C02 decline curve
0.0
0.5
1.0
1.5
2.0
2.5
August
2015
September
2015
October
2015
November
2015
March
2016
April 2016 May.16 June.16 July.16 August
2016
September
2016
CO2flowrate,tph
Date
Alkan5
Alkan5
- Reservoir pressure drop 6 Bar
- Temperature is the same
- CO2 decline 2.2 tph to 0.5 tph 77.2% CO2 decline
14Well Alkan-3
15
Alkan-3 C02 decline curve
0
1
2
3
4
5
6
7
August 2015 September
2015
October 2015 November
2015
March 2016 April 2016 May.16 June.16 July.16 August 2016 September
2016
CO2Flowrate,tph
Date
Alkan3
Alkan3
- Reservoir pressure drop 12 Bar
- Temperature is the same
- CO2 decline 5.7 tph to 5 tph 12 % CO2 decline
16Alkan-3 vs Alkan-5 Cl Comparison
16Alkan-3 vs Alkan-5 Decline rate Comparison
Alkan-3
• Kh (thickness-permeability) larger than Alkan-5
• Flowrate is 2.5 times larger than Alkan-5
• Pressure Drop : 12 Bar
• Cl concentration is lower than Alkan-5
• 12% decline in CO2 production
Alkan-5
• Lower kh & flowrate compare to Alkan-3
• Pressure drop 6 bar
• Higher Cl concentration compare to Alkan-3
• 77 % decline in CO2 production
Note :
*İnjection related water( base , ph:9) dominate decline rate in CO2 production.
*Larger kH means higher contact area for dissolution.
17
Wellbore simulation
Input:
Only C02 contents are different
Output:
CO2 0.5% C02 2.5%
Pwhf,bar 15.28 20.7
Gas Breakout Depth,m 147 614
18
Carbondioxide advantages and disadvantages in wellbore
Advantage:
- Higher wellhead pressure
- Contribute total steam rate
Disadvantage:
- Deeper flashing point
(mechanical problems, cost )
- scaling problems
Fukuoka 812-8581 Japan
19
Alaşehir CO2 Emission
Binary works
Adding a new well
20
CO2 emission from various types of power plants
WNA report 2011 & Hunt, 2000.
360 g/kWh
BAŞLIK
21
 Origin of CO2 in Alaşehir geothermal field: meteoric water and formation dissolution
 Exponential Decline Curve for CO2 decline rate
 Parameters affecting CO2 decline rate :
Reinjection water dominate wells’ CO2 decline rate
 Advantages of higher CO2 % in wellbore: High total steam rate, high Wellhead Pressure
 Disadvantage of higher CO2% in wellbore: Flashing point is deeper (long tubing
installation) high mechanical problems risk
 Gas emission in Alaşehir Geothermal Field is on the average of geothermal power plants
 Although Geothermal power plants release CO2 to atmosphere they are still much cleaner
than fossil fuels
ConclusionandComments
C2 Hakkı Aydın

C2 Hakkı Aydın

  • 1.
    Overview of CO2Production in Alaşehir Geothermal Field, Manisa,Turkey HAKKI AYDIN Reservoir Engineer , Msc METU
  • 2.
    1  Alaşehir GeothermalField  Origin of CO2 in western Turkey geothermal field  CO2 decline Curve Analysis of Alaşehir Field  Parameters affecting CO2 decline  Effects of CO2 decline in wellbore  CO2 Emission from the field Outline
  • 3.
    2Zorlu Alaşehir GeothermalField • 50 km^2 Licensed area • 45 Mwe installed Power Plant (Doube Flash+Binary System) • 8 Production, 8 injection wells • High Enthaphy (average: 840 kj/kg) • Liquid dominated
  • 4.
    BAŞLIK EKLE Metin ekle 3NoncondansableGases Gas Volume % in dry gas Carbon dioxide 98.36 Hydrogen sulfide 0.003 Nitrogen 0.61 Methane 0.93 Argon 0.004 Oxygen 0.002 Hydrogen 0.093 Helium 0.00002 2%-3% of Total fluid production is NCG 98.4 % of NCG is CO2
  • 5.
    Stable isotopes ofwater Meteoric Water Carbon isotopes Marine Carbonate Sediments (No indication of Magmatic CO2 4Origin of CO2 in western Turkey Geothermal Field Alluvium( Quartz,mica-schist) Kaletepe Formation ( Sandstone, Conglomerate) Gediz Formation Salihli member (sandstone,Limestone,claystone) Gediz Formation Hamamdere member ( sandstone,Conglomerate,claystone) Liquid Dominated Reservoir Metamorphics (Carbonate,Marble, Calc-schist ) Geochemistry (Yildırım and Guner, 2005, Haizlip and Haklidir, 2011, Simsek, 2003, and Aksoy et al., 2015) Reactions between calcite and water
  • 6.
    Metin ekle • Metinekle Metin ekle • Metin ekle BAŞLIK EKLE 5CO2 Lost Circulation Higher CO2 concentration Lower CO2 concentraiton pH: 9
  • 7.
    6 Decline Curve Analysis Typesof decline  Exponential  Hyperbolic  Harmonic Model Identification Where b,d : emprical constants to be found from production data If d=0 , Exponential Decline If d=1 , Harmonic Decline If 0<d<1, Hyperbolic Decline
  • 8.
    8Model Identification (ExponentialDecline) q (tph) vs Q(ton) log q(tph) vs t(hr)
  • 9.
    9Model Identification (ExponetialDecline) log q(tph) vs log Dt (hr) log q(tph) vs Q (ton)
  • 10.
    10Parameters affecting DeclineRate Flow rate - Large flow rates accelerate CO2 production decline rate - Fast production less time for formation dissolution Reservoir Pressure - Pressure maintenance (injection related) accelerate decline - Pressure drop (high Q) decrease formation solubility - Pressure maintenance (natural recharge) contribute formation solubility Permeability-Thickness - Higher fracture surface area (contact area), higher formation solubility
  • 11.
    11Well Alkan-5 &Alkan-3 location Close to injection site Faraway to injection site
  • 12.
    12 Well Alkan-5 ReservoirPressure Drop Pressure drop 6 bar
  • 13.
    13Alkan-5 C02 declinecurve 0.0 0.5 1.0 1.5 2.0 2.5 August 2015 September 2015 October 2015 November 2015 March 2016 April 2016 May.16 June.16 July.16 August 2016 September 2016 CO2flowrate,tph Date Alkan5 Alkan5 - Reservoir pressure drop 6 Bar - Temperature is the same - CO2 decline 2.2 tph to 0.5 tph 77.2% CO2 decline
  • 14.
  • 15.
    15 Alkan-3 C02 declinecurve 0 1 2 3 4 5 6 7 August 2015 September 2015 October 2015 November 2015 March 2016 April 2016 May.16 June.16 July.16 August 2016 September 2016 CO2Flowrate,tph Date Alkan3 Alkan3 - Reservoir pressure drop 12 Bar - Temperature is the same - CO2 decline 5.7 tph to 5 tph 12 % CO2 decline
  • 16.
    16Alkan-3 vs Alkan-5Cl Comparison
  • 17.
    16Alkan-3 vs Alkan-5Decline rate Comparison Alkan-3 • Kh (thickness-permeability) larger than Alkan-5 • Flowrate is 2.5 times larger than Alkan-5 • Pressure Drop : 12 Bar • Cl concentration is lower than Alkan-5 • 12% decline in CO2 production Alkan-5 • Lower kh & flowrate compare to Alkan-3 • Pressure drop 6 bar • Higher Cl concentration compare to Alkan-3 • 77 % decline in CO2 production Note : *İnjection related water( base , ph:9) dominate decline rate in CO2 production. *Larger kH means higher contact area for dissolution.
  • 18.
    17 Wellbore simulation Input: Only C02contents are different Output: CO2 0.5% C02 2.5% Pwhf,bar 15.28 20.7 Gas Breakout Depth,m 147 614
  • 19.
    18 Carbondioxide advantages anddisadvantages in wellbore Advantage: - Higher wellhead pressure - Contribute total steam rate Disadvantage: - Deeper flashing point (mechanical problems, cost ) - scaling problems Fukuoka 812-8581 Japan
  • 20.
    19 Alaşehir CO2 Emission Binaryworks Adding a new well
  • 21.
    20 CO2 emission fromvarious types of power plants WNA report 2011 & Hunt, 2000. 360 g/kWh
  • 22.
    BAŞLIK 21  Origin ofCO2 in Alaşehir geothermal field: meteoric water and formation dissolution  Exponential Decline Curve for CO2 decline rate  Parameters affecting CO2 decline rate : Reinjection water dominate wells’ CO2 decline rate  Advantages of higher CO2 % in wellbore: High total steam rate, high Wellhead Pressure  Disadvantage of higher CO2% in wellbore: Flashing point is deeper (long tubing installation) high mechanical problems risk  Gas emission in Alaşehir Geothermal Field is on the average of geothermal power plants  Although Geothermal power plants release CO2 to atmosphere they are still much cleaner than fossil fuels ConclusionandComments