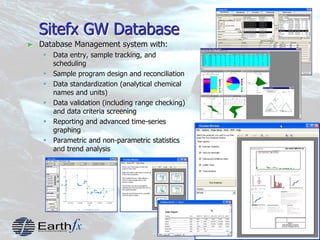
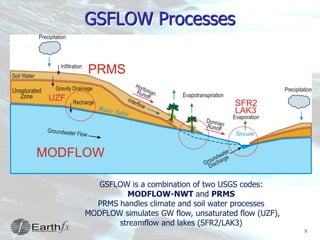
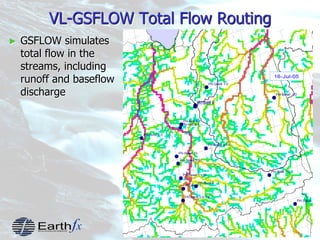
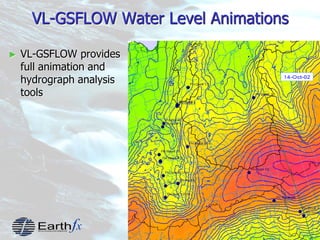
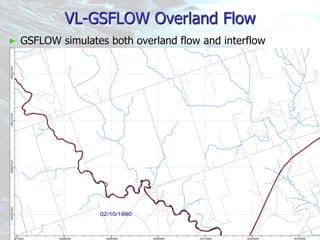
1
2
SiteFX
Environmental Data
Management System
3
Sitefx GW Database
► Database Management system with:
 Data entry, sample tracking, and
scheduling
 Sample program design and reconciliation
 Data standardization (analytical chemical
names and units)
 Data validation (including range checking)
and data criteria screening
 Reporting and advanced time-series
graphing
 Parametric and non-parametric statistics
and trend analysis
4
VIEWLOG
Hydrogeologic
Modelling System
5
VIEWLOG Borehole GIS
► VIEWLOG provides integrated data management,
visualization, analysis and modelling tools
 GIS, with intelligent, geo-science data objects
 Not just display, but meaningful data interaction
 Scalable interpretation tools, from a single fracture to
an entire watershed
 Open, flexible, database design, with dynamic
interaction with any table or query
► Over 700 users worldwide
Well Name: 34C
Elevation: 192.939
Metres Stratigraph
190
180
Overburden
Eramosa
6
VIEWLOG WebServer
► VIEWLOG Webserver provides data access for a
wide range of users
 Emphasis on ease of use
► On-line functions include:
 Interactive mapping
 Color contouring
 Borehole logs
 2-point cross sections
 Basic query select functions
 Time-series graphing
US Geologic Survey Web Site built using VIEWLOG/Webserver
7
VL-GSFLOW
Integrated GW/SW
Modelling System
8
VL-GSFLOW
► GSFLOW: an open-source, fully-integrated Surface Water and
Groundwater Modelling system
 Surface Water model based on PRMS
 Groundwater model based on MODFLOW-NWT
► Key VIEWLOG functions include:
 Pre- and Port Processor for creating GSFLOW input files and reading
GSFLOW outputs
 Time series analysis tools
 Gridded data animation tools
9
GSFLOW is a combination of two USGS codes:
MODFLOW-NWT and PRMS
PRMS handles climate and soil water processes
MODFLOW simulates GW flow, unsaturated flow (UZF),
streamflow and lakes (SFR2/LAK3)
GSFLOW Processes
10
VL-GSFLOW Total Flow Routing
► GSFLOW simulates
total flow in the
streams, including
runoff and baseflow
discharge
11
VL-GSFLOW Water Level Animations
► VL-GSFLOW provides
full animation and
hydrograph analysis
tools
12
VL-GSFLOW Overland Flow
► GSFLOW simulates both overland flow and interflow
13
Soil Zone Storage and Cascade
► GSFLOW can simulate the storage and 3D movement of
soil zone water using a cascading inter-cell network
Till uplands
Flow accumulates
in swales
14
Storage and 3D movement of water in the Soil Zone
► Soil zone moisture content
Beach Deposits
Till Upland
- Till uplands drain both vertically and downslope
- Lateral drainage to the beach deposits from the till uplands enhances recharge
- Soil zone storage helps supply rate limited GW recharge to the lower layers
15
Soil Zone Drainage (GW Recharge)
► When moisture is available (winter months) there is a near constant, but rate
limited, drainage from the soil zone
Beach DepositsTill Upland
16
VL-GSFLOW GW Recharge
► GSFLOW provides
ground water
recharge estimates
on a daily basis
17
GW Discharge to the Soil Zone (Daily)
Daily GW discharge to soil zone
18
Time-varying GW Feedback
► The “contributing area” that
generates true runoff
depends on the time-varying
position of the water table
► Example: Dunnian process
response area varies
seasonally between 5 and
25% of the study area
► Runoff occurs, but it is a
groundwater dependent
process!
19
Water Table Fluctuation across Layers
► Water Table rises and falls through multiple thin, variably saturated, layers
 Highly variable response to precipitation events
► GSFLOW NWT Solver – no dry cell problems!
Water Table
GW Discharge
20
MODFLOW-NWT stable even when modelling steep gradients
Shows daily, seasonal, and year-to-year response in heads
Limestone
Creek
Milton
Outlier
21
Simulated Stage in Reservoirs
OBSERVED PREDICTED
Kelso Lake
Hilton Falls
22
Simulated Heads in Wells
OBSERVED PREDICTED
PGMN Well W00008
Quarry Well BH-112
Mohawk Raceway Well – Opsteen Farm
23
Simulated Heads in Wellfield Monitors
OBSERVED PREDICTED
Campbellville – MW2/05B
Kelso
TW3/67
Kelso
TW4/67
Kelso wells out of phase with normal seasonal response.
Shows influence of high leakage from lake at summer stage
24
Wellfield response to Reservoir levels
Limestone
Creek
Milton
Outlier

Watertech Booth Slide 2013

  • 1.
  • 2.
  • 3.
    3 Sitefx GW Database ►Database Management system with:  Data entry, sample tracking, and scheduling  Sample program design and reconciliation  Data standardization (analytical chemical names and units)  Data validation (including range checking) and data criteria screening  Reporting and advanced time-series graphing  Parametric and non-parametric statistics and trend analysis
  • 4.
  • 5.
    5 VIEWLOG Borehole GIS ►VIEWLOG provides integrated data management, visualization, analysis and modelling tools  GIS, with intelligent, geo-science data objects  Not just display, but meaningful data interaction  Scalable interpretation tools, from a single fracture to an entire watershed  Open, flexible, database design, with dynamic interaction with any table or query ► Over 700 users worldwide Well Name: 34C Elevation: 192.939 Metres Stratigraph 190 180 Overburden Eramosa
  • 6.
    6 VIEWLOG WebServer ► VIEWLOGWebserver provides data access for a wide range of users  Emphasis on ease of use ► On-line functions include:  Interactive mapping  Color contouring  Borehole logs  2-point cross sections  Basic query select functions  Time-series graphing US Geologic Survey Web Site built using VIEWLOG/Webserver
  • 7.
  • 8.
    8 VL-GSFLOW ► GSFLOW: anopen-source, fully-integrated Surface Water and Groundwater Modelling system  Surface Water model based on PRMS  Groundwater model based on MODFLOW-NWT ► Key VIEWLOG functions include:  Pre- and Port Processor for creating GSFLOW input files and reading GSFLOW outputs  Time series analysis tools  Gridded data animation tools
  • 9.
    9 GSFLOW is acombination of two USGS codes: MODFLOW-NWT and PRMS PRMS handles climate and soil water processes MODFLOW simulates GW flow, unsaturated flow (UZF), streamflow and lakes (SFR2/LAK3) GSFLOW Processes
  • 10.
    10 VL-GSFLOW Total FlowRouting ► GSFLOW simulates total flow in the streams, including runoff and baseflow discharge
  • 11.
    11 VL-GSFLOW Water LevelAnimations ► VL-GSFLOW provides full animation and hydrograph analysis tools
  • 12.
    12 VL-GSFLOW Overland Flow ►GSFLOW simulates both overland flow and interflow
  • 13.
    13 Soil Zone Storageand Cascade ► GSFLOW can simulate the storage and 3D movement of soil zone water using a cascading inter-cell network Till uplands Flow accumulates in swales
  • 14.
    14 Storage and 3Dmovement of water in the Soil Zone ► Soil zone moisture content Beach Deposits Till Upland - Till uplands drain both vertically and downslope - Lateral drainage to the beach deposits from the till uplands enhances recharge - Soil zone storage helps supply rate limited GW recharge to the lower layers
  • 15.
    15 Soil Zone Drainage(GW Recharge) ► When moisture is available (winter months) there is a near constant, but rate limited, drainage from the soil zone Beach DepositsTill Upland
  • 16.
    16 VL-GSFLOW GW Recharge ►GSFLOW provides ground water recharge estimates on a daily basis
  • 17.
    17 GW Discharge tothe Soil Zone (Daily) Daily GW discharge to soil zone
  • 18.
    18 Time-varying GW Feedback ►The “contributing area” that generates true runoff depends on the time-varying position of the water table ► Example: Dunnian process response area varies seasonally between 5 and 25% of the study area ► Runoff occurs, but it is a groundwater dependent process!
  • 19.
    19 Water Table Fluctuationacross Layers ► Water Table rises and falls through multiple thin, variably saturated, layers  Highly variable response to precipitation events ► GSFLOW NWT Solver – no dry cell problems! Water Table GW Discharge
  • 20.
    20 MODFLOW-NWT stable evenwhen modelling steep gradients Shows daily, seasonal, and year-to-year response in heads Limestone Creek Milton Outlier
  • 21.
    21 Simulated Stage inReservoirs OBSERVED PREDICTED Kelso Lake Hilton Falls
  • 22.
    22 Simulated Heads inWells OBSERVED PREDICTED PGMN Well W00008 Quarry Well BH-112 Mohawk Raceway Well – Opsteen Farm
  • 23.
    23 Simulated Heads inWellfield Monitors OBSERVED PREDICTED Campbellville – MW2/05B Kelso TW3/67 Kelso TW4/67 Kelso wells out of phase with normal seasonal response. Shows influence of high leakage from lake at summer stage
  • 24.
    24 Wellfield response toReservoir levels Limestone Creek Milton Outlier