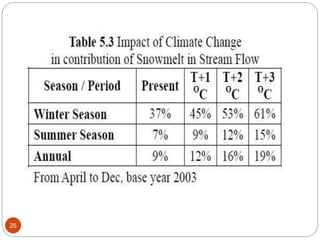
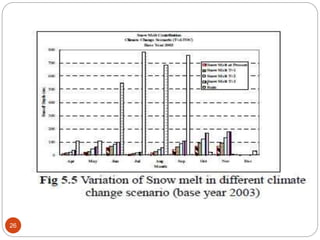
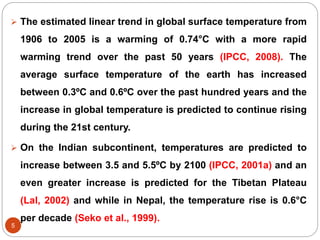
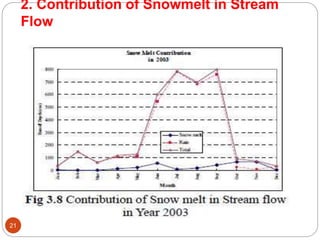
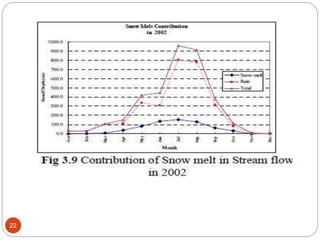
SlideShare a Scribd company logo
IMPACT OF CLIMATE CHANGE ON SNOWMELT
RUNOFF
by
Kailash Patel
(16WM60R07)
School of Water Resources
Indian Institute of Technology, Kharagpur
1
INTRODUCTION
2
 The Himalayas have the largest concentration of glaciers
out side the polar region and thus it is also known as
Third Pole of the earth.
 The cryosphere (consisting of snow, ice and frozen
ground) on land stores about 75% of the world’s
freshwater.
 The Himalayan range alone has a total area of 35,110
sq.km. of glaciers and ice cover with total ice reserves of
3735 cu.km which is equivalent to 3250 cu.km fresh
water (Qin, 2002 and IPCC, 2008) and it provides the 86
million cubic meter of water annually (Rao et al., 2007).
 The Himalayas, the water tower of the world is the
source of nine giant river systems of Asia are the water
lifeline for 500 million inhabitants of the region.
3
 While in Nepal, there are 3,252 glaciers that cover 5,323 sq.km
in area with estimated ice reserve of 481 cu.km and the Koshi
River Basin alone comprises 779 glaciers with an area of
1,409.84 sq.km and has an estimated ice reserve of 152.06
cu.km (Mool et al., 2001).
 The contribution of snow and glacial melt to the major rivers
in the region ranges from less than 5% to more than 45% of
the average flow (Jianchu et al., 2008).
 It has been estimated that some 225 billion cu.km of surface
water flows through Nepalese territory annually, which
amounts to about 118,200 m3/sq.km. This is about four times
the world average.
4
 The available surface runoff flows through more than 6,000 rivers
and rivulets, totaling about 45,000 km in length, having hydropower
potential of 83000 MW (Rao, 1996) and eventually drains to the
Ganges River in India through several river systems.
 Although about 14% of the catchments area of the Ganges lies in
Nepal, the contribution of Nepalese rivers to the Ganges is about
41% to the total runoff, and 71% of its lean season flow (Alfred,
1992).
 However, the runoff pattern has been significantly affected due to
the melt of the Himalayan ice and glaciers, the main sources of
Nepalese river systems, as a result of climate change i.e. change in
global temperature.
5
 The estimated linear trend in global surface temperature from
1906 to 2005 is a warming of 0.74°C with a more rapid
warming trend over the past 50 years (IPCC, 2008). The
average surface temperature of the earth has increased
between 0.3ºC and 0.6ºC over the past hundred years and the
increase in global temperature is predicted to continue rising
during the 21st century.
 On the Indian subcontinent, temperatures are predicted to
increase between 3.5 and 5.5ºC by 2100 (IPCC, 2001a) and an
even greater increase is predicted for the Tibetan Plateau
(Lal, 2002) and while in Nepal, the temperature rise is 0.6°C
per decade (Seko et al., 1999).
Objectives of the study
6
 TO ASSESS IMPACT OF THE CLIMATE CHANGE ON
SNOWMELT RUNOFF IN TAMAKOSHI BASIN IN NEPAL.
Review of literature
7
Author Year Remarks
Rao et al. 1999 Climate change is a major concern in the Himalayas
because of potential impacts on economy, ecology,
and environment of the Himalayas and areas
downstream.
Mula et al. 2000 Rapid degradation of these glaciers is likely to
seriously threaten water availability in the
region, particularly during lean flow seasons when
melt water contribution is crucial to sustain the
river flow which supports human activities and
ecosystem services in these areas and downstream.
8
Dyugerve and
Meier,
2003 Many Himalayan glaciers are retreating
faster than the world average and thinning
by 0.3~1 m/year .
Hasnain et al., 2004 The Rate of retreat for the Gongotri Glacier is
23 m/year which was more than three times
than the during the preceding 200 years.
Kadaota et al., 1997 Most glaciers studied in Nepal are undergoing
rapid de-glaciations with the reported rate of
glacial retreat ranges from several meters to 20
m/year
9
McCarthy et
al.,
2001 In the recent decades the ratio of solid
and liquid precipitation is decreasing due
to global warming .
hiratsuka, 2003 The increased liquid precipitation badly
affects on the water storage capacity of
mountains in two ways. Firstly, it will create a
direct runoff and possible flooding and
secondly it will accelerate the process of
ice/snow melting.
IPCC 2007 Thus changing climatic parameters have
doubled the adverse effects on the water
resources of the Nepalese Himalayas- firstly,
warmer temperature accelerates the glacier
retreat and secondly, the liquid precipitation
further accelerates the retreating of glacier.
Study area
10
11
 The study area is the Tamakoshi basin in Nepal.
 It is situated at about 90 km North East of Kathmandu.
 It is thelocated at headwater side of the Tamakoshi River.
 This river has annual runoff of 60.95m3/s, which is about 3.7% of the
runoff of the Koshi River.
 There are 404 glacier lakes, area of each of them more than 1,600 sq.m,
amounting to total lake area of about 7.92sq.km
 Most GLOF events risk in the Tamakoshi river basin may be of magnitude
more serious and devastating than that of meteorological floods. Owing to
large differences in the relief, the basin is characterized by diversified
climatic patterns.
 As the snowline is at about an elevation of about 4500m amsl, the
precipitation occurs mostly as snow fall above that elevation.
12
 This basin alone receives the total precipitation of 2000mm in
summer (from June to September). This is about 80% of annual
precipitation and most of precipitation occurs in the form of snow.
Data used in this study:
13
 Data used in this study are three type :
1. topographic
2. hydro – metrological
3. satellite images
METHODOLOGY
14
Models :
 Prediction of melting of snow and ice in a
glacierized basin is very important to estimate basin
discharge.
 In the Himalayan region, the main source of water is
glacier melt water which is closely related to summer
mass balance and snowmelt runoff form galcierized
basins.
 For simulating snowmelt runoff, there exist
numerous methodologies. These vary from the
simple system model i.e. index methods to more
physical based detailed energy balance approaches.
2. Model Structure (SRM)
15
 The model used in this study is positive degree-day index and used the SRM
model (Martinec et al., 2008) for snowmelt estimation and runoff simulation.
 In this model, the study basin is divided into number of elevation zones at rate of
500 m interval.
 The zonal area A, hypocentric elevation and snow covered area ASCA are
calculated for each zone.
 Based on the elevation of base station/s (where temperature and precipitation
are measured), hypocentric elevation of each zone and regional temperature
lapse rate, the temperature and precipitation are distributed at each elevation
zone.
 The form of precipitation is determined by considering the Critical Temperature
TCR for snowfall and the air temperature at each hypocentric elevation for each
zone.
16
 The snowmelt (MS in cm) is computed in each zone
with the input of snow cover area, temperature and
degree-day factor in each zone by temperature index
method :-
 Where;
a = degree-day factor (cm °/C/day),
T = daily average, (°C)
Tb = base temperature (°C)
Assessment of the Model Accuracy
17
SRM uses two well-established accuracy criteria, namely, the
coefficient of determination, R2, and the volume difference, Dv.
(Martinec and Rango 1998). The coefficient of determination is
computed as follows:
Where
Qi is the measured daily discharge.
Qi ' is the computed daily discharge.
Q is the average measured discharge of the given year
n = the number of daily discharge values.
Result and discussion :
18
1. Simulation
 The Study basin has the total area of 1759 sq.km with
altitude variation from 1964 to 7307 and gradient of 9.5%.
 The area of zones above the 4500 m elevation is 78% of
total area with the average annual temperature less than
00C and above 5000 m is 58% and -2.50 0C respectively
(see Table 5.1).
 Similarly the average annual snow coverage are 40.1% in
2003 and 41.8 % in 2002 with peak coverage of 58.9 % &
64.3 % and least coverage of 22.6 % & 25.5 % respectively
19
20
2. Contribution of Snowmelt in Stream
Flow
21
22
23
3. Impact of Climate Change :
 After the simulation has been done in the year 2003, this year is
taken as the base year to investigate the impact of climate change
(rising temperature) in the snow melt runoff.
 In climate change simulation in SRM, only the temperature is
changed from the ΔT 1, 2 and 3 0C, because there is no definite
trend of change in precipitation as described else where.
 The impact of climate change (i.e. temperature) is increasing
trend in stream flow with increased snow melt contribution
approximately at rate of 3% in annual and 8% in winter flow per
one degree centigrade temperature rise.
24
 The main factor of such increase in snowmelt contribution is
melting of snow and glacier in the basins.
 As shown in the Table 5.1 and explained in the simulation
section, there is 58% area of the total watershed above 5000m
amsl elevation where annual average temperature is less than
equal to -2.5°C and the snow coverage is more than 46%
average in year.
 As a result, though the temperature is raised up to 3oC, there will
be enhanced melting in the melting period while balanced snow
deposition in the accumulation period in the winter.
 That’s why the result of impact of climate change is as
anticipative.
25
26
Conclusion
27
 The result shows that The Positive Degree Day or Temperature Index
method coupled in Snowmelt Runoff Model, SRM can be well applied in
rugged and remote Himalayan basin like Upper Tamakoshi basin with
limited data.
 Required data are only the daily discharge, daily precipitation, daily
temperature and daily snow coverage (obtained from remote sensing i.e.
satellite image, aerial photos etc). The study area is glacierized basin
with more than 40% annual snow coverage.
 The contribution of snowmelt in stream flow is found as 17.5% in winter,
13% in summer and 13% in annual flow in the average from 2002 to
2003.
28
 The study demonstrates that the impact of climate
change (i.e. temperature) to stream flow is significant,
which is in increasing trend resulting from snow melt
contribution.
 Due to the snow melt contribution, stream flow
increases approximately at rate of 8% in winter, 3% in
summer and 3% in annual flow per one degree
centigrade temperature rise.
Output of this study
29
 The outputs of this study are important guidance for water
resources managers to make and implement appropriate
strategy for water resources management and hydropower
development.
 It is also useful tool for adoptive planning i.e. more and
efficient use of winter flow and mitigative and preventive
measure for high flood and GLOF.
30
Thank you

More Related Content

What's hot

Application of RS and GIS in Groundwater Prospects Zonation
Application of RS and GIS in Groundwater Prospects ZonationApplication of RS and GIS in Groundwater Prospects Zonation
Application of RS and GIS in Groundwater Prospects Zonation
Vishwanath Awati
 
Impact of Climate Change on Groundwater System
Impact of Climate Change on Groundwater SystemImpact of Climate Change on Groundwater System
Impact of Climate Change on Groundwater System
C. P. Kumar
 
Land Use and Land Cover change monitoring of Surajpur Wetland, Uttar Pradesh:...
Land Use and Land Cover change monitoring of Surajpur Wetland, Uttar Pradesh:...Land Use and Land Cover change monitoring of Surajpur Wetland, Uttar Pradesh:...
Land Use and Land Cover change monitoring of Surajpur Wetland, Uttar Pradesh:...
Arnab Saha
 
Applications of remote sensing and modelling in flood risk analysis and irrig...
Applications of remote sensing and modelling in flood risk analysis and irrig...Applications of remote sensing and modelling in flood risk analysis and irrig...
Applications of remote sensing and modelling in flood risk analysis and irrig...
International Water Management Institute (IWMI)
 
identification of ground water potential zones using gis and remote sensing
identification of ground water potential zones using gis and remote sensingidentification of ground water potential zones using gis and remote sensing
identification of ground water potential zones using gis and remote sensing
tp jayamohan
 
Drought Monitoring and Early Warning Indicators by Lucka Bogataj, University ...
Drought Monitoring and Early Warning Indicators by Lucka Bogataj, University ...Drought Monitoring and Early Warning Indicators by Lucka Bogataj, University ...
Drought Monitoring and Early Warning Indicators by Lucka Bogataj, University ...
Global Water Partnership Central and Eastern Europe
 
Surveying ii ajith sir class3
Surveying ii ajith sir class3Surveying ii ajith sir class3
Surveying ii ajith sir class3
SHAMJITH KM
 
Climate Change Impact Assessment on Hydrological Regime of Kali Gandaki Basin
Climate Change Impact Assessment on Hydrological Regime of Kali Gandaki BasinClimate Change Impact Assessment on Hydrological Regime of Kali Gandaki Basin
Climate Change Impact Assessment on Hydrological Regime of Kali Gandaki Basin
HI-AWARE
 
RS & GIS applications to manage irrigated agriculture
RS & GIS applications to manage irrigated agricultureRS & GIS applications to manage irrigated agriculture
RS & GIS applications to manage irrigated agriculture
International Water Management Institute (IWMI)
 
Site Suitability For Construction(Dam)
Site Suitability For Construction(Dam)Site Suitability For Construction(Dam)
Site Suitability For Construction(Dam)
Luv Singh
 
Disaster management using Remote sensing and GIS
Disaster management using Remote sensing and GISDisaster management using Remote sensing and GIS
Disaster management using Remote sensing and GIS
Harsh Singh
 
APPLICATIONS OF REMOTE SENSING AND GIS TECHNOLOGIES IN FLOOD RISK MANAGEMENT
APPLICATIONS OF REMOTE SENSING AND GIS TECHNOLOGIES IN FLOOD RISK MANAGEMENTAPPLICATIONS OF REMOTE SENSING AND GIS TECHNOLOGIES IN FLOOD RISK MANAGEMENT
APPLICATIONS OF REMOTE SENSING AND GIS TECHNOLOGIES IN FLOOD RISK MANAGEMENT
rsmahabir
 
Digital Elevation Models
Digital Elevation ModelsDigital Elevation Models
Digital Elevation Models
Bernd Flmla
 
Aerial photography vs remote sensing satellite
Aerial photography vs remote sensing satelliteAerial photography vs remote sensing satellite
Aerial photography vs remote sensing satellite
Sudipta Karmakar
 
LAND USE /LAND COVER CLASSIFICATION AND CHANGE DETECTION USING GEOGRAPHICAL I...
LAND USE /LAND COVER CLASSIFICATION AND CHANGE DETECTION USING GEOGRAPHICAL I...LAND USE /LAND COVER CLASSIFICATION AND CHANGE DETECTION USING GEOGRAPHICAL I...
LAND USE /LAND COVER CLASSIFICATION AND CHANGE DETECTION USING GEOGRAPHICAL I...
IAEME Publication
 
GIS software
GIS softwareGIS software
GIS software
Swetha A
 
Introdution to Landsat and Google Earth Engine
Introdution to Landsat and Google Earth EngineIntrodution to Landsat and Google Earth Engine
Introdution to Landsat and Google Earth EngineVeerachai Tanpipat
 
Remote Sensing: Change Detection
Remote Sensing: Change DetectionRemote Sensing: Change Detection
Remote Sensing: Change Detection
Kamlesh Kumar
 
Image enhancement technique digital image analysis, in remote sensing ,P K MANI
Image enhancement technique  digital image analysis, in remote sensing ,P K MANIImage enhancement technique  digital image analysis, in remote sensing ,P K MANI
Image enhancement technique digital image analysis, in remote sensing ,P K MANI
P.K. Mani
 
Scale of photograph (Aerial Photogrammetry)
Scale of photograph (Aerial Photogrammetry)Scale of photograph (Aerial Photogrammetry)
Scale of photograph (Aerial Photogrammetry)
Mr Amol Ghogare
 

What's hot (20)

Application of RS and GIS in Groundwater Prospects Zonation
Application of RS and GIS in Groundwater Prospects ZonationApplication of RS and GIS in Groundwater Prospects Zonation
Application of RS and GIS in Groundwater Prospects Zonation
 
Impact of Climate Change on Groundwater System
Impact of Climate Change on Groundwater SystemImpact of Climate Change on Groundwater System
Impact of Climate Change on Groundwater System
 
Land Use and Land Cover change monitoring of Surajpur Wetland, Uttar Pradesh:...
Land Use and Land Cover change monitoring of Surajpur Wetland, Uttar Pradesh:...Land Use and Land Cover change monitoring of Surajpur Wetland, Uttar Pradesh:...
Land Use and Land Cover change monitoring of Surajpur Wetland, Uttar Pradesh:...
 
Applications of remote sensing and modelling in flood risk analysis and irrig...
Applications of remote sensing and modelling in flood risk analysis and irrig...Applications of remote sensing and modelling in flood risk analysis and irrig...
Applications of remote sensing and modelling in flood risk analysis and irrig...
 
identification of ground water potential zones using gis and remote sensing
identification of ground water potential zones using gis and remote sensingidentification of ground water potential zones using gis and remote sensing
identification of ground water potential zones using gis and remote sensing
 
Drought Monitoring and Early Warning Indicators by Lucka Bogataj, University ...
Drought Monitoring and Early Warning Indicators by Lucka Bogataj, University ...Drought Monitoring and Early Warning Indicators by Lucka Bogataj, University ...
Drought Monitoring and Early Warning Indicators by Lucka Bogataj, University ...
 
Surveying ii ajith sir class3
Surveying ii ajith sir class3Surveying ii ajith sir class3
Surveying ii ajith sir class3
 
Climate Change Impact Assessment on Hydrological Regime of Kali Gandaki Basin
Climate Change Impact Assessment on Hydrological Regime of Kali Gandaki BasinClimate Change Impact Assessment on Hydrological Regime of Kali Gandaki Basin
Climate Change Impact Assessment on Hydrological Regime of Kali Gandaki Basin
 
RS & GIS applications to manage irrigated agriculture
RS & GIS applications to manage irrigated agricultureRS & GIS applications to manage irrigated agriculture
RS & GIS applications to manage irrigated agriculture
 
Site Suitability For Construction(Dam)
Site Suitability For Construction(Dam)Site Suitability For Construction(Dam)
Site Suitability For Construction(Dam)
 
Disaster management using Remote sensing and GIS
Disaster management using Remote sensing and GISDisaster management using Remote sensing and GIS
Disaster management using Remote sensing and GIS
 
APPLICATIONS OF REMOTE SENSING AND GIS TECHNOLOGIES IN FLOOD RISK MANAGEMENT
APPLICATIONS OF REMOTE SENSING AND GIS TECHNOLOGIES IN FLOOD RISK MANAGEMENTAPPLICATIONS OF REMOTE SENSING AND GIS TECHNOLOGIES IN FLOOD RISK MANAGEMENT
APPLICATIONS OF REMOTE SENSING AND GIS TECHNOLOGIES IN FLOOD RISK MANAGEMENT
 
Digital Elevation Models
Digital Elevation ModelsDigital Elevation Models
Digital Elevation Models
 
Aerial photography vs remote sensing satellite
Aerial photography vs remote sensing satelliteAerial photography vs remote sensing satellite
Aerial photography vs remote sensing satellite
 
LAND USE /LAND COVER CLASSIFICATION AND CHANGE DETECTION USING GEOGRAPHICAL I...
LAND USE /LAND COVER CLASSIFICATION AND CHANGE DETECTION USING GEOGRAPHICAL I...LAND USE /LAND COVER CLASSIFICATION AND CHANGE DETECTION USING GEOGRAPHICAL I...
LAND USE /LAND COVER CLASSIFICATION AND CHANGE DETECTION USING GEOGRAPHICAL I...
 
GIS software
GIS softwareGIS software
GIS software
 
Introdution to Landsat and Google Earth Engine
Introdution to Landsat and Google Earth EngineIntrodution to Landsat and Google Earth Engine
Introdution to Landsat and Google Earth Engine
 
Remote Sensing: Change Detection
Remote Sensing: Change DetectionRemote Sensing: Change Detection
Remote Sensing: Change Detection
 
Image enhancement technique digital image analysis, in remote sensing ,P K MANI
Image enhancement technique  digital image analysis, in remote sensing ,P K MANIImage enhancement technique  digital image analysis, in remote sensing ,P K MANI
Image enhancement technique digital image analysis, in remote sensing ,P K MANI
 
Scale of photograph (Aerial Photogrammetry)
Scale of photograph (Aerial Photogrammetry)Scale of photograph (Aerial Photogrammetry)
Scale of photograph (Aerial Photogrammetry)
 

Similar to snow runoff model

Climate change consideration in hydro‐power development in the nepal himalaya...
Climate change consideration in hydro‐power development in the nepal himalaya...Climate change consideration in hydro‐power development in the nepal himalaya...
Climate change consideration in hydro‐power development in the nepal himalaya...
Jagat K. Bhusal
 
Climate change paper-min_2
Climate change paper-min_2Climate change paper-min_2
Climate change paper-min_2Col Islam Ul Haq
 
Assessment of climate change impact on water availability of bilate watershed...
Assessment of climate change impact on water availability of bilate watershed...Assessment of climate change impact on water availability of bilate watershed...
Assessment of climate change impact on water availability of bilate watershed...
Alexander Decker
 
Glacier changes and climate trends derived from multiple sources in the data ...
Glacier changes and climate trends derived from multiple sources in the data ...Glacier changes and climate trends derived from multiple sources in the data ...
Glacier changes and climate trends derived from multiple sources in the data ...InfoAndina CONDESAN
 
Impact of Future Climate Change on water availability in Kupang City
Impact of Future Climate Change on water availability in Kupang CityImpact of Future Climate Change on water availability in Kupang City
Impact of Future Climate Change on water availability in Kupang City
Willem Sidharno
 
A climatology analysis of the petrie creek catchment maroochydore australia u...
A climatology analysis of the petrie creek catchment maroochydore australia u...A climatology analysis of the petrie creek catchment maroochydore australia u...
A climatology analysis of the petrie creek catchment maroochydore australia u...Alexander Decker
 
Modeling the water food-energy nexus in the arab world
Modeling the water food-energy nexus in the arab worldModeling the water food-energy nexus in the arab world
Modeling the water food-energy nexus in the arab world
International Food Policy Research Institute (IFPRI)
 
The Science of Climate Change r1.pdf
The Science of Climate Change r1.pdfThe Science of Climate Change r1.pdf
The Science of Climate Change r1.pdf
Keith_Shotbolt
 
PERMAFROST RUNOFF
PERMAFROST RUNOFFPERMAFROST RUNOFF
PERMAFROST RUNOFF
Shyam Mohan Chaudhary
 
Topic related to the Physical Science Basis of Climate Change
Topic related to the Physical Science Basis of Climate Change Topic related to the Physical Science Basis of Climate Change
Topic related to the Physical Science Basis of Climate Change
ipcc-media
 
Key messages from the AR5 WGI with focus on Saudi Arabia and the region
Key messages from the AR5 WGI with focus on Saudi Arabia and the regionKey messages from the AR5 WGI with focus on Saudi Arabia and the region
Key messages from the AR5 WGI with focus on Saudi Arabia and the region
Jesbin Baidya
 
An optimized snowmelt lysimeter system for monitoring melt rates and collecti...
An optimized snowmelt lysimeter system for monitoring melt rates and collecti...An optimized snowmelt lysimeter system for monitoring melt rates and collecti...
An optimized snowmelt lysimeter system for monitoring melt rates and collecti...
NOMADPOWER
 
Drivers and uncertainties in past and future sea level changes
Drivers and uncertainties in past and future sea level changesDrivers and uncertainties in past and future sea level changes
Drivers and uncertainties in past and future sea level changes
Hydrographic Society Benelux
 
Effect of global_warming_on_glaciers
Effect of global_warming_on_glaciersEffect of global_warming_on_glaciers
Effect of global_warming_on_glaciers
rvrizul
 
climate change.pptx.pdf
climate change.pptx.pdfclimate change.pptx.pdf
climate change.pptx.pdf
RISHABHJAIN27097
 
Climate change: Changes in the hydrosphere
Climate change: Changes in the hydrosphereClimate change: Changes in the hydrosphere
Climate change: Changes in the hydrosphere
cdenef
 

Similar to snow runoff model (20)

Climate change consideration in hydro‐power development in the nepal himalaya...
Climate change consideration in hydro‐power development in the nepal himalaya...Climate change consideration in hydro‐power development in the nepal himalaya...
Climate change consideration in hydro‐power development in the nepal himalaya...
 
Climate change paper-min_2
Climate change paper-min_2Climate change paper-min_2
Climate change paper-min_2
 
Assessment of climate change impact on water availability of bilate watershed...
Assessment of climate change impact on water availability of bilate watershed...Assessment of climate change impact on water availability of bilate watershed...
Assessment of climate change impact on water availability of bilate watershed...
 
1_Asokan and Dutta_HP_2008
1_Asokan and Dutta_HP_20081_Asokan and Dutta_HP_2008
1_Asokan and Dutta_HP_2008
 
Glacier changes and climate trends derived from multiple sources in the data ...
Glacier changes and climate trends derived from multiple sources in the data ...Glacier changes and climate trends derived from multiple sources in the data ...
Glacier changes and climate trends derived from multiple sources in the data ...
 
Overview of climate variability and climate change in GMS
Overview of climate variability and climate change in GMSOverview of climate variability and climate change in GMS
Overview of climate variability and climate change in GMS
 
Impact of Future Climate Change on water availability in Kupang City
Impact of Future Climate Change on water availability in Kupang CityImpact of Future Climate Change on water availability in Kupang City
Impact of Future Climate Change on water availability in Kupang City
 
A climatology analysis of the petrie creek catchment maroochydore australia u...
A climatology analysis of the petrie creek catchment maroochydore australia u...A climatology analysis of the petrie creek catchment maroochydore australia u...
A climatology analysis of the petrie creek catchment maroochydore australia u...
 
Modeling the water food-energy nexus in the arab world
Modeling the water food-energy nexus in the arab worldModeling the water food-energy nexus in the arab world
Modeling the water food-energy nexus in the arab world
 
The Science of Climate Change r1.pdf
The Science of Climate Change r1.pdfThe Science of Climate Change r1.pdf
The Science of Climate Change r1.pdf
 
PERMAFROST RUNOFF
PERMAFROST RUNOFFPERMAFROST RUNOFF
PERMAFROST RUNOFF
 
Topic related to the Physical Science Basis of Climate Change
Topic related to the Physical Science Basis of Climate Change Topic related to the Physical Science Basis of Climate Change
Topic related to the Physical Science Basis of Climate Change
 
Key messages from the AR5 WGI with focus on Saudi Arabia and the region
Key messages from the AR5 WGI with focus on Saudi Arabia and the regionKey messages from the AR5 WGI with focus on Saudi Arabia and the region
Key messages from the AR5 WGI with focus on Saudi Arabia and the region
 
An optimized snowmelt lysimeter system for monitoring melt rates and collecti...
An optimized snowmelt lysimeter system for monitoring melt rates and collecti...An optimized snowmelt lysimeter system for monitoring melt rates and collecti...
An optimized snowmelt lysimeter system for monitoring melt rates and collecti...
 
J027058063
J027058063J027058063
J027058063
 
Drivers and uncertainties in past and future sea level changes
Drivers and uncertainties in past and future sea level changesDrivers and uncertainties in past and future sea level changes
Drivers and uncertainties in past and future sea level changes
 
Effect of global_warming_on_glaciers
Effect of global_warming_on_glaciersEffect of global_warming_on_glaciers
Effect of global_warming_on_glaciers
 
GreenlandProject
GreenlandProjectGreenlandProject
GreenlandProject
 
climate change.pptx.pdf
climate change.pptx.pdfclimate change.pptx.pdf
climate change.pptx.pdf
 
Climate change: Changes in the hydrosphere
Climate change: Changes in the hydrosphereClimate change: Changes in the hydrosphere
Climate change: Changes in the hydrosphere
 

Recently uploaded

lab.123456789123456789123456789123456789
lab.123456789123456789123456789123456789lab.123456789123456789123456789123456789
lab.123456789123456789123456789123456789
Ghh
 
New Explore Careers and College Majors 2024.pdf
New Explore Careers and College Majors 2024.pdfNew Explore Careers and College Majors 2024.pdf
New Explore Careers and College Majors 2024.pdf
Dr. Mary Askew
 
RECOGNITION AWARD 13 - TO ALESSANDRO MARTINS.pdf
RECOGNITION AWARD 13 - TO ALESSANDRO MARTINS.pdfRECOGNITION AWARD 13 - TO ALESSANDRO MARTINS.pdf
RECOGNITION AWARD 13 - TO ALESSANDRO MARTINS.pdf
AlessandroMartins454470
 
一比一原版(UVic毕业证)维多利亚大学毕业证如何办理
一比一原版(UVic毕业证)维多利亚大学毕业证如何办理一比一原版(UVic毕业证)维多利亚大学毕业证如何办理
一比一原版(UVic毕业证)维多利亚大学毕业证如何办理
pxyhy
 
一比一原版(YU毕业证)约克大学毕业证如何办理
一比一原版(YU毕业证)约克大学毕业证如何办理一比一原版(YU毕业证)约克大学毕业证如何办理
一比一原版(YU毕业证)约克大学毕业证如何办理
yuhofha
 
Luke Royak's Personal Brand Exploration!
Luke Royak's Personal Brand Exploration!Luke Royak's Personal Brand Exploration!
Luke Royak's Personal Brand Exploration!
LukeRoyak
 
一比一原版(QU毕业证)皇后大学毕业证如何办理
一比一原版(QU毕业证)皇后大学毕业证如何办理一比一原版(QU毕业证)皇后大学毕业证如何办理
一比一原版(QU毕业证)皇后大学毕业证如何办理
yuhofha
 
'Guidance and counselling- role of Psychologist in Guidance and Counselling.
'Guidance and counselling- role of Psychologist in Guidance and Counselling.'Guidance and counselling- role of Psychologist in Guidance and Counselling.
'Guidance and counselling- role of Psychologist in Guidance and Counselling.
PaviBangera
 
Exploring Career Paths in Cybersecurity for Technical Communicators
Exploring Career Paths in Cybersecurity for Technical CommunicatorsExploring Career Paths in Cybersecurity for Technical Communicators
Exploring Career Paths in Cybersecurity for Technical Communicators
Ben Woelk, CISSP, CPTC
 
Digital Marketing Training In Bangalore
Digital  Marketing Training In BangaloreDigital  Marketing Training In Bangalore
Digital Marketing Training In Bangalore
nidm599
 
How to Master LinkedIn for Career and Business
How to Master LinkedIn for Career and BusinessHow to Master LinkedIn for Career and Business
How to Master LinkedIn for Career and Business
ideatoipo
 
一比一原版(TMU毕业证)多伦多都会大学毕业证如何办理
一比一原版(TMU毕业证)多伦多都会大学毕业证如何办理一比一原版(TMU毕业证)多伦多都会大学毕业证如何办理
一比一原版(TMU毕业证)多伦多都会大学毕业证如何办理
yuhofha
 
Personal Brand exploration KE.pdf for assignment
Personal Brand exploration KE.pdf for assignmentPersonal Brand exploration KE.pdf for assignment
Personal Brand exploration KE.pdf for assignment
ragingokie
 
Andrea Kate Portfolio Presentation.pdf
Andrea Kate  Portfolio  Presentation.pdfAndrea Kate  Portfolio  Presentation.pdf
Andrea Kate Portfolio Presentation.pdf
andreakaterasco
 
Midterm Contract Law and Adminstration.pptx
Midterm Contract Law and Adminstration.pptxMidterm Contract Law and Adminstration.pptx
Midterm Contract Law and Adminstration.pptx
Sheldon Byron
 
DIGITAL MARKETING COURSE IN CHENNAI.pptx
DIGITAL MARKETING COURSE IN CHENNAI.pptxDIGITAL MARKETING COURSE IN CHENNAI.pptx
DIGITAL MARKETING COURSE IN CHENNAI.pptx
FarzanaRbcomcs
 
Full Sail_Morales_Michael_SMM_2024-05.pptx
Full Sail_Morales_Michael_SMM_2024-05.pptxFull Sail_Morales_Michael_SMM_2024-05.pptx
Full Sail_Morales_Michael_SMM_2024-05.pptx
mmorales2173
 
原版制作(RMIT毕业证书)墨尔本皇家理工大学毕业证在读证明一模一样
原版制作(RMIT毕业证书)墨尔本皇家理工大学毕业证在读证明一模一样原版制作(RMIT毕业证书)墨尔本皇家理工大学毕业证在读证明一模一样
原版制作(RMIT毕业证书)墨尔本皇家理工大学毕业证在读证明一模一样
atwvhyhm
 
The Impact of Artificial Intelligence on Modern Society.pdf
The Impact of Artificial Intelligence on Modern Society.pdfThe Impact of Artificial Intelligence on Modern Society.pdf
The Impact of Artificial Intelligence on Modern Society.pdf
ssuser3e63fc
 
Personal Brand Exploration Comedy Jxnelle.
Personal Brand Exploration Comedy Jxnelle.Personal Brand Exploration Comedy Jxnelle.
Personal Brand Exploration Comedy Jxnelle.
alexthomas971
 

Recently uploaded (20)

lab.123456789123456789123456789123456789
lab.123456789123456789123456789123456789lab.123456789123456789123456789123456789
lab.123456789123456789123456789123456789
 
New Explore Careers and College Majors 2024.pdf
New Explore Careers and College Majors 2024.pdfNew Explore Careers and College Majors 2024.pdf
New Explore Careers and College Majors 2024.pdf
 
RECOGNITION AWARD 13 - TO ALESSANDRO MARTINS.pdf
RECOGNITION AWARD 13 - TO ALESSANDRO MARTINS.pdfRECOGNITION AWARD 13 - TO ALESSANDRO MARTINS.pdf
RECOGNITION AWARD 13 - TO ALESSANDRO MARTINS.pdf
 
一比一原版(UVic毕业证)维多利亚大学毕业证如何办理
一比一原版(UVic毕业证)维多利亚大学毕业证如何办理一比一原版(UVic毕业证)维多利亚大学毕业证如何办理
一比一原版(UVic毕业证)维多利亚大学毕业证如何办理
 
一比一原版(YU毕业证)约克大学毕业证如何办理
一比一原版(YU毕业证)约克大学毕业证如何办理一比一原版(YU毕业证)约克大学毕业证如何办理
一比一原版(YU毕业证)约克大学毕业证如何办理
 
Luke Royak's Personal Brand Exploration!
Luke Royak's Personal Brand Exploration!Luke Royak's Personal Brand Exploration!
Luke Royak's Personal Brand Exploration!
 
一比一原版(QU毕业证)皇后大学毕业证如何办理
一比一原版(QU毕业证)皇后大学毕业证如何办理一比一原版(QU毕业证)皇后大学毕业证如何办理
一比一原版(QU毕业证)皇后大学毕业证如何办理
 
'Guidance and counselling- role of Psychologist in Guidance and Counselling.
'Guidance and counselling- role of Psychologist in Guidance and Counselling.'Guidance and counselling- role of Psychologist in Guidance and Counselling.
'Guidance and counselling- role of Psychologist in Guidance and Counselling.
 
Exploring Career Paths in Cybersecurity for Technical Communicators
Exploring Career Paths in Cybersecurity for Technical CommunicatorsExploring Career Paths in Cybersecurity for Technical Communicators
Exploring Career Paths in Cybersecurity for Technical Communicators
 
Digital Marketing Training In Bangalore
Digital  Marketing Training In BangaloreDigital  Marketing Training In Bangalore
Digital Marketing Training In Bangalore
 
How to Master LinkedIn for Career and Business
How to Master LinkedIn for Career and BusinessHow to Master LinkedIn for Career and Business
How to Master LinkedIn for Career and Business
 
一比一原版(TMU毕业证)多伦多都会大学毕业证如何办理
一比一原版(TMU毕业证)多伦多都会大学毕业证如何办理一比一原版(TMU毕业证)多伦多都会大学毕业证如何办理
一比一原版(TMU毕业证)多伦多都会大学毕业证如何办理
 
Personal Brand exploration KE.pdf for assignment
Personal Brand exploration KE.pdf for assignmentPersonal Brand exploration KE.pdf for assignment
Personal Brand exploration KE.pdf for assignment
 
Andrea Kate Portfolio Presentation.pdf
Andrea Kate  Portfolio  Presentation.pdfAndrea Kate  Portfolio  Presentation.pdf
Andrea Kate Portfolio Presentation.pdf
 
Midterm Contract Law and Adminstration.pptx
Midterm Contract Law and Adminstration.pptxMidterm Contract Law and Adminstration.pptx
Midterm Contract Law and Adminstration.pptx
 
DIGITAL MARKETING COURSE IN CHENNAI.pptx
DIGITAL MARKETING COURSE IN CHENNAI.pptxDIGITAL MARKETING COURSE IN CHENNAI.pptx
DIGITAL MARKETING COURSE IN CHENNAI.pptx
 
Full Sail_Morales_Michael_SMM_2024-05.pptx
Full Sail_Morales_Michael_SMM_2024-05.pptxFull Sail_Morales_Michael_SMM_2024-05.pptx
Full Sail_Morales_Michael_SMM_2024-05.pptx
 
原版制作(RMIT毕业证书)墨尔本皇家理工大学毕业证在读证明一模一样
原版制作(RMIT毕业证书)墨尔本皇家理工大学毕业证在读证明一模一样原版制作(RMIT毕业证书)墨尔本皇家理工大学毕业证在读证明一模一样
原版制作(RMIT毕业证书)墨尔本皇家理工大学毕业证在读证明一模一样
 
The Impact of Artificial Intelligence on Modern Society.pdf
The Impact of Artificial Intelligence on Modern Society.pdfThe Impact of Artificial Intelligence on Modern Society.pdf
The Impact of Artificial Intelligence on Modern Society.pdf
 
Personal Brand Exploration Comedy Jxnelle.
Personal Brand Exploration Comedy Jxnelle.Personal Brand Exploration Comedy Jxnelle.
Personal Brand Exploration Comedy Jxnelle.
 

snow runoff model

  • 1. IMPACT OF CLIMATE CHANGE ON SNOWMELT RUNOFF by Kailash Patel (16WM60R07) School of Water Resources Indian Institute of Technology, Kharagpur 1
  • 2. INTRODUCTION 2  The Himalayas have the largest concentration of glaciers out side the polar region and thus it is also known as Third Pole of the earth.  The cryosphere (consisting of snow, ice and frozen ground) on land stores about 75% of the world’s freshwater.  The Himalayan range alone has a total area of 35,110 sq.km. of glaciers and ice cover with total ice reserves of 3735 cu.km which is equivalent to 3250 cu.km fresh water (Qin, 2002 and IPCC, 2008) and it provides the 86 million cubic meter of water annually (Rao et al., 2007).  The Himalayas, the water tower of the world is the source of nine giant river systems of Asia are the water lifeline for 500 million inhabitants of the region.
  • 3. 3  While in Nepal, there are 3,252 glaciers that cover 5,323 sq.km in area with estimated ice reserve of 481 cu.km and the Koshi River Basin alone comprises 779 glaciers with an area of 1,409.84 sq.km and has an estimated ice reserve of 152.06 cu.km (Mool et al., 2001).  The contribution of snow and glacial melt to the major rivers in the region ranges from less than 5% to more than 45% of the average flow (Jianchu et al., 2008).  It has been estimated that some 225 billion cu.km of surface water flows through Nepalese territory annually, which amounts to about 118,200 m3/sq.km. This is about four times the world average.
  • 4. 4  The available surface runoff flows through more than 6,000 rivers and rivulets, totaling about 45,000 km in length, having hydropower potential of 83000 MW (Rao, 1996) and eventually drains to the Ganges River in India through several river systems.  Although about 14% of the catchments area of the Ganges lies in Nepal, the contribution of Nepalese rivers to the Ganges is about 41% to the total runoff, and 71% of its lean season flow (Alfred, 1992).  However, the runoff pattern has been significantly affected due to the melt of the Himalayan ice and glaciers, the main sources of Nepalese river systems, as a result of climate change i.e. change in global temperature.
  • 5. 5  The estimated linear trend in global surface temperature from 1906 to 2005 is a warming of 0.74°C with a more rapid warming trend over the past 50 years (IPCC, 2008). The average surface temperature of the earth has increased between 0.3ºC and 0.6ºC over the past hundred years and the increase in global temperature is predicted to continue rising during the 21st century.  On the Indian subcontinent, temperatures are predicted to increase between 3.5 and 5.5ºC by 2100 (IPCC, 2001a) and an even greater increase is predicted for the Tibetan Plateau (Lal, 2002) and while in Nepal, the temperature rise is 0.6°C per decade (Seko et al., 1999).
  • 6. Objectives of the study 6  TO ASSESS IMPACT OF THE CLIMATE CHANGE ON SNOWMELT RUNOFF IN TAMAKOSHI BASIN IN NEPAL.
  • 7. Review of literature 7 Author Year Remarks Rao et al. 1999 Climate change is a major concern in the Himalayas because of potential impacts on economy, ecology, and environment of the Himalayas and areas downstream. Mula et al. 2000 Rapid degradation of these glaciers is likely to seriously threaten water availability in the region, particularly during lean flow seasons when melt water contribution is crucial to sustain the river flow which supports human activities and ecosystem services in these areas and downstream.
  • 8. 8 Dyugerve and Meier, 2003 Many Himalayan glaciers are retreating faster than the world average and thinning by 0.3~1 m/year . Hasnain et al., 2004 The Rate of retreat for the Gongotri Glacier is 23 m/year which was more than three times than the during the preceding 200 years. Kadaota et al., 1997 Most glaciers studied in Nepal are undergoing rapid de-glaciations with the reported rate of glacial retreat ranges from several meters to 20 m/year
  • 9. 9 McCarthy et al., 2001 In the recent decades the ratio of solid and liquid precipitation is decreasing due to global warming . hiratsuka, 2003 The increased liquid precipitation badly affects on the water storage capacity of mountains in two ways. Firstly, it will create a direct runoff and possible flooding and secondly it will accelerate the process of ice/snow melting. IPCC 2007 Thus changing climatic parameters have doubled the adverse effects on the water resources of the Nepalese Himalayas- firstly, warmer temperature accelerates the glacier retreat and secondly, the liquid precipitation further accelerates the retreating of glacier.
  • 11. 11  The study area is the Tamakoshi basin in Nepal.  It is situated at about 90 km North East of Kathmandu.  It is thelocated at headwater side of the Tamakoshi River.  This river has annual runoff of 60.95m3/s, which is about 3.7% of the runoff of the Koshi River.  There are 404 glacier lakes, area of each of them more than 1,600 sq.m, amounting to total lake area of about 7.92sq.km  Most GLOF events risk in the Tamakoshi river basin may be of magnitude more serious and devastating than that of meteorological floods. Owing to large differences in the relief, the basin is characterized by diversified climatic patterns.  As the snowline is at about an elevation of about 4500m amsl, the precipitation occurs mostly as snow fall above that elevation.
  • 12. 12  This basin alone receives the total precipitation of 2000mm in summer (from June to September). This is about 80% of annual precipitation and most of precipitation occurs in the form of snow.
  • 13. Data used in this study: 13  Data used in this study are three type : 1. topographic 2. hydro – metrological 3. satellite images
  • 14. METHODOLOGY 14 Models :  Prediction of melting of snow and ice in a glacierized basin is very important to estimate basin discharge.  In the Himalayan region, the main source of water is glacier melt water which is closely related to summer mass balance and snowmelt runoff form galcierized basins.  For simulating snowmelt runoff, there exist numerous methodologies. These vary from the simple system model i.e. index methods to more physical based detailed energy balance approaches.
  • 15. 2. Model Structure (SRM) 15  The model used in this study is positive degree-day index and used the SRM model (Martinec et al., 2008) for snowmelt estimation and runoff simulation.  In this model, the study basin is divided into number of elevation zones at rate of 500 m interval.  The zonal area A, hypocentric elevation and snow covered area ASCA are calculated for each zone.  Based on the elevation of base station/s (where temperature and precipitation are measured), hypocentric elevation of each zone and regional temperature lapse rate, the temperature and precipitation are distributed at each elevation zone.  The form of precipitation is determined by considering the Critical Temperature TCR for snowfall and the air temperature at each hypocentric elevation for each zone.
  • 16. 16  The snowmelt (MS in cm) is computed in each zone with the input of snow cover area, temperature and degree-day factor in each zone by temperature index method :-  Where; a = degree-day factor (cm °/C/day), T = daily average, (°C) Tb = base temperature (°C)
  • 17. Assessment of the Model Accuracy 17 SRM uses two well-established accuracy criteria, namely, the coefficient of determination, R2, and the volume difference, Dv. (Martinec and Rango 1998). The coefficient of determination is computed as follows: Where Qi is the measured daily discharge. Qi ' is the computed daily discharge. Q is the average measured discharge of the given year n = the number of daily discharge values.
  • 18. Result and discussion : 18 1. Simulation  The Study basin has the total area of 1759 sq.km with altitude variation from 1964 to 7307 and gradient of 9.5%.  The area of zones above the 4500 m elevation is 78% of total area with the average annual temperature less than 00C and above 5000 m is 58% and -2.50 0C respectively (see Table 5.1).  Similarly the average annual snow coverage are 40.1% in 2003 and 41.8 % in 2002 with peak coverage of 58.9 % & 64.3 % and least coverage of 22.6 % & 25.5 % respectively
  • 19. 19
  • 20. 20
  • 21. 2. Contribution of Snowmelt in Stream Flow 21
  • 22. 22
  • 23. 23 3. Impact of Climate Change :  After the simulation has been done in the year 2003, this year is taken as the base year to investigate the impact of climate change (rising temperature) in the snow melt runoff.  In climate change simulation in SRM, only the temperature is changed from the ΔT 1, 2 and 3 0C, because there is no definite trend of change in precipitation as described else where.  The impact of climate change (i.e. temperature) is increasing trend in stream flow with increased snow melt contribution approximately at rate of 3% in annual and 8% in winter flow per one degree centigrade temperature rise.
  • 24. 24  The main factor of such increase in snowmelt contribution is melting of snow and glacier in the basins.  As shown in the Table 5.1 and explained in the simulation section, there is 58% area of the total watershed above 5000m amsl elevation where annual average temperature is less than equal to -2.5°C and the snow coverage is more than 46% average in year.  As a result, though the temperature is raised up to 3oC, there will be enhanced melting in the melting period while balanced snow deposition in the accumulation period in the winter.  That’s why the result of impact of climate change is as anticipative.
  • 25. 25
  • 26. 26
  • 27. Conclusion 27  The result shows that The Positive Degree Day or Temperature Index method coupled in Snowmelt Runoff Model, SRM can be well applied in rugged and remote Himalayan basin like Upper Tamakoshi basin with limited data.  Required data are only the daily discharge, daily precipitation, daily temperature and daily snow coverage (obtained from remote sensing i.e. satellite image, aerial photos etc). The study area is glacierized basin with more than 40% annual snow coverage.  The contribution of snowmelt in stream flow is found as 17.5% in winter, 13% in summer and 13% in annual flow in the average from 2002 to 2003.
  • 28. 28  The study demonstrates that the impact of climate change (i.e. temperature) to stream flow is significant, which is in increasing trend resulting from snow melt contribution.  Due to the snow melt contribution, stream flow increases approximately at rate of 8% in winter, 3% in summer and 3% in annual flow per one degree centigrade temperature rise.
  • 29. Output of this study 29  The outputs of this study are important guidance for water resources managers to make and implement appropriate strategy for water resources management and hydropower development.  It is also useful tool for adoptive planning i.e. more and efficient use of winter flow and mitigative and preventive measure for high flood and GLOF.