Download to read offline


![Parametric Investigation of Laser Cutting and Plasma Cutting Of Mild Steel E350 Material – A…
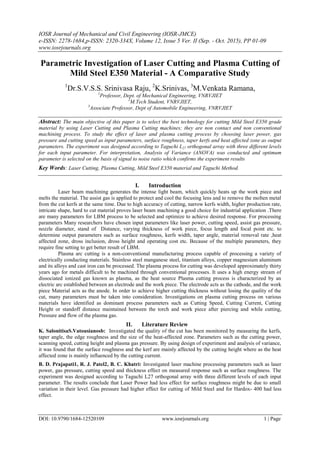
DOI: 10.9790/1684-12520109 www.iosrjournals.org 9 | Page
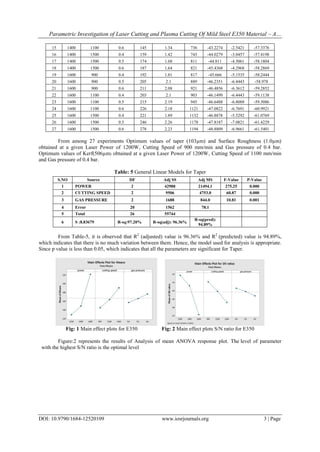
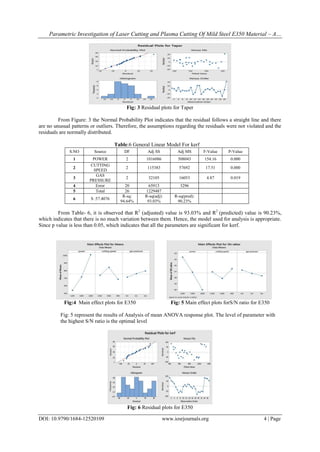
Table: 14 Structures of Heat Affected Zone of Laser and Plasma Cutting
Experiment
Number(EXP)
Laser cutting Plasma Cutting
EXP-1
Edge Middle Edge Middle
Exp-4 (Laser)
&
EXP-3 plasma
cutting
Edge Middle Edge Middle
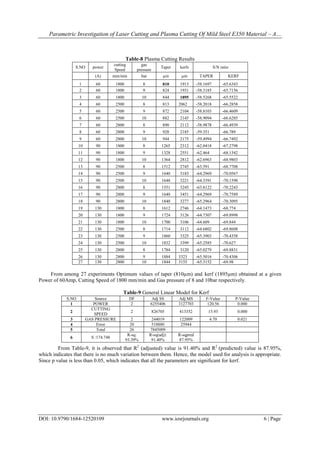
VI. Conclusion
This paper presents the Taguchi method for optimization of edge surface roughness, taper, kerf in laser
cutting and plasma cutting of Mild Steel E350 material, using oxygen as assist gas. Three laser and plasma
cutting parameters such as cutting speed, power and assist gas pressure were considered in the experiment that
was planned according to the Taguchi’s experimental design by using L27 orthogonal array. From the
experimental results, the following conclusions were made
The cutting performance of laser cutting is better than the plasma cutting
The cutting speed and power are the most significant parameters effecting the surface roughness, taper
and kerf where gas pressure is much smaller
It was observed that the cutting speed and power should be kept in low level and gas pressure should be
in intermediate level.
In plasma cutting, It was observed that the cutting speed and power should be kept in low level and gas
pressure should be in intermediate level.
Plasma Cutting machines have a significant advantage over laser machines in terms of acquisition cost,
maintenance and productivity
The confirmation experiments have shown that Taguchi parameter design can successfully verify the
optimum cutting parameters. The validation experiment confirmed that predicted model is adequate for
determining the optimum quality characteristic at 95%confidence level
References
[1]. B. D. Prajapati, R. J. Patel, B. C. Khatri(2013),Parametric Investigation of Co2 Laser Cutting of Mild Steel and Hardox-400 Material.
[2]. N. Rajendran, M.B. Pate, The effect of laser beam velocity on cut quality and surface temperature, American Society of Mechanical
Engineers
[3]. Salonitisa S. Vatousianos Experimental Investigation of the Plasma Arc Cutting Process
[4]. Yilbas et al. (1997) Laser cutting of steel sheets: Influence of work piece thickness and beam waist position on kerf size and stria
formation
[5]. L. Dahil comparision of advanced cutting techniques on hardox 500 steel material and the effect of structural properties of the material](https://image.slidesharecdn.com/a012520109-160726083307/85/A012520109-9-320.jpg)

This document presents a study comparing laser cutting and plasma cutting of mild steel E350 material. The study aims to select the best cutting technology and investigate the effects of process parameters on output responses. Laser power, cutting speed, and gas pressure were varied as input parameters, while surface roughness, kerf, taper, and heat affected zone were measured as output responses. Experiments were conducted according to a Taguchi L27 design of experiments. Analysis of variance found that all input parameters significantly affected the output responses. Laser cutting produced lower surface roughness and taper compared to plasma cutting for the material. Optimal parameters for laser cutting of mild steel were identified.