Download to read offline
![International Journal of Modern Engineering Research (IJMER)
www.ijmer.com Vol. 3, Issue. 4, Jul - Aug. 2013 pp-2166-2169 ISSN: 2249-6645
www.ijmer.com 2169 | Page
IV. CONCLUSION
The relative importance of the cutting parameters with respect to the pulse on time, pulse off time and current
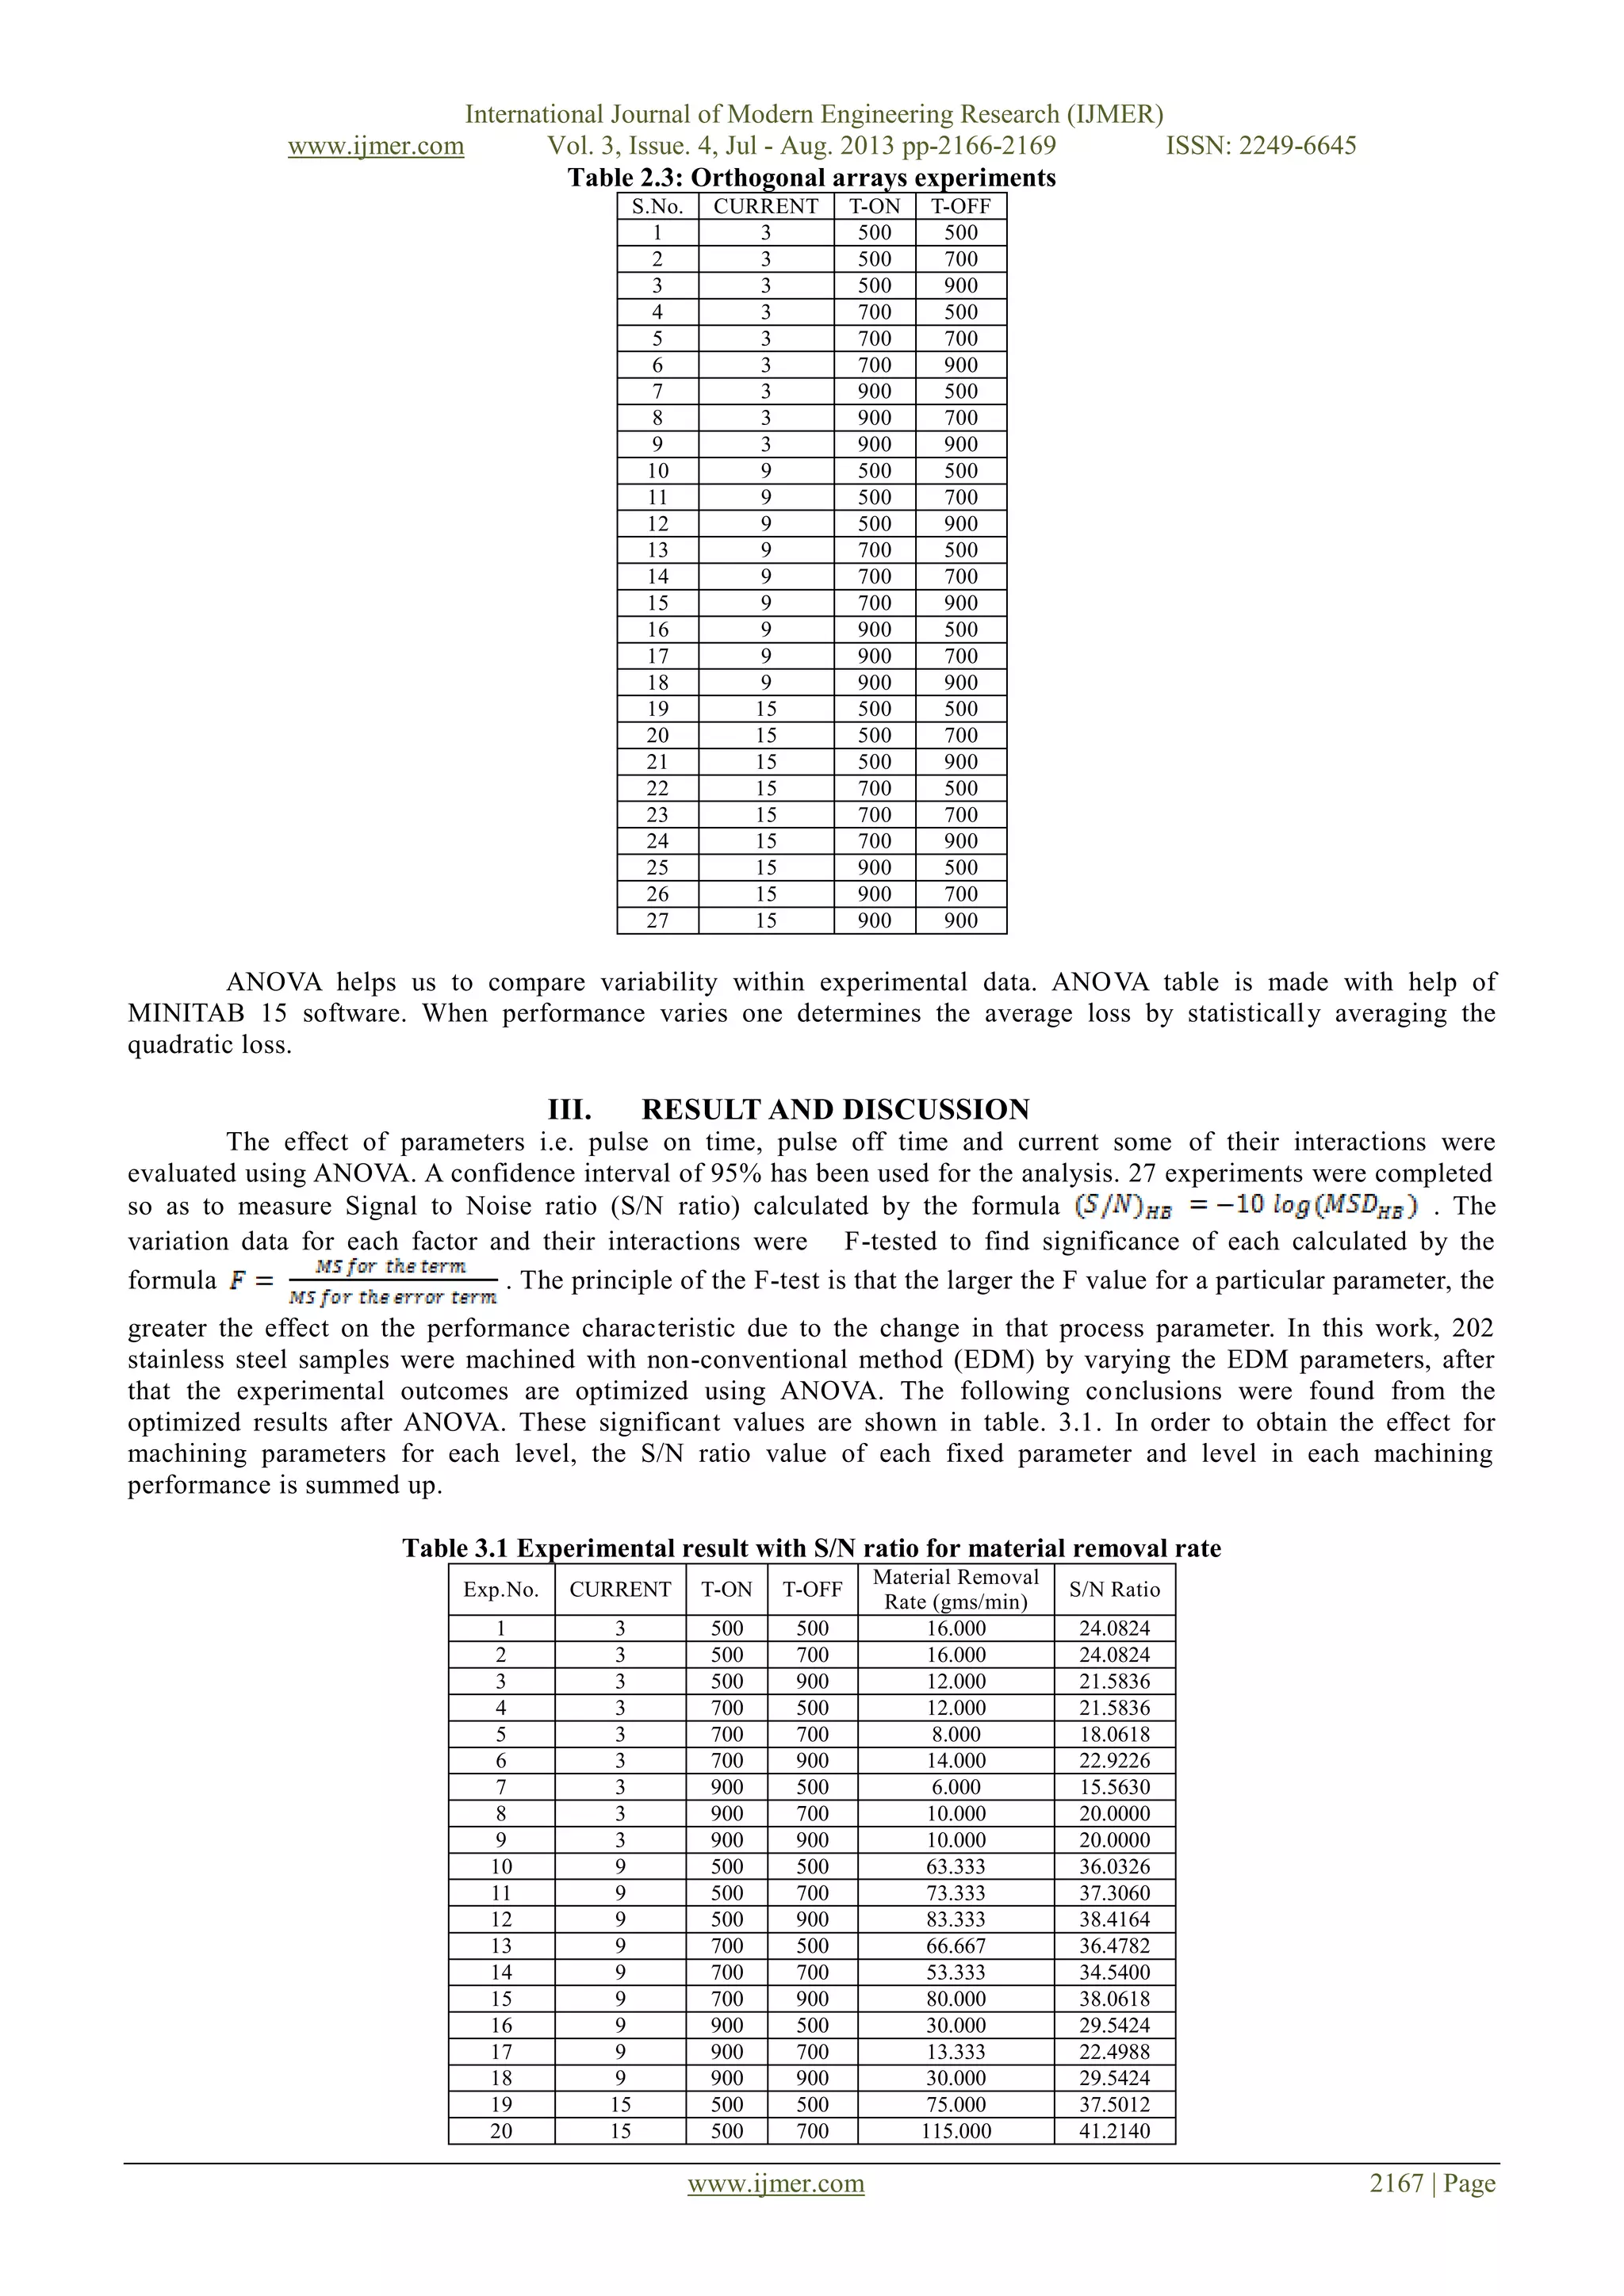
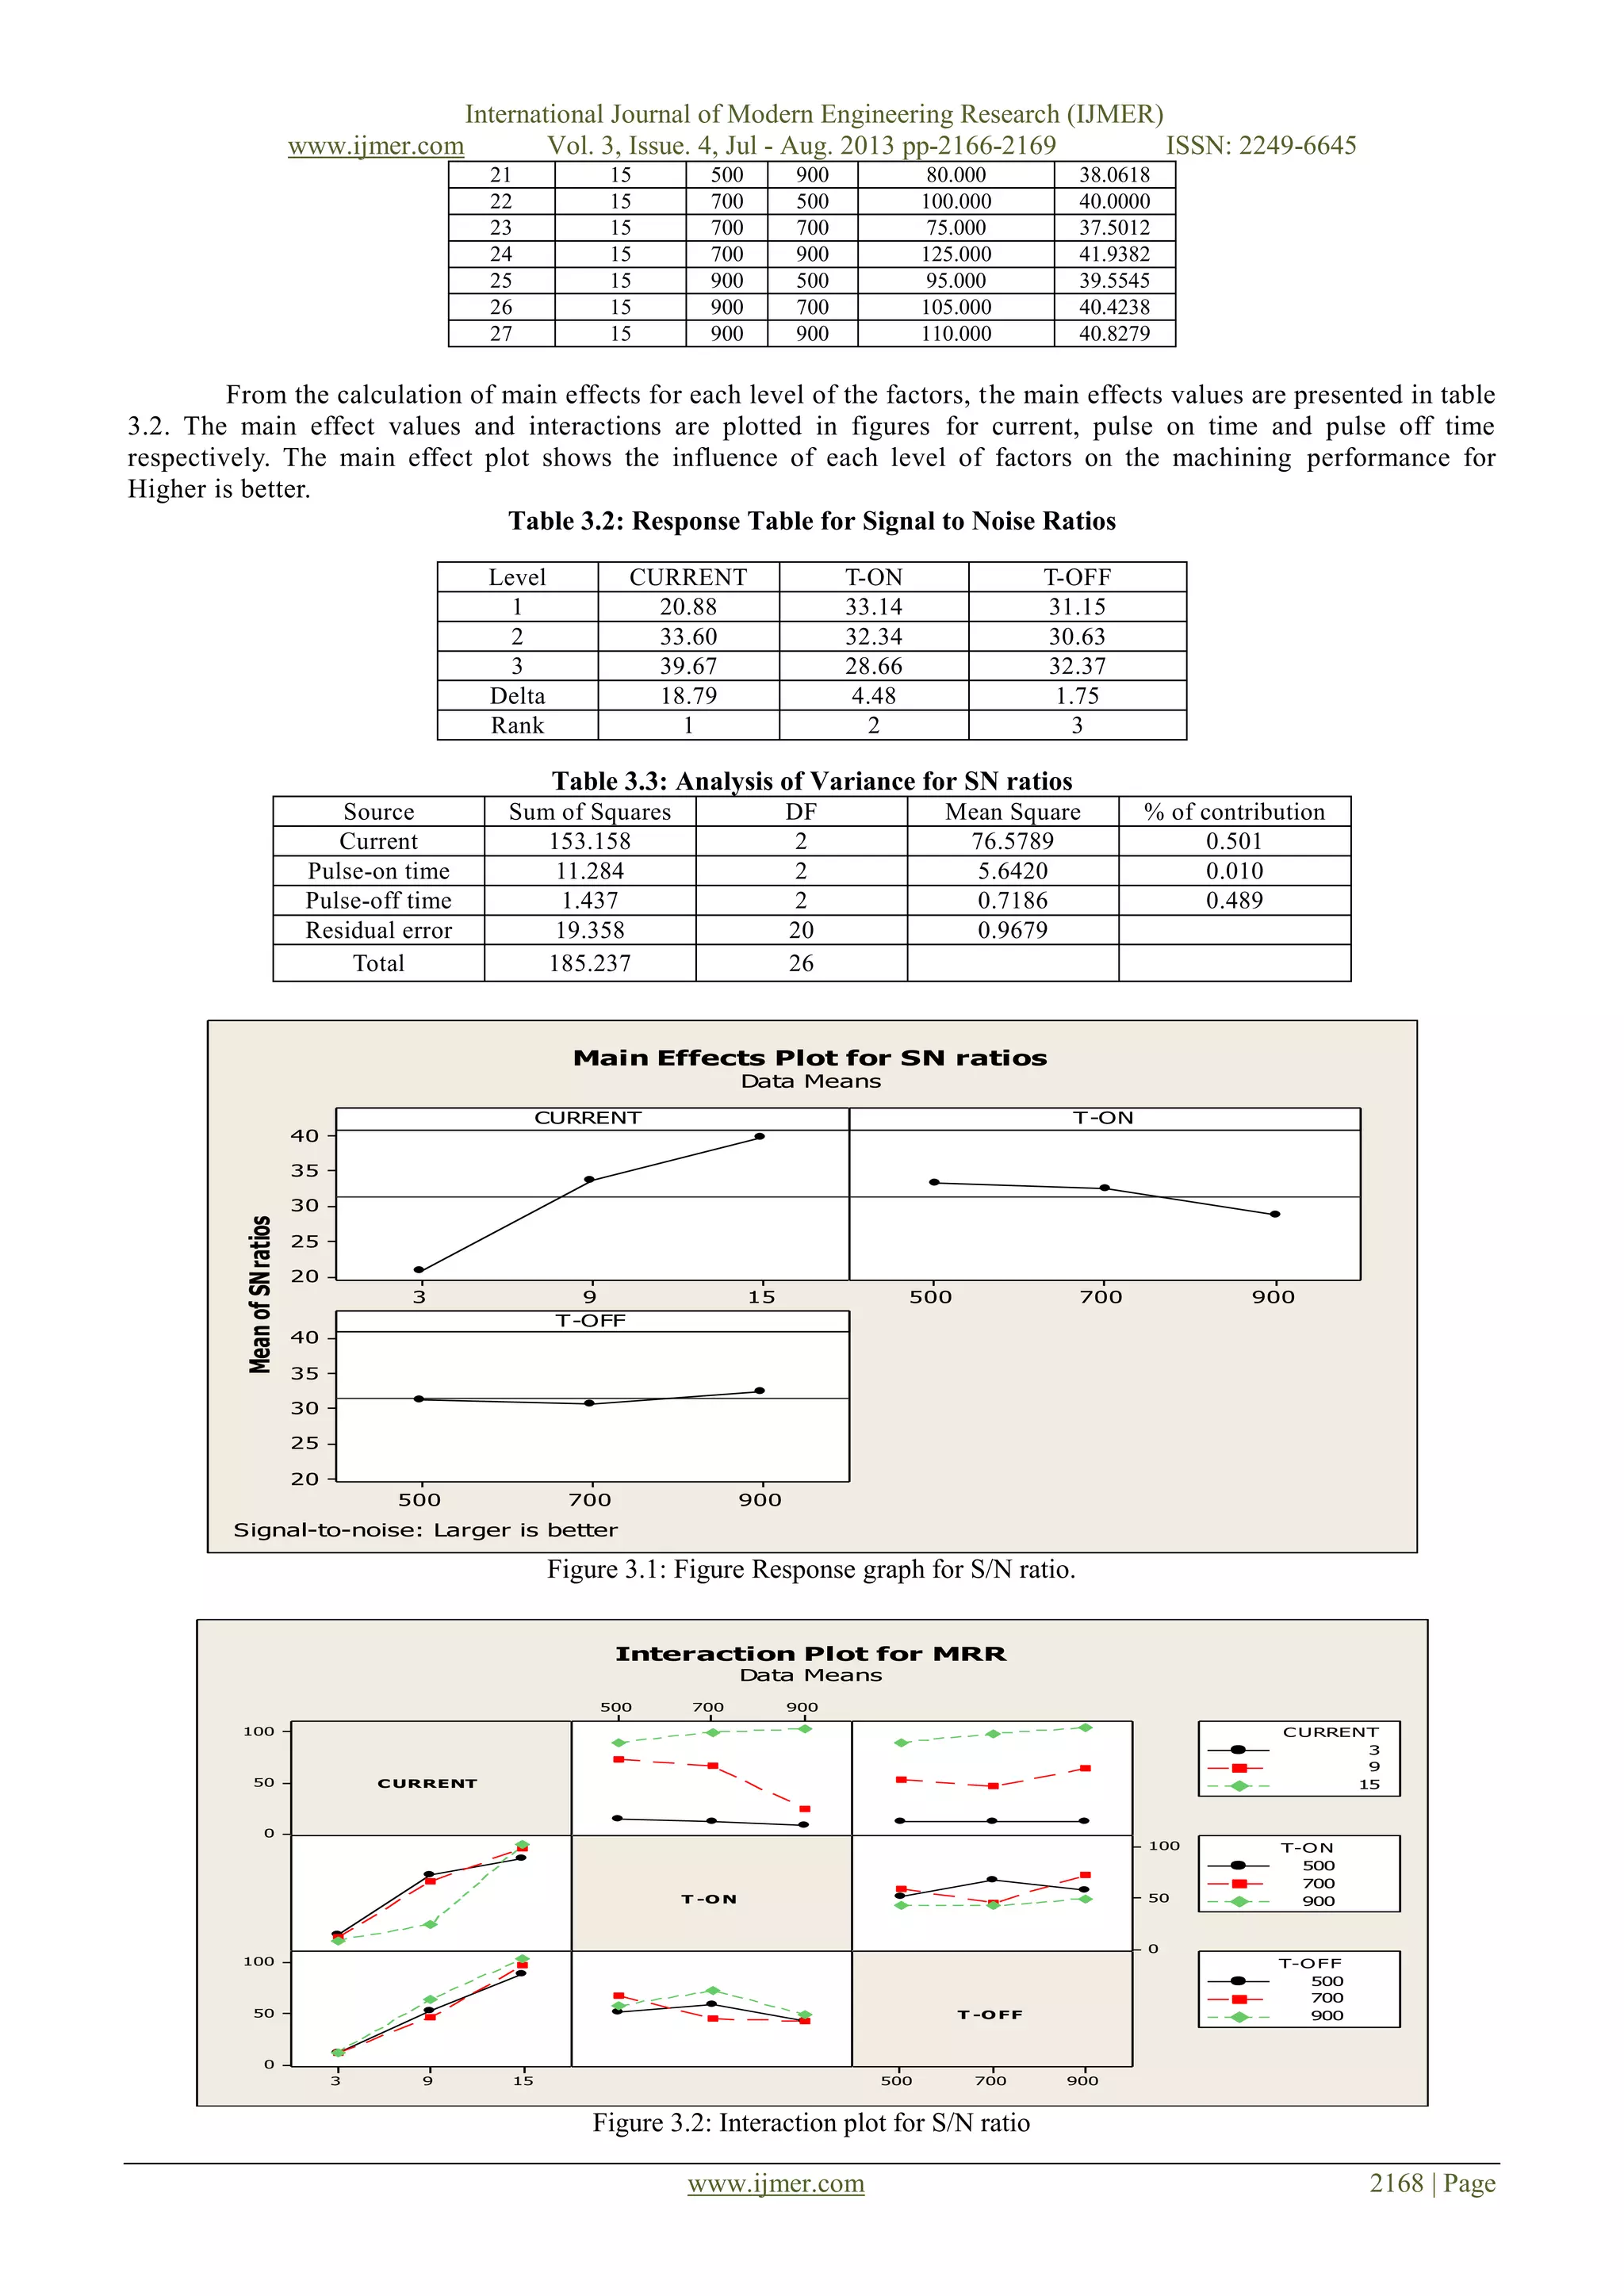
on MRR. From the analysis of the figures 3.1 & 2 and table 3.2 the optimal value for MRR is current 15A, pulse on
time 500µs and pulse off time 900 µs. The according to percentage contribution data current and pulse off time are the
affecting parameters.
REFERENCES
[1]. Habib, S. S., Study of the parameters in electrical discharge machining through response surface methodology
approach. App. Math. Model. 33, 2009. 4397-4407.
[2]. Haron, C.H Che., Ghani, J.A., Burhanuddin, Y., Seong, Y.K., S wee, C.Y., Copper and graphite electrodes
performance in electrical-discharge machining of XW42 tool steel. J. Mater. Process. Techno. 201, 2008. 570-573.
[3]. Kiyak, M., Cakir, O., 2007. Examination of machining parameters on surface roughness in EDM of tool steel. J.
Mater. Process.
[4]. Santanu Dey, Dr. D.C.Roy Experimental Study Using Different Tools/Electrodes E.G.Copper, Graphite on M.R.R of
E.D.M Process and Selecting The Best One for Maximum M.R.R in Optimum Condition International Journal of Modern
Engineering Research (IJMER) Vol.3, Issue.3, May-June. 2013 pp-1263-1267](https://image.slidesharecdn.com/by3421662169-130912040728-phpapp01/75/Optimization-of-machining-parameters-of-Electric-Discharge-Machining-for-202-stainless-steel-4-2048.jpg)

This document examines the effect of electrical discharge machining (EDM) parameters such as pulse-on time, pulse-off time, and current on the material removal rate (MRR) of 202 stainless steel. The study uses a design of experiments approach and analysis of variance (ANOVA) to identify optimal parameters for maximizing MRR while minimizing tool wear. Findings suggest that a current of 15A, pulse-on time of 500μs, and pulse-off time of 900μs yield the best machining performance.