Downloaded 14 times
![INTERNATIONAL JOURNALEngineering and TechnologyRESEARCH IN
International Journal of Advanced Research in OF ADVANCED (IJARET), ISSN 0976 –
6480(Print), ISSN 0976 – 6499(Online) Volume 4, Issue 1, January - February (2013), © IAEME
ENGINEERING AND TECHNOLOGY (IJARET)
ISSN 0976 - 6480 (Print)
ISSN 0976 - 6499 (Online)
IJARET
Volume 4, Issue 1, January- February (2013), pp. 142-150
© IAEME: www.iaeme.com/ijaret.asp ©IAEME
Journal Impact Factor (2012): 2.7078 (Calculated by GISI)
www.jifactor.com
PARAMETRIC OPTIMIZATION FOR CUTTING SPEED – A
STATISTICAL REGRESSION MODELING FOR WEDM
S V Subrahmanyam1, M. M. M. Sarcar2
1
Asst Professor, Dept of Mechanical Engg, GVP College of Engineering, Vizag, A.P. India
2
Professor and HOD of Mechanical Engg., A.U. College of Engineering, Vizag, A.P. India
ABSTRACT
Better finish, low tolerance, higher production rate, miniaturization, complex shapes
and profiles of the harder, newer, latest materials like hardened steel, titanium, high strength
temperature resistant alloy, fiber-reinforced composites and ceramics is the present demand
of the manufacturing industries such as Aerospace, nuclear, missile, turbine, automobile, tool
and die making. To satisfy these needs a different class of modern machining techniques,
unconventional in nature, like Wire Electrical discharge Machining (WEDM) emerged. In
WEDM the material removal takes place due to thermal erosion. In this process there is no
contact between the tool and work. In WEDM rough machining produces lesser accuracy and
surface finish, while finish machining produces less surface roughness with less speed. To get
optimum process parameters for higher cutting efficiency and accuracy is very difficult.
Hence, the objective of this paper is, to improve the Cutting Speed and to optimize the effects
of eight input process parameters on cutting speed during the machining of hot die steel (EN-
31) using Taguchi L27(38) orthogonal array (OA) as design of experiments (DOE).
Keywords: EN31, Cutting Speed, Orthogonal array, WEDM
I. INTRODUCTION
In WEDM the process of Metal erosion effect takes place when electric sparks are
generated between the work piece and a wire electrode flushed or immersed in the dielectric
fluid. The WEDM machining plays a major role in manufacturing sectors especially
industries like aerospace, ordinance, automobile and general engineering etc. WEDM
machining process parameters can be optimized by using taguchi method. Taguch method is
based on Orthogonal Array, which provides a set of experiments which are well balanced and
reduces variance for control parameters during the experimentation. Nihat Tosun et al [1] find
142](https://image.slidesharecdn.com/parametricoptimizationforcuttingspeedastatisticalregressionmodelingforwedm-130311000443-phpapp02/75/Parametric-optimization-for-cutting-speed-a-statistical-regression-modeling-for-wedm-1-2048.jpg)
![International Journal of Advanced Research in Engineering and Technology (IJARET), ISSN 0976 –
6480(Print), ISSN 0976 – 6499(Online) Volume 4, Issue 1, January - February (2013), © IAEME
on the effect and optimization of machining parameters on the notch and material removal
rate (MRR) in wire electrical discharge machining (WEDM) operations. Can Cogun [2] the
settings of machining parameters were determined by using taguchi experimental design
method. The level of importance of the machining parameters on the kerf and the MRR is
determined by using ANOVA. Amar Patnaik et al [3] Introducing zinc coated copper as
electrode tool with the process parameters of discharge current, pulse duration, pulse
frequency, wire speed, wire tension, dielectric flow rate. By using factors, maximization of
MRR and minimization of surface roughness is done in WEDM process using taguchi
method. H.Singh et al [4] analyze the effects of various input process parameters like pulse
on time, pulse off time, gap voltage, peak current , wire feed and wire tension have been
investigated and impact on MRR is obtained. Finally they reported MRR increase with
increase in pulse on time and peak current. MRR decrease with increase in pulse off time and
servo voltage. Wire feed and wire tension has no effect on MRR. Sarkar et al. [5] performed
experiments using +-titanium aluminide alloy as work material and then formulated
mathematical models to predict the cutting speed, SF and dimensional deviation as the
function of different control parameters. In WEDM operations, material removal rate (MRR)
determines the economics of machining and rate of production. In setting the machining
parameters, the main goal is the maximum MRR. The main purpose of this paper is to
investigate effects of machining parameters on the material removal rate of wire EDMed
En31 alloy steel. Hewidy et al [6] developed mathematical models correlating the various
WEDM machining parameters (peak current, duty factor, wire tension and water pressure)
with metal removal rate, wear ratio and surface roughness based on the response surface
methodology. A.K.M. Nurul Amin et al [7] Conducted experiments on cutting of tungsten
carbide ceramic using electro-discharge machining (EDM) with a graphite electrode by using
taguchi methodology
II. EXPERIMENTAL SET UP AND DATA COLLECTION
The experimental setup, design of experiment based on Taguchi Orthogonal Array
and the method of conducting experiments are discussed in this section.
2.1. Work Material and tool/cutting tool material
The experiments were conducted on EN 31 alloy steel material as a work piece. The
work piece material chemical composition of the is shown in Table 1. Brass wire of 0.25 mm
diameter was used as tool electrode in the experimental set up. This is a diffused wire of brass
of type ELECTRA_Duracut. 0.25 mm diameter stratified wire (Zinc coated copper wire) with
vertical configuration has been used and discarded once used. High MRR in WEDM without
wire breakage can be attained by the use of zinc coated copper wire because evaporation of
zinc causes cooling at the interface of work piece and wire and a coating of zinc oxide on the
surface of wire helps to prevent short-circuits (Sho et al., 1989).
Table 1: the chemical composition of EN31 Alloy steel.
Material C Cr Mn Si Fe
EN31 0.95 1.45 0.60 0.22 Balance %wt
143](https://image.slidesharecdn.com/parametricoptimizationforcuttingspeedastatisticalregressionmodelingforwedm-130311000443-phpapp02/75/Parametric-optimization-for-cutting-speed-a-statistical-regression-modeling-for-wedm-2-2048.jpg)
![International Journal of Advanced Research in Engineering and Technology (IJARET), ISSN 0976 –
6480(Print), ISSN 0976 – 6499(Online) Volume 4, Issue 1, January - February (2013), © IAEME
REFERENCES
[1] N. Tosun, C. Cogun, G. Tosun, A study on kerf and material removal rate in wire
electrical discharge machining based on Taguchi method, Journal of Materials Processing
Technology 152 (2004) 316-322.
[2] Can Cogun (2004) a study on kerf and material removal rate in wire electrical
discharge machining based on Taguchi method. Journal of Materials Processing Technology.
[3] S. S. Mahapatra, Amar Patnaik, (2006) Optimization of wire electrical discharge
machining (WEDM) process parameters using Taguchi method. International Journal of
Advanced Manufacturing Technology.
[4] H. Singh, R. Garg (2009) Effects of process parameters on material removal rate in
WEDM, Journal of achievements in material and manufacturing engineering, Volume 32,
Issue.
[5] Sarkar S, Mitra S, Bhattacharyya B (2005) Parametric analysis and optimization of
wire electrical discharge machining of γ-titanium aluminide alloy. Journal of Materials
Processing Technology 159:286–294.
[6] M.S. Hewidy, T.A. El-Taweel, M.F. El-Safty, Modelling the machining parameters of
wire electrical discharge machining of Inconel 601 using RSM, Journal of Materials Process-
ing Technology 169 (2005) 328-336.
[7] Mohd Amri Lajis, H.C.D. Mohd Radzi, A.K.M. Nurul Amin (2009) The Implemen-
tation of Taguchi Method on EDM Process of Tungsten Carbide. European Journal of
Scientific Research, ISSN 1450-216X Vol.26 No.4 (2009), pp.609-617.
[8] U. D. Gulhane, A. B. Dixit, P. V. Bane and G. S. Salvi, “Optimization Of Process
Parameters For 316l Stainless Steel Using Taguchi Method And Anova” International Journal
of Mechanical Engineering & Technology (IJMET), Volume 3, Issue 2, 2012, pp. 67 - 72,
ISSN Print: 0976 – 6340, ISSN Online: 0976 – 6359, Published by IAEME.
[9] Rodge M.K, Sarpate S.S and Sharma S.B, “Investigation on Process Response and
Parameters in Wire Electrical Discharge Machining of Inconel 625” International Journal of
Mechanical Engineering & Technology (IJMET), Volume 4, Issue 1, 2013, pp. 54 - 65, ISSN
Print: 0976 – 6340, ISSN Online: 0976 – 6359, Published by IAEME.
150](https://image.slidesharecdn.com/parametricoptimizationforcuttingspeedastatisticalregressionmodelingforwedm-130311000443-phpapp02/75/Parametric-optimization-for-cutting-speed-a-statistical-regression-modeling-for-wedm-9-2048.jpg)

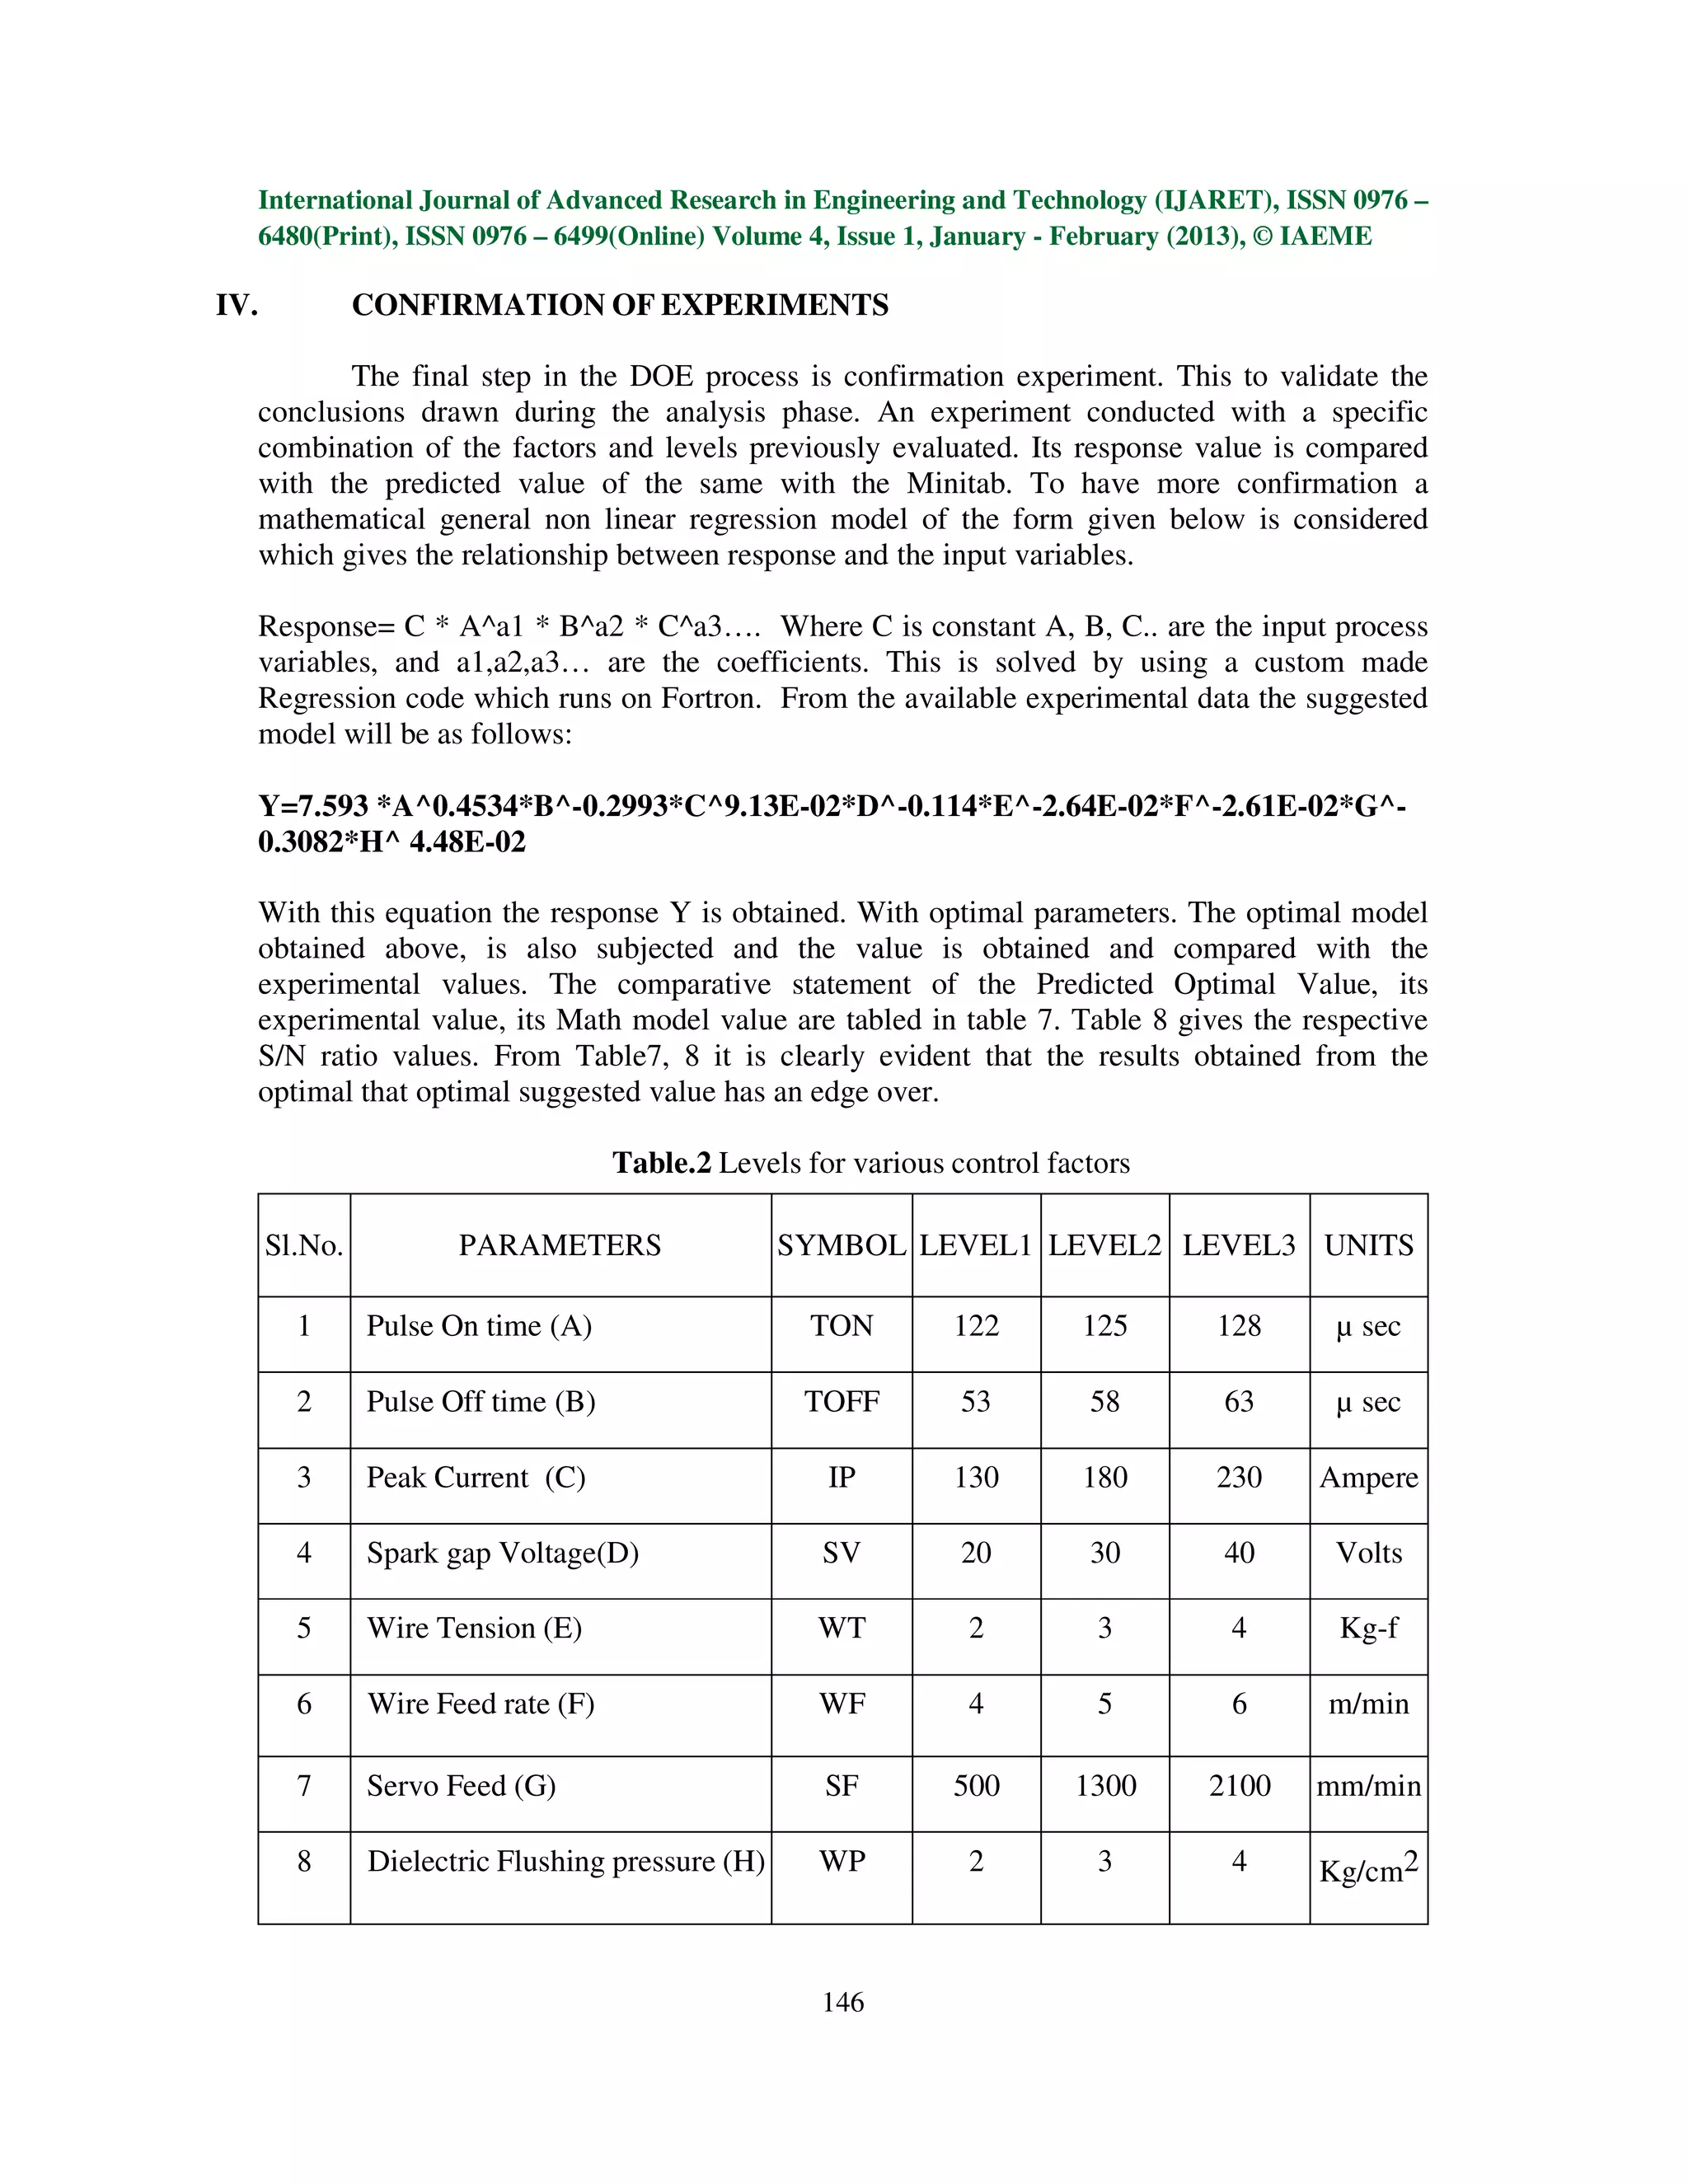
This document presents an experimental study to optimize cutting speed in wire electrical discharge machining (WEDM) of EN-31 alloy steel. Experiments were conducted using a L27 orthogonal array to investigate the effects of eight machining parameters (pulse on time, pulse off time, peak current, spark gap voltage, wire feed rate, wire tension, servo feed, and dielectric flushing pressure) on cutting speed. Analysis of variance was used to determine the most significant parameters, and the optimal levels for maximizing cutting speed were found to be pulse on time at 128 μs, pulse off time at 53 μs, peak current at 230 A, spark gap voltage at 20 V, wire feed rate at 4 m/min, wire tension at