Download to read offline
![IOSR Journal of Mechanical and Civil Engineering (IOSR-JMCE)
e-ISSN: 2278-1684,p-ISSN: 2320-334X, Volume 13, Issue 1 Ver. III (Jan. - Feb. 2016), PP 44-55
www.iosrjournals.org
DOI: 10.9790/1684-13134455 www.iosrjournals.org 44 | Page
Mathematical Modeling and Analysis of Influence of Process
Parameters on MRR during EDM of Stainless Steel 304
V.Vikram Reddy 1
, M.Shashidhar2
, P.Vamshi Krishna3
, B.Shiva Kumar 4
1
Professor, Mechanical engineering department Jayamukhi Institute of Technological sciences Warangal T.S
India-506332
2,3,4
Assistant Professor, Mechanical engineering department Jayamukhi Institute of Technological sciences
Abstract: The present work aims to investigate the influence of process parameters such as peak current, pulse
on time and pulse off time on material removal rate (MRR) in electrical discharge machining (EDM) of
Stainless Steel 304 material. Optimal combination of process parameters to get maximum MRR was achieved
using Taguchi method. Analysis of variance (ANOVA) has been performed to find the significant effect of
parameters on MRR and results revealed that process parameters such as Peak current, pulse on time and pulse
off time are having significant affect on MRR. Further regression analysis has been performed and developed
second order full quadratic mathematical model to establish relationship between MRR and process
parameters. The values of R2
(98.44%) and R2
adj (97.61%) of the model are in the acceptable range of variability
in predicting response values. Also the interactional effects among the process parameters were studied and
observed that peak current and pulse on time as well as peak current and pulse off time are significantly
intersecting each other.
Key Words: Electrical Discharge Machining, Peak Current, Pulse on Time, Pulse off Time, Material Removal
Rate, Taguchi Method, ANOVA, Regression Analysis
I. Introduction
Electrical discharge machining (EDM) is widely used advanced manufacturing processes in industry
for machining electrically conductive materials such as metals, metallic alloys, graphite, or even some
conductive ceramic materials, irrespective of their hardness. It is extensively used in the manufacture of mould,
die, automotive, aerospace and surgical components [2]. In this process removing of material from workpiece
through successive electrical discharges occurring between an electrode and a workpiece. This electric sparking
process is carried out in a dielectric liquid or in gas. The desirable properties of dielectric are low-viscosity, high
dielectric strength, quick recovery after breakdown, effective quenching/cooling and flushing ability. Spark is
initiated at the peak between the contacting surfaces of electrode and workpiece and exists only momentarily.
Metal as well as dielectric will evaporate at this intense localized heat. The influence of process parameters such
as discharge current, gap voltage, pulse-on time and duty cycle on performance characteristics material removal
rate, electrode wear rate and surface roughness was reported during RDM of Ti–6Al–4V alloy[12]. The effect of
process parameters namely peak current, pulse on time, duty factor and supply voltage on material removal rate
electrical discharge machining process using response surface methodology have been investigated.
Experiments were conducted on EN31 tool steel with electrolyte copper as electrode [11]. Taguchi-grey
relational approach based multi response optimization techniques were applied to maximize material removal
rate and to minimize surface roughness in electrical discharge machining of AISI 202 stainless steel using brass
has been used as tool electrode with kerosene as the dielectric medium [7]. Electrical process parameters such as
gap voltage, peak current and duty factor have been used as input parameters. The effects of each process
parameter on the responses were studied individually using the signal to noise ratio graphs and it was noticed
that the responses such as MRR and SR are mainly influenced by current followed by voltage, electrode rotation
and spark gap. Grey relational analysis (GRA) was used for simultaneous multi-response optimization of the
responses [3]. Investigated the influence of optimal set of process parameters such as current, pulse on time and
pulse on time in EDM process to identify the variations in three performance characteristics such as material
removal rate , tool wear rate, and surface roughness during EDM of Mild Steel IS2026 using copper electrode
[5]. Optimization of performance characteristics in unidirectional glass fiber reinforced plastic composites using
Taguchi method and Grey relational analysis was studied [4]. The influence of process parameters namely pulse
on time, duty cycle, discharge current and gap voltage on Tool Overcut during die sinking EDM of SS304 was
studied and it was found that duty cycle has most significant followed by discharge current and pulse on time on
tool over cut. Whereas gap voltage has least effect on Tool overcut [8]. The individual effect of process
parameters such as peak current and pulse duration on performance characteristics namely MRR, TWR and SR
have been explored. Experiments were conducted with PH17-4 stainless steel as work material and electrolyte
copper as electrode [10]. Conducted an experiments to examine the effect of process parameters such as peak](https://image.slidesharecdn.com/f013134455-160728063440/85/F013134455-1-320.jpg)
![Mathematical Modeling And Analysis Of Influence Of Process Parameters On MRR During EDM …
DOI: 10.9790/1684-13134455 www.iosrjournals.org 45 | Page
current, pulse on time and pulse off time on performance characteristics related to surface integrity such as
surface roughness, white layer thickness and surface crack density during electrical discharge machining of
RENE80 nickel super alloy [9]. The use of Taguchi method was reported to optimize the machining parameters
such as current, pulse-on-time and pulse-off-time for EDM of tungsten carbide considering individual responses
namely MRR, EWR and SR [6]. Optimization of machining parameters (Pulse on time, Pulse off time and peak
current) of the Electric Discharge Machining on EN 31 tool steel with copper as an electrode was done
considering the Material Removal Rate as response using the Taguchi method [1].
From the literature survey it was noticed that less work has been reported on electrical discharge
machining of SS304 material. SS304 material is commonly used in gas turbines, piping, nuclear reactors,
pumps, and tooling. It is difficult to machining this material with conventional machining processes owing to its
high hardness. Hence it is necessary to explore the machinability characteristics of SS304 material during EDM
process. Hence the present work aims to investigate the influence of process parameters on MRR during EDM
of SS304 material. Analysis of variance (ANOVA) has been performed to find the significance of machining
parameters. Taguchi method (using of S/N ratios) was used to obtain optimal combination of process
parameters. Further regression analysis has been performed to establish relationship between MRR and
machining parameters and mathematical model was developed to predict MRR using RSM approach.
II. Design of Experiments, Experimental Set Up and Procedures
Experiments were conducted by choosing stainless steel 304 as work material and, electrolyte copper
of diameter ø14mm and length 60 mm was used as tool electrode. The chosen work material bar was cut into
specimens with dimensions of 100 × 18 × 8 mm3
using wire-cut EDM. The chemical composition and
mechanical properties of stainless steel 304 are shown in Table 1 and Table 2 respectively. The physical
properties of tool electrode are presented in Table3. In the present study, three process parameters such as peak
current, pulse on time and pulse off time and each parameter at three levels were considered. The total numbers
of experiments to be conducted are 33
=27. Each experiment was repeated two times to minimize the
experimental errors. Trial experiments were conducted using one factor-at-a-time approach to select range of
chosen process parameters. The working range of the selected process parameters and their levels is shown in
Table 4. Experiments were carried out on EDM machine model MOLD MASTERS605 using commercial EDM
oil grade SAE240 as dielectric fluid with side flushing. The experimental set up is shown in Figure 1.
Machining time considered for conducting each experiment is 5 min. The experimental conditions are given in
Table 5. The experiments were conducted as per the Orthogonal Array shown in Table 6,
Table1: Chemical composition of stainless steel 304
Element Percentage (%) Specifications(AISI304)
C 0.078 0.08Max
Mn 1.389 2.00Max
Si 0.328 1.00Max
P 0.033 0.045Max
S 0.008 0.030Max
Cr 18.072 18.00-20.00
Ni 8.163 8.00-10.50
Table 2: Mechanical properties of stainless steel 304
Density 7.8 (g/cm³)
Specific capacity 400 (J/kg °k)
Thermal conductivity 18.4 (W/m °k)
Electrical resistivity 0.08×10⁻⁶
Ω m
Modulus of elasticity 196 G Pa
Table 3: Physical properties of electrolyte copper
Density 8.95 (g/cm³)
Specific capacity 383 (J/kg °C)
Thermal conductivity 394 (W/m °C)
Electrical resistivity 1.673×10¯8 Ω m
Melting point 1083°C](https://image.slidesharecdn.com/f013134455-160728063440/85/F013134455-2-320.jpg)


![Mathematical Modeling And Analysis Of Influence Of Process Parameters On MRR During EDM …
DOI: 10.9790/1684-13134455 www.iosrjournals.org 54 | Page
3.3. Confirmation Experiment
To verify the predicted value of MRR confirmation experiment was conducted at their optimal
parametric setting. The deviation of predicted value from experimental value was calculated as percentage error
and is presented in Table 15.
%𝑒𝑟𝑟𝑜𝑟 =
𝑒𝑥𝑝𝑒𝑟𝑖𝑚𝑒𝑛𝑡𝑎𝑙𝑣𝑎𝑙𝑢𝑒 − 𝑝𝑟𝑒𝑑𝑖𝑐𝑡𝑒𝑑𝑣𝑎𝑙𝑢𝑒
𝑒𝑥𝑝𝑒𝑟𝑖𝑚𝑒𝑛𝑡𝑎𝑙𝑣𝑎𝑙𝑢𝑒
× 100 … … … (7)
Table 15: confirmation of experiments at Optimal conditions (dielectric only)
S.No.
Optimum parameters
Response
Experimental
value
Predicted
value
%errorI Ton Toff
(A) (µs) (µs)
1 24 150 35
Max.MRR
(mm³/min)
15.3846 15.6789 1.91
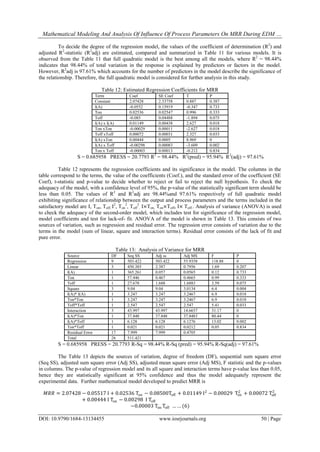
IV. Conclusions
The following conclusions have been arrived during the present work:
1. Stainless Steel 304 can easily be machined on EDM with reasonable speed and surface finish. It is difficult
to machine Stainless Steel 304 on conventional machining because of shorter tool life and severe surface
damage due to its high hardness and strength.
2. MRR is increased with increase in peak current and pulse on time. However MRR decreases with increase
in pulse off time.
3. Further optimal combination of process parameters are: I is at 24A, Ton is at 150µs and Toff is at 35 µs yield
maximum MRR (15.6789 mm³/min), Confirmation experiment was conducted at respective optimal
parametric setting corresponding MRR value 15.3846 mm³/min and percentage error was found to be
1.91%.
4. The analysis of variance reveals that process parameters such as Peak current, pulse on time and pulse off
time are having significant affect on MRR.
5. Regression analysis has been performed and developed second order full quadratic mathematical model to
establish relationship between MRR and process parameters (I, Ton and Toff). The values of R 2
and R2
adj
of the model are in the acceptable range of variability in predicting response values. The predicted values of
MRR using regression equation, corresponding residuals and percentage error were calculated. The
percentage error in predicting MRR is less than 5% hence the mathematical model given below is adequate
in predicting the MRR values.
𝑀𝑅𝑅 = 2.07428 − 0.05517 I + 0.02536 Ton − 0.08500Toff + 0.01149 I2
− 0.00029 Ton
2
+ 0.00072 Toff
2
+ 0.00444 I Ton − 0.00298 I Toff − 0.00003 Ton Toff … … (6)
6. The interactional effects among the process parameters were studied and observed I, and Ton as well as I,
and Toff are intersecting each other significantly at a confidence level of 95%, .The significance of
interactional terms are verified with ANOVA and these terms were included in the regression model.
References
[1]. A.Aravindan, S.Rajendra “Optimization of Machining Parameters in EDM process by using Robust Design” International Journal
of Advanced Scientific and Technical Research, Issue 3 vol. 2, March-April (2013)
[2]. Ho, K.H, Newman, S.T. State of the art electrical discharge machining (EDM) International Journal of Machine Tools and
Manufacture, 43(13): 1287–1300 (2003).
[3]. M.Janardhan “Multi-ResponseOptimizationofProcessParametersin ElectricalDischargeMachiningUsingGrey RelationalAnalysisandTaguchi
Method” International Journal of Research in Mechanical engineering & technology,Vol.4, pp2249-5770, (2014)
[4]. Meenu Gupta and Surinder Kumar “Multi-objective optimization of cutting parameters in turning using grey relational analysis”
International Journal of Industrial Engineering Computations 4 (2013) 547–558.
[5]. Raghuraman S, Thiruppathi K, PanneerselvamT ,SantoshS “Optimization of EDM parameters using Taguchi method and Grey
Relational Analysis for mild steel is 2026” International Journal of Innovative Research in Science, Engineering and Technology
Vol.2, Issue 7,July2013.
[6]. SubhakantaNayak, B.C.Routara “Optimization of Multiple Performance Characteristics in Electro Discharge Machining Using Grey
Relational Analysis” international journal of scientific & technology research Vol3, Issue 4, April (2014).
[7]. T Muthuramalingam and B. Mohan, “Taguchi – grey relation based multi response optimization of electrical process parameters in
electrical discharge machine”, Indian Journal of Engineering & Material Science, Vol. 20, pp. 471-475, December (2013)
[8]. T.Roy, R.K.Dutta “Study of the Effect of EDM Parameters based on Tool Overcut using Stainless Steel (SS 304 Grade)”
International Journal of Engineering Trends and Technology (IJETT) – Volume 13 Number 5 – Jul 2014.
[9]. U.Shrinivas Balraj, A.Gopala Krishna “Multi-Objective Optimization of EDM Process Parameters using Taguchi Method, Principal
Component Analysis and Grey Relational Analysis”, International Journal of Manufacturing, Materials, and Mechanical
Engineering, 4(2), 29-46, April-June 2014 29.](https://image.slidesharecdn.com/f013134455-160728063440/85/F013134455-11-320.jpg)
![Mathematical Modeling And Analysis Of Influence Of Process Parameters On MRR During EDM …
DOI: 10.9790/1684-13134455 www.iosrjournals.org 55 | Page
[10]. V. Vikram Reddy P. Madar Valli A. Kumar Ch Sridhar Reddy, Influence of Process Parameters on Characteristics of Electrical
Discharge Machining of PH17-4 Stainless Steel, Journal of Advanced Manufacturing Systems Vol. 14, No. 3 pp189–202 (2015),
DOI: 10.1142/S0219686715500122.
[11]. V. Vikram Reddy P. Madar Valli, Ch Sridhar Reddy, P.Rangaiah, Mathematical Modeling of Process Parameters on Material
Removal Rate in EDM of EN31steel Using RSM Approach International Journal of Research and Innovations in Science and
Technology Vol.1, Issue.1, pp49–53 (2014).
[12]. V.Chittaranjan Das, C.Srinivas “Optimization of Multiple Response Characteristics on EDM Using the Taguchi Method and Grey
Relational Analysis” International Journal of Scientific Research and Reviews, IJSRR, 3(1), 25- 39 (2014)](https://image.slidesharecdn.com/f013134455-160728063440/85/F013134455-12-320.jpg)

The document presents a mathematical modeling and analysis of the influence of process parameters on material removal rate (MRR) during electrical discharge machining (EDM) of stainless steel 304. Experiments were conducted to determine the effects of peak current, pulse on time, and pulse off time on MRR. Using Taguchi methods, an optimal combination of parameters was identified to achieve maximum MRR. Analysis of variance confirmed the significant effects of the parameters on MRR. Regression analysis was then used to develop a second order full quadratic mathematical model relating MRR to the process parameters. The model was found to have acceptable accuracy in predicting response values based on its R2 and adjusted R2 values. Interaction effects between the parameters were also studied.