SlideShare a Scribd company logo
1
CHAPTER - I
INTRODUCTION OF THE STUDY
1.1. MARKETING:
MEANING OF MARKETING:
Marketing is communicating the value of a product or service to customers, for the
purpose of selling that product or service. Marketing techniques include choosing target
markets through market analysis and market segmentation, as well as understanding
consumer behaviour and advertising a product's value to the customer. From a societal point
of view, marketing is the link between a society's material requirements and its economic
patterns of response.
Marketing satisfies these needs and wants through exchange processes and building
long-term relationships. Marketing blends art and applied science (such as behavioural
sciences) and makes use of technology. Marketing is applied in enterprise and organizations
through marketing management.
MARKETTING-DEFINITION:
According to Philip kotlar “any inter personal or inter organizational relationship
involving an exchange (a transaction) is marketing.
According to American Marketing Association (AMA) the term marketing is
concerned with the place and the activities Involved in the flow of goods and services from
the producer to consumer.
According to W.J.Standon marketing is “a total system of business activities designed
to plan, price, promote and distribute want satisfying goods and services to present and
potential customer
2
1.2 ADVERTISING:
The word advertising is derived from the Latin word viz, "advertero" "ad" meaning
towards and "verto" meeting towards and "verto" meaning. "I turn" literally specific thing".
Simply stated advertising is the art "says green." Advertising is a general term for and all
forms of publicity, from the cry of the street boy selling newspapers to the most celebrate
attention attracts device. The object always is to bring to public notice some articles or
service, to create a demand to stimulate buying and in general to bring logethel the man with
something to sell and the man who has means or desires to buy".
Advertising has been defined by different experts. Some of the quoted definition are
American marketing association has defined advertising as "any paid form of non-personal
presentation and promotion of ideas, goods or services by an identified sponsor. The medium
used are print broad cast and direct.
Stanton deserves that “Advertising consists of all the activities involved in presenting
to a group a non- personal, oral or visual openly, sponsored message regarding a product,
service, or idea. This message called an advertisement is disseminated through one or more
media and is paid for by the identified sponsor.
Advertising is any paid form of non – personal paid of presentation of ideas goods or
services by an identified sponsor.
Basic Features of Advertising
On the basis of various definitions it has certain basic features such as:
1. It is a mass non-personal communication.
2. It is a matter of record.
3. It persuades buyers to purchase the goods advertised.
4. It is a mass paid communication.
5. The communication media is diverse such as print (newspapers and magazines)
6. It is also called printed salesmanship because information is spread by means of the
written and printed work and pictures so that people may be induced to act upon it.
3
Functions of Advertising
For many firms advertising is the dominant element of the promotional mix –
particulars for those manufacturers who produce convenience goods such as detergent, non –
prescription drugs, cosmetics, soft drinks and grocery products. Advertising is also used
extensively by maters of automobiles, home appliances, etc., to introduce new product and
new product features its uses its attributes, pt. availability etc.
Advertising can also help to convince potential buyers that a firm’s product or service
is superior to competitor’s product in make in quality, in price etc. it can create brand image
and reduce the likelihood of brand switching even when competitors lower their prices or
offer some attractive incentives.
Advertising is particularly effective in certain other spheres too such as:
i) When consumer awareness of products or service is at a minimum.
ii) When sales are increasing for all terms in an industry.
iii) When a product is new and incorporates technological advance not strong and.
iv) When primary buying motive exists.
It performance the following functions:
i) Promotion of sales
ii) Introduction of new product awareness.
iii) Mass production facilitation
iv) Carry out research
v) Education of people.
4
1.3 ADVERTISING OBJECTIVES:
The long term objectives of advertising are broad and general, and concern the
contribution advertising should make to the achievement of overall company objectives. Most
companies regard advertising main objective as hat of proving support to personal selling and
other forms of promotion. But advertising is a highly versatile communications tools and may
therefore by used for achieving various short and long term objectives. Among these
objectives are the following:
1. To do the entire selling job (as in mail order marketing).
2. To introduce a new product (by building brand awareness among potential buyers).
3. To force middlemen to handle the product (pull strategy).
4. To build brand preference 9by making it more difficult for middleman to sell
substitutes).
5. To remind users to buy the product (retentive strategy).
6. To publicize some change in marketing strategy (e.g., a price change, a new model or
an improvement in the product).
7. To provide rationalization (i.e. socially acceptable excuses).
8. To combat or neutralize competitors advertising.
9. To improve the moral of dealers and/or sales people (by showing that the company is
doing its share of promotion).
10. To acquaint buyers and prospects with the new uses of the product (to extend the
PLC).
5
1.4. STATEMENT OF PROBLEM:
To find out how consumers are influenced by the advertisements especially of
confectionary products. So the statement of this project would be ‘Effect of Advertisements
on confectionary products with special reference to Tirupur city’ the research process goes
within the following confectionary products:
 Biscuit
 Chocolates
 Noodles
 Health Drinks
6
1.5 SCOPE OF THE STUDY:
This study has been under taken to find out the effectiveness of advertisement on
confectionary products among the people in Tirupur city. This study is confined to the city of
Tirupur only considering the ultimate of the local customer.
7
1.6 OBJECTIVES OF THE STUDY:
 To know about the awareness of confectionary product.
 To know about the awareness of confectionary product advertisement.
 To study the impact of advertisement of confectionary product.
 To examine the impact of advertisement on buying behaviour.
 To find out the influence level of television advertisement.
 To offer suggestion and conclusion on the basis of finding of the study.
8
1.7. RESEARCH METHODOLOGY:
MEANING FOR RESEARCH
Research in common parlance refers to search for knowledge. One can also define
research as a scientific and systematic search for pertinent information on a specific topic.
The advanced leaner’s dictionary of current English lays down the meaning of research as “a
careful investigation or inquiry especially through search for new facts in any branch of
knowledge.
MEANING FOR RESEARCH METHODOLOGY
Research methodology is a way to systematically solve the research problem. It may
be understood as a science of studying how research is done scientifically. In it we study the
various steps that are generally adopted by a researcher in studying his research problem
along with the logic behind them.
RESEARCH DESIGN
Research design is the blue print of the proposed study. It represents the overall scheme of
the study. “All research design is the logical and systematic planning and it helps directing
piece of research. “The research design of this descriptive research studies.
DESCRIPTIVE RESEARCH DESIGN
Descriptive research studies are those studies concerned with describing the
characteristics of a particular group. Such studies are concerned with specific predictions,
with narration of facts and characteristics concerning group or situation.
SAMPLE DESIGN
A sample design is a definite plan for obtaining a sample from a given population. It
refers to the technique or the procedure the researcher would adopt in selecting items for the
sample. Sample design may as well lay down the number of items to be included in the
sample i.e., the size of the sample. Sample design is determined before data are collected.
SAMPLE SIZE
An important decision that has to be taken in adopting a sampling technique is about
the size of the sample means number of 120 sampling units selected from the population for
investigation. Different opinion have expressed by experts on this point.
9
PERIOD OF DATA COLLECTION
The data collection was made during the month of December 14 to January 15. Every
respondent was given with a separate questionnaire and generally the respondent took 25-30
minutes to fill-up the questionnaire. To enable the respondents for clear understanding of
each and every question asked in the questionnaire, various terms used in the questions such
as comparing the effectiveness of confectionary product were clearly explained by the
researcher.
10
1.8. ANALYSIS AND TOOLS:
PERCENTAGE ANALYSIS
Percentages are often used in data presentation for them simply numbers, reducing all
of them to a 0 to 120 range. Through the use of percentages, the data are reduced in the
standard form with base to 120 which fact facilitates relative comparisons.
No of respondents
Percentage analysis = ---------------------------- * 100
Total no of respondents
LIKERT SCALE METHOD
Scaling technique
Scaling describe the procedures of assessing numbers of various
degrees of opinion, attitude and other concepts. This can be done in two ways via,
 Marketing a judgments about some characteristics of an individual and then placing him
directory on a scale that has been defined in terms of that characteristics, and
 Constructing questionnaires in such a way that the score of individual and responses assigns
him a place on scale. It may be stated here that the scale is a continuum, consisting of the
highest point and the lowest points along with several intermediate point between these two
extreme points.
 Scaling may be defined as “procedure for the assignment of numbers to a property of
objects in order to impart some of the characteristics of number of the properties in the
question”.
LIKERT-TYPE SCALES
Summated scales or Likert-type scales is one of the scaling technique. They are
developed by utilizing the item analysis approach where in a particular item is evaluated on
the basis of how well it discriminates between those persons whose total scores is high and
those whose score is low. Each response is given a numerical score, indicating its
favourableness or Unfavourableness and the scores are totalled to measure the respondent’s
attitude. In a linkert scale the respondents is asked to respond to each of statement in term of
several degree of agreement.
11
For example:
When asked to express opinion whether one considered his job satisfaction of the respondent
may respondent in any following ways,
 Highly satisfaction
 Satisfaction
 Neutral
 Highly dissatisfaction
 Dissatisfaction
12
1.9 LIMITATION OF THE STUDY:
 The finding of the respondents does not in constant, one so it is not a real result or real
opinion.
 Time of the study was limited only 6 months.
 The number of the respondents was limited to 120 only.
 The study was conducted at Tirupur. So it is applicable only to Tirupur.
 In this study some statistical tools like, percentages were applied for working some
analysis; these statistical tools have their own limitations.
13
1.10 CHAPTER SCHEME:
Chapter I
This chapter deals with introduction of the study , meaning of marketing,
advertising, advertising objectives, statement of problem, scope of the study, objectives of the
study, research methodology, analysis and tools and limitation of the study.
Chapter II
This chapter deals with the review of literature.
Chapter III
This chapter deals with the role of advertising and confectionary product.
Chapter IV
This chapter contains analysis and interpretation of data. The analysis consists of
simple percentage analysis, Likert scale method.
Chapter V
This chapter deals with finding, suggestions and conclusion.
14
CHAPTER II
REVIEW OF LITERATURE:
Review of literature is the study of the prevalent materials related to topic of research
.This helps the researcher to get a clear idea about the particular field. It is important for the
researcher to carry out the research successfully. It is further intended to serve as a means of
exchanging information with the hope that it could prevent further implications of the
respondents to determine what is already known from similar research. The knowledge of
other research literature is very important for marketing research. Either to prove or disprove
his findings with those or others certain number of literature has been review of enlisted.
Halan (2012)1 and Singh have pointed out that advertisement constitute a major consumer
market, with direct purchasing power for snacks and sweets, and indirect purchase influence
while shopping.
Ahuja et al. (2013)2 have found that in western countries, consumers have reported to wield a
lot of influence in purchase decisions for children products such as snacks.
Mehrotra et al. (2010)3 have noted that no particular attitude or set of attitude can be applied
for all products. Confectionery purchases are affected due to festival seasons (The
confectioner-2006 issue by Jey zemke).
According to Seiter (2011)4 the most common persuasive strategy employed in advertising to
associate the product with fun and happiness, rather than to provide any factual product related
information.
1
. Halan, Deepak. (2002). “Why Kids Mean Business,” Indian Management, December, 46-49.
2
Ahuja, R. D. B. andK.M. Stinson. (1993). “Female-Headed Single Parent Families: An Exploratory Study of Children’s Influence in
Family Decision Making.” Advances in Consumer Research, 20, 469-474.
3
Mehrotra, S. andS. Torges. (1977). “Determinationof Children’s Influence on Mothers’ Buying Behavior.” In Advances in Consumer
Research, 4, William D. Perreault Jr. (Ed.), Atlanta, GA: Association for Consumer Research, 56 -60.
4
Seiter, E. 1993. Sold Separately: Children and Parents in Consumer Culture. New Brunswick, NJ: Rutgers University Press.
15
According to Singh (2013)5 Indian market is not by a large space, an easy audience to target
for the advertisers. The one billion people of the country are speckled in terms of beliefs,
ethnicity, states, culture, language, dialects, norms and values. Other aspects such as the
economic discrepancy in the country separates it in a way which has resulted in a large
number of lower and upper middle class, with a very small class falling under in the middle
class. This demonstrates a vast disparity in the buying power and decision making clout, one
which the advertisers should keep in mind. Indian advertisement has been placing a vital
amount of importance on both recall and persuasion as brand differentiating messages.
(Dixit, 2011)6 Very often, various advertising styles are used by advertisers to influence
consumer brand choice behaviour and among these different available choices one very
popular choice is Advertisement Endorsements.
Surabhi B. Prasad & Ravi Girdhar (2014)7 have come up with a model that is a function of
several input parameters, their priorities and the correlation score between the parameter and
endorsement effectiveness. The paper first examines the various facets of advertisement and
the impact on brand equity. A through literature survey has been made in light of which the
arguments have been substantiated.
Neha Taleja, (2001)8 studied the impact of advertisement on brands. While the magnitude of
the impact of effectiveness of advertisement remains under the purview of gray spectacles, the
research has established reasoning to the impact of advertisement on brands and reveals that
the level and the magnitude of the effect vary with the advertisement and the product category
and that most of the endorsements have a favourable impact.
5 Singh, D. (1998).“Childrenas Consumers.” Indian Management, September, 78- 81.
6
Dixit, Daneshvary,R, Schwer, RK (2000) „The association endorsement andconsumers intentiontopurchase, Journal of Consumer
Marketing, Volume: 17Issue: 3 Page: 203– 213ISSN: 0736-3761
7
Kelly, K.J.; Slater, M.D. andKaran,D. (2002).Image advertisements influence onadolescents perception of the desirability of beer and
cigarettes. Journal of Public Policy and Marketing 21 (2), pp. 295-304.
8
Farrell, KA, Karels, GV, Montfort,KW andMcClatchy, CA 2000, Managerial Finance,Volume: 26 Issue: 7 Page: 1 – 15 ISSN: 0307-4358
16
A study conducted by Irene Roozen (2008)9 analysed two aspects one was to find the
implication that the advertisement endorser brings to the product and to the consumer for
different product categories and Arabian Journal of Business and Management Review
(OMAN Chapter) Vol. 1, No.7; February 2012 86 the other was the extent to which these
effects vary across different product categories. The research was based on written
questionnaires and the study analysed the impact of female international advertisement
endorsers in respect of three different product categories namely, high involvement, low
involvement and the beauty products and concluded that the celebrities are considered to have
the highest expertise for beauty products with much lower scores for candy bars (low
involvement) and lap-tops (high involvement).
Kalliny, Morris; Beydoun, Abdul-Rahman; Saran, Anshu; Gentry, Lance (2009)10 the research
has investigated into the use of advertisement in TV commercial endorsements. The study has
compared the use of effectiveness of advertisement in terms of two fundamental cultural
dimensions: 1) low versus high context and 2) individualism versus collectivism. This paper
has also an attempted to find out the frequency of advertisement use and identify the
characteristics of celebrities used and the products their use is associated with.
Angela Byrne, Maureen Whitehead, Steven Breen (2014)11 study the process of transference
of advertisement images to the products image by examining the usage of effectiveness of
advertisement in the formation of the retail image of a leading European grocery distribution
group. The analysis relates to a field research with consumers and interviews with advertising
agency personnel who have identified the criterion for the choice of a celebrity. The extent to
which the market place recognizes and consumers associate themselves with the image of a
advertisement endorser is explored.
9
Alsmadi, Amos, C, Holmes, G and Strutton, D (2008), International Journal of Advertising, Vol.27, No. 2, pp.209 -234
10
Kelly, K.J.; Slater, M.D. andKaran,D. (2002).Image advertisements influence onadolescents perception of the desirability of beer and
cigarettes. Journal of Public Policy and Marketing 21 (2), pp. 295-304.
11
Confectionerypurchases are affected due to festival seasons (The confectioner -2006 issue by Angela Byrne, Maureen Whitehead).
17
In a survey, titled “Impact of Effectiveness of advertisement on Buying Behaviour of
Customers” the focus was laid on the risks and returns involved in using advertisement to
influence the purchase behaviour of the consumers. The outcome of the research was that, it
substantiated the fact that advertisement do have an impact in the Indian scenario. The critical
analysis of the research convinced that the consumers seek variety of aspects like credibility,
likeability, fit between the brand and the celebrity. The research also concluded that from the
viewpoint of the celebrity, it is not only the financial gains that matters but also the impact that
the endorsement might do to their image. The research findings also laid stress on the fact that
the association of the advertisement with any type of controversy or ill- behaviour did have a
negative impact on the endorsement.
18
CHAPTER III
THE ROLE OF ADVERTISING:
Advertising is the means by which goods or services are promoted to the public. The
advertiser’s goal is to increase sales of these goods or services by drawing people’s attention
to them and showing them in a favourable light. The mission of advertiser is to reach
prospective customers and influence their awareness, attitudes and buying behaviour. They
spend a lot of money to keep individuals (markets) interested in their products. To succeed,
they need to understand what makes potential customers behave the way they do. For
advertising to exist, a number of factors have to be in place The goods and services to be
advertised
Advertising is a marketing function, and Kotler claims that advertising can have a
number of different, possible objectives. One objective can be to inform customers about new
product or a price change. The main objective here is to build primary demand. Another
objective can be to persuade the customer to purchase the product. The use advertising as a
way to build preference and to encourage customers to change brand. The fundamental
purpose of advertising is to influence people to purchase various goods and products. In this
sense advertising is a phenomenon that aims to persuade or influence people. What is the role
of advertising in the demand function? One response of this question is that a company can
sell more of its product by informing consumers about the product. The information may
include its existence, price, promotion, quality, etc. Therefore advertising is seen as providing
information to consumers. The other response is that advertising searches the way of
persuading consumers to purchase the advertised products by appeals to snobbery,
associations of the product with favoured people or situations, repetition of the same message
and so on.
Advertising shows the last style and the new popular products in the market. It displays
ideal individuals wearing the new clothes and looking good. Customers are jealous of this
perfection. So that, they go out and purchase in hopes of reaching perfection. There is a time
dimension at advertising. Advertisement’s influence on sales is immediate (i.e. it is mostly felt
within seven days of an advertisement’s exposure). A repetition of such effects, measured at
the end of a year, amounts to a medium-term influence. The immediate influence of
19
advertising on sales plays a gatekeeper role to all further effects. Without it there will not be
medium term effect (i.e. a repetition of short-term effects); and long-term effect.
Advertisement’s full effect can be only valued if its long-term influence is taken into
account as well as its short and medium-term effects on sales. These terms make it possible to
evaluate the productivity of an advertising campaign; to measure if the campaign shows a
financial return on the investment and is thus accountable
According to Doole & Lowe (2004), advertising is the most important part of the
whole marketing strategy. There are many channels of media to use for advertising, for
example television, printed media, radio, cinema, outdoor and transport poster. Marketers use
television as the most powerful medium of communication
INDIAN ADVERTISING INDUSTRY
The Indian advertising industry is talking business today. It has evolved from being a
small-scale business to a full-fledged industry. It has emerged as one of the major industries
and tertiary sectors and has broadened its horizons be it the creative aspect, the capital
employed or the number of personnel involved. Indian advertising industry in very little time
has carved a niche for itself and placed itself on the global map.
Indian advertising industry with an estimated value of 13, 200-crore has set eyeballs
gazing with some astonishing pieces of work that it has given in the recent past. The creative
minds that the Indian advertising industry incorporates have come up with some mind-
boggling concepts and work that can be termed as masterpieces in the field of advertising.
Advertising agencies in the country too have taken a leap. They have come a long
way from being small and medium sized industries to becoming well known brands in the
business. Mudra, Ogilvy and Mather (O&M), Mccann Ericsonn, Rediffussion, Leo Burnett
are some of the top agencies of the country.
20
Indian economy is on a boom and the market is on a continuous trail of expansion.
With the market gaining grounds Indian advertising has every reason to celebrate. Businesses
are looking up to advertising as a tool to cash in on lucrative business opportunities. Growth
in business has lead to a consecutive boom in the advertising industry as well.
The Indian advertising today handles both national and international projects. This is
primarily because of the reason that the industry offers a host of functions to its clients that
include everything from start to finish that include client servicing, media planning, media
buying, creative conceptualization, pre and post campaign analysis, market research,
marketing, branding, and public relation services.
Keeping in mind the current pace at which the Indian advertising industry is moving
the industry is expected to witness a major boom in the times ahead. If the experts are to be
believed then the industry in the coming times will form a major contribution to the GDP.
With all this there is definitely no looking back for the Indian advertising industry that is all
set to win accolades from the world over.
With development in the technology, various avenues are opening up in advertising
industry. It is estimated that about 2.2 billion dollars are generated in this industry every
year. Be it is print, radio, television or Internet, every medium plays a significant role in the
growth of this industry. Today, Advertising Industry in India is surging with revenues. To
meet all the demands in adverting sector, many agencies are coming to the scene.
India is a hub of creativity and this is evident from the fact that more and more
people from Indian advertising industry are being accepted world over and imposing a lot of
respect in international advertising community.
Visibility is the mantra of success these days and advertising makes sure that your
product, service is visible; thus saleable. Today Advertising Industry in India is booming
with revenue. It is a very successful industry which generates lot of revenue. The
Advertising Industry in India is getting recognized worldwide with its superior quality work
and innovation. It ensures tremendous growth and scope for the employees.
21
During fiscal 2005, the gross advertising spend in India is estimated at Rs 111 billion,
and is expected to grow at 14.2% to reach Rs. 127 billion by fiscal 2006.
The key factors which have contributed to growth of the Indian advertising
industry include:
- Growth in media vehicles leading to increase in media infiltration.
- Higher degree of competitive concentration among consumer companies
- Entry of global consumer companies with large advertising budgets
CONFECTIONARY PRODUCT
Confections are defined by the presence of sweeteners. These are usually sugars, but
it is possible to buy sugar-free sweets, such as sugar-free peppermints. The most common
sweetener for home cooking is table sugar, which is chemically a disaccharide containing
both sucrose and fructose. Hydrolysis of sucrose gives a mixture called invert sugar, which is
sweeter and is also a common commercial ingredient. Finally confections, especially
commercial ones, are sweetened by a variety of syrups obtained by hydrolysis of starch.
These sweeteners include all types of corn syrup
Confectionery, also called sweets or biscuits, is sweet food. The term varies among
English-speaking countries. In general, though, confectionery is divided into two broad and
somewhat overlapping categories, bakers' confections and sugar confections.
Bakers' confectionery, also called flour confections, includes principally sweet
pastries, cakes, and similar baked goods. In the Middle East and Asia, flour-based
confections are more dominant.
Sugar confectionery includes sweets, candied nuts, chocolates, chewing gum and
bubble-gum, sweetmeats, pastillage, and other confections that are made primarily of sugar.
In some cases, chocolate confections (confections made of chocolate) are treated as a separate
category, as are sugar-free versions of sugar confections. The words candy (US and Canada),
sweets (UK and Ireland), and lollies (Australia and New Zealand) are common words for the
most common varieties of sugar confectionery.
22
The confectionery industry also includes specialized training schools and extensive
historical records. Traditional confectionery goes back to ancient times, and continued to be
eaten through the middle Ages into the modern era
Chocolate is a typically sweet, usually brown food preparation of Theobroma cacao
seeds, roasted and ground, and often flavoured with vanilla. It is made in the form of a liquid,
paste, or in a block, or used as a flavouring ingredient in other foods. Cacao has been
cultivated by many cultures for at least three millennia in Mesoamerica. The earliest evidence
of use traces to the Mokaya, with evidence of chocolate beverages dating back to 1900 BCE.
CHOCOLATE
Chocolate is a confection made from cacao beans, the seeds of the cacao plant. There
are a large number of products made from it on the market, from powdered cocoa for making
drinks to white chocolate, and most markets carry a cross-section of confections for their
customers. In addition to being available at general markets and grocery stores, chocolate can
also be purchased from specialty companies which make luxury and distinctive confections.
Cacao originated in Central America. Today, cacoa is mostly grown in South and
Central America and in West Africa. Some countries in Asia are also starting to grow the
crop. There are actually several varieties of the cacao plant, all of which produce chocolates
with slightly different flavours. The flavour is also impacted by where the plant it grown,
how it is handled after harvest, and how it is processed. Companies invest a great deal of
money in developing ideal blends of cacao beans to create the flavours their consumers are
used to.
Cacao beans grow in large pods which are harvested once they ripen and then allowed
to ferment. Initially, the cacao beans are extremely bitter; the fermentation process softens the
bitterness, allowing producers to move on the next steps, roasting and hulling. Roasting helps
to develop the flavour of the beans, while shelling exposes the cacao nibs, the portion of the
bean which has all the flavour.
23
BISCUITS
Biscuit is a term used for a diverse variety of baked, commonly flour-based food
products. The term is applied to two distinct products in North America and the
Commonwealth of Nations and Europe. The North American biscuit is typically a soft,
leavened quick bread, and is covered in the article Biscuit. This article covers the other type
of biscuit, which is typically hard, flat and unleavened.
24
NOODLES
Noodles are a staple food in many cultures made from unleavened dough which is
stretched, extruded, or rolled flat and cut into one of a variety of shapes. While long, thin
strips may be the most common, many varieties of noodles are cut into waves, helices, tubes,
strings, or shells, or folded over, or cut into other shapes.
Noodles are usually cooked in boiling water, sometimes with cooking oil or salt
added. They are often pan-fried or deep-fried. Noodles are often served with an
accompanying sauce or in a soup. Noodles can be refrigerated for short-term storage, or dried
and stored for future use. The material composition or geocultural origin must be specified
when discussing noodles. The word derives from the German word Nudel.
Wheat noodles in Japan (udon) were adapted from a Chinese recipe by a Buddhist
monk as early as the 9th century[citation needed]. Rested noodles were eaten by the people of
Persia by the 13th century. Innovations continued, as for example, noodles made from
buckwheat (naengmyeon) were developed in the Joseon Dynasty of Korea (1392–1897).
Ramen noodles, based on Chinese noodles, became popular in Japan by 1900.
The origin of noodles has been disputed, but the evidence heavily favours its origin in
China. Claims have been made that the noodle was of Chinese, Arabian and Mediterranean
origin. A Nature article claimed the oldest evidence of noodle consumption was from 4,000
years ago in China. In 2005, a team of archaeologists working in the People's Republic of
China reported finding an earthenware bowl that contained foxtail millet and broomcorn
millet noodles at the Lajia archaeological site, arguably hailing from the late neolithic period,
but this claim was disputed by later research, which suggested that noodles simply cannot be
produced from millet, which lacks gluten.
The earliest written record of noodles is found in a book dated to the Eastern Han period (25–
220). Noodles, often made from wheat dough, became a staple food for people of the Han
Dynasty (206 BCE - 220 CE). During the Tang Dynasty, the noodles were first cut into strips,
and in the Yuan Dynasty the making of dried noodles began.
25
HEALTH DRINKS
A drink or beverage is a liquid intended for human consumption. In addition to their
basic function of satisfying thirst, drinks play important roles in human culture. Common
types of drinks include plain water, milk, juices, coffee, tea, and soft drinks. In addition,
alcoholic drinks such as wine, beer, and liquor, which contain the drug ethanol, have been
part of human culture and development for 8,000 years
Non-alcoholic drinks often signify drinks that would normally contain alcohol, such as beer
and wine but are made with less than .5 percent alcohol by volume. The category includes
drinks that have undergone an alcohol removal process such as non-alcoholic beers and de-
alcoholised wines.
Horlicks is a malted milk hot drink developed by founders James and William
Horlicks. It is now marketed and manufactured by GlaxoSmithKline in the United Kingdom,
New Zealand, Hong Kong, Bangladesh, Pakistan, India, and Jamaica.
Bournvita, previously called Bourn-vita, is a brand of malted and chocolate malt drink
mixes sold in Europe and North America, as well as India, Nepal, Nigeria, Ghana, Kenya,
South Africa, Benin and Togo, and manufactured by Cadbury. Bournvita was developed in
England in the late 1920s and was marketed as a health food. The original recipe included
full-cream milk, fresh eggs, malt and chocolate. It was first manufactured and sold in
Australia in 1933 Bournvita was discontinued in the UK market in 2008. The drink was
named by Cadbury which was derived from Bournvita, the model village which is the site of
26
the Cadbury factory. It was first sold in India in 1948, the same year Cadbury India was
established.
27
CHAPTER IV
ANALYSIS AND INTERPRETATION
4.1 PERCENTAGE ANALYSIS:
The percentage method is used for comparing certain features, the data represented in
the form of table and graphs in order to give effective visualization of comparison made.
Number of respondents
Percentage analysis = ------------------------------------------- * 100
Total number of respondents
28
TABLE NO 4.1.1
TABLE SHOWING GENDER OF THE RESPONDENTS
S.NO. GENDER NO.OF PERSON PERCENTAGE
1 Male 73 60
2 Female 47 40
Total 120 100
INTERPRETATION
The above table shows that, 60% of the respondents are male and remaining 40% are
female respondents.
INFERENCE
The majority, 60% of the respondents are male.
29
CHART NO 4.1.1
CHART SHOWING GENDER OF THE RESPONDENTS
(Source: primary data)
73, 61%
47, 39%
GENDER OF THE RESPONDENTS
MALE
FEMALE
30
TABLE NO 4.1.2
TABLE SHOWING AGE OF THE RESPONDENTS
S.NO. AGE
NO.OF
RESPONDENTS
PERCENTAGE
1 Below 25 20 16
2 Between 26 – 30 42 35
3 Between 31 - 40 47 39
4 Above 40 11 10
Total 120 100
INTERPRETATION
From the above table shows that, 16% of the respondents are in the age group of
below 25 years,35% of the respondents are in the age group of 26 – 30 years,39% of the
respondents are in the age group of 31 – 40 years,11% of the respondents belongs to the age
group of above 40 years.
INFERENCE
The majority, 39% of the respondents are in the age group of 31 – 40.
31
CHART NO 4.1.2
CHART SHOWING AGE OF THE RESPONDENTS
(Source: primary data)
below 25 between 26 to 30 between 31 to 40 above 40
AGE OF THE RESPONDENDS 20 42 47 11
20
42
47
11
AGE OF THE RESPONDENDS
32
TABLE NO 4.1.3
TABLE SHOWING MARITAL STATUS OF THE RESPONDENTS
S.NO
MARITAL
STATUS
NO.OF
RESPONDENTS
PERCENTAGE
1 Married 120 100
2 Unmarried 0 0
Total 120 100
INFERENCE
From the above table all the respondents are married
33
CHART NO 4.1.3
CHART SHOWING MARITAL STATUS OF THE RESPONDENTS
(Source: primary data)
0%
10%
20%
30%
40%
50%
60%
70%
80%
90%
100%
Married unmarried
Married, 120
unmarried, 0
MARITAL STATUS
MARITAL STATUS
34
TABLE NO 4.1.4
TABLE SHOWING MARITAL STATUS OF THE RESPONDENTS
S.NO. CHILDREN HAVE CHILD PERCENTAGE
1 Yes 120 100
2 No 0 0
Total 120 100
INFERENCE
From the above table all the respondents are having children.
35
CHART NO 4.1.4
CHART SHOWING CHILDREN OF THE RESPONDENTS
(Source: primary data)
yes
100%
no
0%
children
yes no
36
TABLE NO 4.1.5
TABLE SHOWING NO.OF CHILDREN OF THE RESPONDENTS
S.NO.
NO.OF
CHILDREN
NO.OF PERSON PERCENTAGE
1 Only one 23 19
2 Two 71 59
3 Three 26 22
Total 120 100
INTERPRETATION
From the above table shows that, 19% of the respondents are have only one child,59%
of the respondents are have two children,22% of the respondents are have three children.
INFERENCE
The majority, 59% of the respondents are have two children.
37
CHART NO 4.1.5
CHART SHOWING NO OF CHILDREN OF THE RESPONDENTS
(Source: primary data)
23, 19%
71, 59%
26, 22%
NO OF CHILD
only one
two
three
38
TABLE NO 4.1.6
TABLE SHOWING MONTHLY INCOME OF THE RESPONDENTS
S.NO.
MONTHLY
INCOME
NO.OF
RESPONDENTS
PERCENTAGE
1 Less than 10000 44 36
2
Between 10001-
15000
41 34
3
Between 15001-
20000
27 22
4 Above 20000 8 8
Total 120 100
INTERPRETATION
In the above table shows that, 36% of the respondents salary is less than 10000,34%
of the respondents salary is between 10001 - 15000,22% of the respondents salary is between
15001 - 20000,8% of the respondents salary were above 20000.
INFERENCE
The majority, 36% of the respondents salary is less than 10000.
39
CHART NO 4.1.6
CHART SHOWING MONTHLY INCOME OF THE RESPONDENTS
(Source: primary data)
44
41
27
8
0 5 10 15 20 25 30 35 40 45 50
LESS THEN 10000
BETWEEN 10001-15000
BETWEEN 15001-20000
ABOVE 20000
less then 10000 between 10001-15000 between 15001-20000 above 20000
MONTHLY INCOME 44 41 27 8
MONTHLY INCOME
MONTHLY INCOME
40
TABLE NO 4.1.7
TABLE SHOWING TYPE OF CABLE CONNECTION OF THE RESPONDENTS
S.NO.
TYPE OF
CONNECTION
NO.OF
RESPONDENTS
PERCENTAGE
1 Cable 74 61
2 Dish 46 39
Total 120 100
INTERPRETATION
The above table shows that, 61% of the respondents are using cable and remaining
39% are dish using respondents.
INFERENCE
The majority, 61% of the respondents are using cable connection.
41
CHART NO 4.1.7
CHART SHOWING TYPE OF CABLE CONNECTION OF THE RESPONDENTS
(Source: primary data)
74
46
0
10
20
30
40
50
60
70
80
cable dish
TYPE OF CONNECTION
TYPE OF CONNECTION
42
TABLE NO 4.1.8
TABLE SHOWING NO.OF HOURS TO WATCH TV OF THE RESPONDENTS
S.NO. HOURS
NO.OF
RESPONDENTS
PERCENTAGE
1 Less than 1 hour 22 18
2 1-2 hours 58 48
3 2-3 hours 24 20
4 Above 3 hours 16 14
Total 120 100
INTERPRETATION
From the above table shows that, 18% of the respondents les then 1 hour to watch TV,
48% of the respondents are 1 – 2 hours, 20% of the respondents are 2 – 3 hours, 14% of the
respondents are above 3 hours.
INFERENCE
The majority, 48% of the respondents are 1 – 2 hours to watch TV.
43
CHART NO 4.1.8
CHART SHOWING NO OF HOURS TO WATCH TV OF THE RESPONDENTS
(Source: primary data)
Less then 1 hour 1-2 hours 2-3 hours
more then 3
hours
HOURS OF WATCHING TV 22 58 24 16
22
58
24
16
0
10
20
30
40
50
60
70
HOURS OF WATCHING TV
44
TABLE NO 4.1.9
TABLE SHOWING CHILD LIKE TO WATCH TV PROGRAM
S.NO.
CHILD LIKE TO
WATCH TV
NO.OF
RESPONDENTS
PERCENTAGE
1 Cartoons 32 26
2 Reality shows 52 43
3 Movies 27 22.5
4 Others 9 8.5
Total 120 100
INTERPRETATION
In the above table shows that, 26% of the children like to watch cartoons,43% of the
children like to watch reality shows,22.5% of the children like to watch movies,8.5% of the
children like to watch others.
INFERENCE
The majority, 43% of the children like to watch reality shows.
45
CHART NO 4.1.9
CHART SHOWING CHILD LIKE TO WATCH TV PROGRAM
(Source: primary data)
cartoons
27%
Reality shows
43%
Movies
22%
others
8%
CHILD LIKE TO WATCH TV
cartoons
Reality shows
Movies
others
46
TABLE NO 4.1.10
TABLE SHOWING CHILD FAVORITE CONFECTIONARY PRODUCTS
S.NO.
FAVOURITE
CONFECTIONARY
PRODUCT
NO.OF
RESPONDENTS
PERCENTAGE
1 Biscuits 31 25
2 Chocolates 33 27.5
3 Noodles 37 32
4 Health drinks 19 15.5
Total 120 100
INTERPRETATION
From the above table shows that, 25% of the children favourite confectionary product
is biscuits, 27.5% of the children like chocolates, 32% of the children like noodles, 15.5% of
the children favourite confectionary product is health drinks..
INFERENCE
The majority, 32% of the children favourite confectionary product is noodles.
47
CHART NO 4.1.10
CHART SHOWING CHILD FAVORITE CONFECTIONARY PRODUCTS
(Source: primary data)
Biscuits chocolates noodles health drinks
FAVORITE CONFECTIONARY
PRODUCTS
31 33 37 19
31
33
37
19
FAVORITE CONFECTIONARYPRODUCTS
FAVORITE CONFECTIONARY PRODUCTS
48
TABLE NO 4.1.11
TABLE SHOWING FAMILIER WITH ADVERTISEMENT
S.NO.
FAMILIAR WITH
ADVERTISEMENT
NO.OF
RESPONDENTS
PERCENTAGE
1 Biscuits 22 18
2 Chocolates 57 48
3 Noodles 31 26
4 Health drinks 10 8
Total 120 100
INTERPRETATION
In the above table shows that, 18% of the children confectionary product is biscuits,
48% of the children like chocolates, 26% of the children like noodles, 8% of the children
familiar with advertisement of confectionary product is health drinks.
INFERENCE
The. Majority, 48% of the children familiar with advertisement of confectionary
product is chocolate.
49
CHART NO 4.1.11
CHART SHOWING FAMILIER WITH ADVERTISEMENT
(Source: primary data)
0
20
40
60
Biscui
ts
Choc
olate
s
Nood
les
Healt
h
drink
s
FAMILIAR WITH ADVERTISEMENT 22 57 31 10
Biscuits, 22
Chocolates, 57
Noodles, 31
Healthdrinks, 10
FAMILIAR WITH ADVERTISEMENT
50
TABLE NO 4.1.12
TABLE SHOWING TRIED TO PURCHASE WHICH PRODUCT
S.NO.
TRIED TO
PURCHASE
NO.OF
RESPONDENTS
PERCENTAGE
1 Biscuits 45 37.5
2 Noodles 33 27.5
3 Chocolates 32 27
4 Health drinks 10 8
Total 120 100
INTERPRETATION
From the above table shows that, 37.5% of the children tried to purchase biscuits after
seeing advertisement,27.5% of the ,27.5% of the children like noodles,27% of the children
are like to purchase chocolates,8% of the children like to purchase health drinks.
INFERENCE
The majority, 37.5% of the children tried to purchase a biscuits after seeing
advertisement.
51
CHART NO 4.1.12
CHART SHOWING TRIED TO PURCHASE WHICH PRODUCT
(Source: primary data)
Biscuits noodles chocolates health drinks
TRIED TO PURCHASE 45 33 32 10
0
5
10
15
20
25
30
35
40
45
50
TRIED TO PURCHASE
TRIED TO PURCHASE
52
TABLE NO 4.1.13
TABLE SHOWING MEDIA OF ADVERTISEMENT
S.NO.
MEDIA OF
ADVERTISEMENT
NO.OF
RESPONDENTS
PERCENTAGES
1 TV 22 18
2 Magazine 40 33
3 Newspaper 42 35
4 Pamphlet 16 14
Total 120 100
INTERPRETATION
In the above table shows that, 18% of the respondent seeing advertisement in tv,33%
of the respondent seeing advertisement in Magazine,35% of the respondent seeing
advertisement in Newspaper,14% of the respondent seeing advertisement pamphlet.
INFERENCE
The majority, 35 % of the respondent seeing advertisement in Newspaper.
53
CHART NO 4.1.13
CHART SHOWING MEDIA OF ADVERTISEMENT
(Source: primary data)
45
33 32
4.5
0
5
10
15
20
25
30
35
40
45
50
Tv Magazine Newspaper pamphlet
MEDIA OF ADVERTISEMENT
54
TABLE NO 4.1.14
TABLE SHOWING INFLUENCE OF PURCHASE
S.NO.
INFLUENCE TO
PURCHASE
NO.OF
RESPONDENTS
PERCENTAGE
1 It gives free tattoo 37 31
2
Your friend have
that product
34 28
3
Your favourite
cartoon character
26 22
4
You want to be like
that character
23 19
Total 120 100
INTERPRETATION
The above table shows that, 31% of the respondent are purchase because of give free
tattoos,28% of the respondents is our friend have that product,22% of the respondent our
favourite cartoon character,19% of the respondent are purchase because of they want to be
like that character.
INFERENCE
The majority,. 28% of the respondents is our friend have that product.
55
CHART NO 4.1.14
CHART SHOWING INFLUENCE OF PURCHASE
(Source: primary data)
32%
29%
21%
18%
INFLUENCE TO PURCHASE
It gives fre tatto
your friends have that product
your favorite cartoon character
you want to be like tht character
56
TABLE NO 4.1.15
TABLE SHOWING WHO INFLUENCE THE RESPONDENTS PURCHASE
S.NO.
WHO
INFLUENCES
YOUR
PURCHASE
NO.OF
RESPONDENTS
PERCENTAGE
1 Advertisement 38 31
2 Friends 45 39
3 Self 30 25
4 Children 7 5
Total 120 100
INTERPRETATION
From the above table shows that, 38% of the respondent are influences for purchase
decision in advertisement,45% of the respondents for friends ,30% of the respondent for self-
decision,7% of the respondent for children decision.
INFERENCE
The majority, 39 % of the respondent are influences our purchase decision is friends.
57
CHART NO 4.1.15
CHART SHOWING INFLUENCE YOUR PURCHASE DECISION
(Source: primary data)
0
5
10
15
20
25
30
35
40
45
Advertisement
Friends
Self
Children
38 45
30
7
INFLUENCES YOUR PURCHASE DECISION
INFLUENCES YOUR URCHASE DECISION
58
TABLE NO 4.1.16
TABLE SHOWING ADVERTISEMNET OF CONFECTIONARY PRODUCT
S.NO.
ADVERTISEMENT
OF
CONFECTIONARY
PRODUCT
NO.OF
RESPONDENTS
PERCENTAGE
1 Often 13 10
2 Rarely 45 38.5
3 Sometimes 37 31.5
4 Not at all 25 20
Total 120 100
INTERPRETATION
The above table shows that, 13% of the respondent are often in influence of
advertisement to confectionary product, 45% of the respondents for rarely, 37% of the
respondent for sometimes, 25% of the respondent for not at all.
INFERENCE
The majority, .45 % of the respondent are rarely influences of advertisement
to confectionary product.
59
CHART NO 4.1.16
CHART SHOWING ADVERTISEMNET OF CONFECTIONARY PRODUCT
(Source: primary data)
0
5
10
15
20
25
30
35
40
45
Often Rarely Sometimes not at all
ADVERTISEMENTOF CONFECTIONARYPRODUCT
INFLUENCEPURCHASEDECISION
ADVERTISEMENT OF CONFECTIONARY PRODUCT INFLUENCE PURCHASE DECISION
60
TABLE NO 4.1.17
TABLE SHOWING PURCHASE AFTER WATCHING ADVERTISEMENT
S.NO.
AFTER
WATCHING
ADVERTISEMENT
NO.OF
RESPONDENTS
PERCENTAGE
1 Often 9 8
2 Rarely 36 30
3 Sometimes 55 46
4 Not at all 20 16
Total 120 100
INTERPRETATION
From the above table shows that, 9% of the respondent are often in purchase after
watching advertisement ,36% of the respondents for rarely,55% of the respondent for
sometimes,20% of the respondent for not at all.
INFERENCE
The majority, 55% of the respondent are sometimes in purchase after watching
advertisement.
61
CHART NO 4.1.17
CHART SHOWING PURCHASE AFTER WATCHING ADVERTISEMENT
(Source: primary data)
7%
30% 46%
17%
63%
PURCHASE OF PRODUCT AFTER WATCHING
ADVERTISEMENT
Often rarely sometimes not at all
62
TABLE NO 4.1.18
TABLE SHOWING ADVERTISEMENT HELP TO MAKE BETTER SELECTION
S.NO.
ADVERTISEMENT
HELP TO BETTER
SELECTION
NO.OF
RESPONDENTS
PERCENTAGE
1 Agree 22 17
2 Disagree 39 38
3 Indifferent 59 45
Total 120 100
INTERPRETATION
In the above table shows that, 22% of the respondent are agree in advertisement help
to make better selection ,39% of the respondents for disagree,59% of the respondent for
indifferent.
INFERENCE
The majority, 59% of the respondent are indifferent in advertisement help to make
better selection.
63
CHART NO 4.1.18
CHART SHOWING ADVERTISEMENT HELP TO MAKE BETTER SELECTION
(Source: primary data)
AG R EE
D I S AG REE
I N D I F FEREN T
22
39
59
ADVERTISEMENT HELP TO BETTER SELECTION
Advertisement help to better selection
64
TABLE NO 4.1.19
TABLE SHOWING OVERALL SATISFACTION
S.NO.
OVERALL
SATISFACTION
NO.OF
RESPONDENTS
PERCENTAGE
1 Highly satisfied 13 11
2 Satisfied 50 42
3 Neutral 30 25
4 Dissatisfied 17 14
5 Highly dissatisfied 10 8
Total 120 100
INTERPRETATION
In the above table shows that, 13% of the respondent are highly satisfied in overall
satisfaction for advertisement of confectionary product, 50% of the respondents are satisfied,
30% of the respondent are neutral. 17% of the respondents are dissatisfied and 10% of the
respondent are highly dissatisfied.
INFERENCE
The majority, 50% of the respondents are satisfied in overall satisfaction.
65
CHART NO 4.1.19
CHART SHOWING OVERALL SATISFACTION
(Source: primary data)
11%
42%
25%
14%
8%
OVERALL SATISFACTION
Highly satisfied
satisfied
neutral
dissatisfied
highly dissatisfied
66
TABLE NO 4.1.20
TABLE SHOWING RECOMMENED THE PRODUCT TO YOUR FRIENDS
S.NO.
RECOMMEND
THE PRODUCT
TO YOUR
FRIENDS
NO.OF
RESPONDENTS
PERCENTAGE
1 Yes 51 43
2 No 69 57
Total 120 100
INTERPRETATION
The above table shows that, 51% of the respondent are say yes in Recommend the
product to your friends, 69% of the respondents for say no.
INFERENCE
The majority, 69% of the respondents for say no recommend the product to
your friends.
67
CHART NO 4.1.20
CHART SHOWING RECOMMENED THE PRODUCT TO YOUR FRIENDS
(Source: primary data)
0
10
20
30
40
50
60
70
YES NO
51
69
Recommendthe product to your friends
Recommend the product to your friends
68
TABLE NO 4.1.21
TABLE SHOWING INFLUENCE OF PURCHASE
FACTORS
HIGHLY
SATISFIED
SATISFIED
NEUTRAL
DISSATISFIED
HIGHLY
DISSATISFIED
NOOF
RESPONDENTS
PERCENTAGE
Advertisement
influences
31 27 50 7 5
120 100%
26% 22% 42% 6% 4%
Necessary
information
9 60 23 26 2
120 100%
8% 50% 19% 21% 2%
Advertisement
Are exaggerated
19 35 48 16 2
120 100%
16% 29% 40% 13% 2%
Irrelevant to
product
15 38 48 17 2
120 100%
12% 32% 40% 14% 2%
Influenced by an
advertisement
10 30 45 24 11
120 100%
8% 25% 38% 20% 9%
Helps us to raise
our standard of
living
11 15 42 41 11
120 100%
9% 13% 35% 34% 9%
Truthful and
ethical
9 21 41 33 16
120 100%
8% 16% 34% 28% 14%
Results in better
product
10 26 43 28 13
120 100%
8% 22% 36% 23% 11%
Result in lower
price
4 24 44 30 18
120 100%
3% 20% 37% 25% 15%
Good value of
society
13 14 38 28 27
120 100%
11% 12% 32% 23% 22%
69
INTERPRETATION:
It is observed from the above table that out of the total respondents 26% were highly
satisfied with Advertisement influences whereas 22% of respondents are satisfied, 42% were
neutral, 6% were dissatisfied and 4% were highly dissatisfied.
From the above table 8% were highly satisfied with necessary information whereas
50% of respondents are satisfied, 19% were neutral, 21% were dissatisfied and 2% were
highly dissatisfied.
In the above table 16 % were highly satisfied with Advertisement Are exaggerated
whereas 29% of respondents are satisfied, 40% were neutral, 13% were dissatisfied and 2%
were highly dissatisfied.
The above table 12% were highly satisfied with Irrelevant to product whereas 32% of
respondents are satisfied, 40% were neutral, 14% were dissatisfied and 2% were highly
dissatisfied.
From the above table 8% were highly satisfied with Influenced by an advertisement
whereas 25% of respondents are satisfied, 38% were neutral, 20% were dissatisfied and 9%
were highly dissatisfied. The above table 9% were highly satisfied with helps us to raise our
standard of living whereas 13% of respondents are satisfied, 35% were neutral, 34% were
dissatisfied and 9% were highly dissatisfied.
The above table 8% were highly satisfied with Truthful and ethical whereas 16% of
respondents are satisfied, 34% were neutral, 28% were dissatisfied and 14% were highly
dissatisfied. 8% were highly satisfied with Results in better product whereas 22% of
respondents are satisfied, 36% were neutral, 23% were dissatisfied and 11% were highly
dissatisfied.
The above table 3% were highly satisfied with Result in lower price whereas 20% of
respondents are satisfied, 37% were neutral, 25% were dissatisfied and 15% were highly
dissatisfied. From the above table 11% were highly satisfied with Good value of society
whereas 12% of respondents are satisfied, 32% were neutral, 23% were dissatisfied and 22%
were highly dissatisfied.
The survey reveals that the majority of the respondents are satisfied with the
advertisement provide necessary information.
70
TABLE 4.2
TABLE SHOWING RANK ANALYSIS
FACTORS
RANK
TOTAL
MEAN
VALUE
RANK
I II II IV V VI VII VIII
Price
19 33 18 17 11 7 9 10
447 3.72 I
19 66 54 68 55 42 63 80
Taste
17 9 11 16 23 14 18 12
553 4.60 V
17 18 33 64 11 84
12
6
96
Quality
28 6 8 11 27 14 15 11
520 4.33 III
28 12 24 44 13 84
10
5
88
Advertisement
36 7 12 10 14 7 13 22
121 1.00 II
36 7 12 10 14 7 13 22
Quantity
9 24 17 10 10 14 21 15
549 4.57 IV
9 48 51 40 50 84
14
7
120
Brand
9 23 24 25 26 27 28 29
947 7.89 VIII
9 46 72 10 13 16
19
6
232
Packing
1 7 18 20 19 25 16 14
618 5.15 VII
1 14 54 80 95 15
11
2
112
Offer and
discount
3 13 21 22 14 19 8 21
588 4.9 VI
3 26 63 88 70 11 56 168
71
INTERPRETATION
It is observed from the above table that, the factor price was ranked first by selected
sample respondents, advertisement was ranked second, quality was ranked third, and quantity
was ranked fourth. Taste was ranked fifth, offer and discount was ranked sixth, packing was
ranked seventh, brand was eighth rank by the selected sample respondents.
72
CHAPTER V
FINDING, SUGGESSTIONAND CONCLUTION
5.1 PERCENTAGE ANALYSIS:
 The majority, 60% of the respondents are male.
 Most of the respondents are in the age group of 31 – 40.
 The majority, 100% of the respondents are married.
 The majority, 100% of the respondents are have children.
 The majority, 59% of the respondents are have two children.
 Most of the respondent’s salary is less than 10000.
 The majority, 61% of the respondents are using cable connection.
 The majority, 52% of the respondents are 1 – 2 hours to watch TV.
 Most of the children like to watch reality shows.
 Most of the children favourite confectionary product is noodles.
 The majority, 50% of the children familiar with advertisement of
confectionary product is chocolate.
 Most of the children tried to purchase a biscuits after seeing advertisement.
 Most of the respondent seeing advertisement in Newspaper.
 Most of the respondents are purchase because our friend have that product.
 Most of the respondent are influences our purchase decision is friends.
73
 Most of the respondent are rarely influences of advertisement to confectionary
product.
 The majority, 55% of the respondent are sometimes in purchase after watching
advertisement.
 The majority, 59% of the respondent are indifferent in advertisement help to
make better selection.
 The majority, 50% of the respondents are satisfied in overall satisfaction.
 The majority, 69% of the respondents for say no recommend the product to
your friends.
LEVEL OF SATISFACTION
 The majority ,42% of the respondents were neutral in Advertisement
influences, 50% of respondents are satisfied with necessary information, 40%
of the respondents were neutral in Advertisement Are exaggerated, 40% of the
respondents were neutral in irrelevant to product, 38% of the respondents were
neutral in Influenced by an advertisement, 34% of the respondents were
neutral in Helps us to raise our standard of living, 35% of the respondents are
neutral in advertisement is Truthful and ethical, 36% of the respondents were
neutral in Results in better product, 37% of the respondents were neutral in
Result in lower price, 32% of the respondents were neutral in Good value of
society.
74
5.2 SUGGESTIONS:
On the basis of above conclusions following suggestions can be given:
 To some extent children have limited understanding so advertisers should not
directly persuade children to buy the product which is shown in the
advertisement.
 Advertisement must not misuse children relative inexperience.
 Children can be easily attracted by the cartoon and jingles so, as for as
confectionary products are concerned children should know all the pros and
cons of that particular product.
 It is the duty of parents to see what their children are watching on television
and if they are highly influenced by the advertisement especially of
confectionary products then parents should try to explain them what are the
pros and cons of that product by using it.
 It is suggested that parents may be educated and they educate their children
about advantages of eating healthy and disadvantages of unhealthy food.
 It is suggested that Government may also take care while formation of rules
and regulations in advertisements taking.
75
5.3 CONCLUSION:
Today, particularly young children play an important role as consumers. Especially
confectionary products (Biscuits, chocolate, noodles and health drinks) are concerned they do
not care price of which they want to buy. Also they do not care whether these products are
healthy for them or not. While they are shopping .the first thing comes in their mind to
purchase the advertised products. In this station, the advertising has a stronger effect on
younger children than the older children. Nowadays it seems that children’s impact on family
decision in shopping has been steadily increased. After the research, I was found as far as
confectionary products are concerned children sometime insist their parents to purchase to
those product for them.
As far as confectionary are concerned, children are influenced more by television
advertisements than by the other medium of advertising, Even though there are lots of tools to
show the goods are services, television was chosen as the best way that enhance the
company’s profits greatly by most of researchers. Also this research validated that among
many communication tools, television advertisements have more impact and effect on
children then other medium of advertising, children ages are important to understand the
television advertisements. Children comprehension of TV.
76
BIBLIOGRAPHY:
BOOKS:
 P.Saravanavel, Research methodology 2001.Pub: Keshav Prakasham.
Allahabad
 S.P.Gupta, Statistical method 1992, Pub: Sultan Chand & sons, New Delhi.
 Henry E-Garrett, Statistical method and Education, 2004 Vakils, Feffer and
Bombay.
 S.C Gupta Fundamentals of statistics, 2007 Himalaya publishing house, New
Delhi.
 Kothari C.R Research Methodology-Method & techniques, Wishwa,
Prakahsan (India), Edition-2, PP-23, 1.
JOURNALS:
 Advertisement and Sales Promotion Management,6th Edition
 Ogilvy David’ Ogilvy on advertisement’ by, prion books London 2000
 Indian journal of marketing ,June 2015
 Effect of advertisement on children
 Marketing Promos Targeting Children
 International Journal of marketing
77
WEBSITES:
 http://www.wikipedia.com
 http://www.chocomize.com
 http://www.biscuitsandcompany.com
 http://www.media-awareness.com
 http://www.indiamart.com
 http://www.globaldata.com
 http://www.noodlehouse.com
 http://www.internetworldstats.com
78
A STUDY ON EFFECT OF ADVERTISEMENT ON
CONFECTIONARY PRODUCT WITH SPECIAL
REFERENCE TO TIRUPUR CITY
QUESTIONNAIRE
Q1 Name :
Q2 Gender : a) Male ( ) b) Female ( )
Q3 Age : a) Below 25 b) Between 26 to 30
c) Between 31-40 d) Above 40
Q4 What is your marital status?
a) Married b) unmarried
Q5 Do you have child?
a) Yes b) No
Q6 If yes then how many child you have?
a) 1 b) 2 c) 3
Q7 What is your monthly income?
a) Less then 10000 c) Between 10001 to 15000
b) Between 15001 to 20000 d) Above 20000
Q8 Do you have TV at home?
a) Yes b) No
Q9 If yes what type of connection at home?
a) Cable b) dish
Q10 How many hours a day do you watch TV?
a) Less than 1 hour b)1-2hours c) 2-3hours d) Morethan3hours
Q11 what your child like to watch on TV?
a) Cartoons b) Reality shows c) Movies TV serials d)Others_________________
Q12 which is your child’s favorite confectionary products?
a) Biscuits b) Chocolates c) Noodles d) HealthDrinks
Q13 Are you familiar with advertisements of which of the following confectionary products?
a) Biscuits b) Chocolates c) Noodles d) Health Drinks
Q14 After watching advertisement of any confectionary products, have you ever tried to purchasethat
79
Product?
a) Yes b) No
Q15 If yes then which confectionary product you have tried to purchase after seeing advertisement?
a) Biscuit b) Noodles c) Chocolate d) Health Drink
Q16 In which media you seeing most of the advertisements?
a) TV b) Magazine c) Newspaper d) Pamphlet
Q17 What influence you to purchase the particular confectionaryproduct?
a) It gives free tattoo or any other thing b) Your friend has that product
c) Yourfavoritecartoon character d) Youwanttobelikethecharacterofthatadvertisement
Q18 What influences your purchase decisions?
a) Advertisement b) friends c) Self d) children
Q19 How often advertisements of confectionary products influence purchase decision?
a) Often b) Rarely c) Sometimes d) not at all
Q20 How often does your child insist you to purchase any confectionary product after watching
advertisement of the same?
a) Often b) Rarely c) Sometimes d) not at all
Q21 Advertisement helps to make better selection ?
a) Agree b) disagree c) indifferent
Q22 Overall satisfaction towards confectionary product?
a) Highly satisfied b) satisfied c) Neutral d) Dissatisfied e) highly dissatisfied
Q23 Will you recommend the confectionary product which you purchased to your friends?
a) Yes b) No
24.Influence of advertisement on purchase
Statement
Very high
(1)
High
(2)
Neutral
(3)
Low
(4)
Very low
(5)
Advertisement influences purchase decisions
Advertisements provides necessary information
Advertisements are exaggerated
Advertisement are irrelevant to the product
Most of my purchase are influenced by an
advertisements
Advertising helps us to raise our standard of living
80
Advertising is truthful and ethical
Advertising results in better product for public
In general advertising result in lower price
Advertising promotes good value in the society
25.Rank the influencing factors for purchasing confectionaryproduct
FACTORS
RANK
(1 to 8)
Price
Taste
Quality
Advertisement
Quantity
Brand
Packing
Offer and discount

More Related Content

What's hot

Cadbury cbbe model
Cadbury cbbe modelCadbury cbbe model
Cadbury cbbe model
Ravikumar Sangani
 
STP marketing presentation OF Cadbury Dairy Milk
STP marketing presentation OF Cadbury Dairy MilkSTP marketing presentation OF Cadbury Dairy Milk
STP marketing presentation OF Cadbury Dairy Milk
Vinish Sharma
 
Major Project Report on “STUDY ON BUYING BEHAVIOUR OF CONSUMERS FOR DIFFERENT...
Major Project Report on “STUDY ON BUYING BEHAVIOUR OF CONSUMERS FOR DIFFERENT...Major Project Report on “STUDY ON BUYING BEHAVIOUR OF CONSUMERS FOR DIFFERENT...
Major Project Report on “STUDY ON BUYING BEHAVIOUR OF CONSUMERS FOR DIFFERENT...
Mayanksng07
 
New Product Launch - Confectionery
New Product Launch - ConfectioneryNew Product Launch - Confectionery
New Product Launch - ConfectioneryKunal Mehta
 
Product differentiation
Product differentiation Product differentiation
Product differentiation
Ajilal
 
Real juice
Real juiceReal juice
Real juice
Rana987
 
Alpenliebe
AlpenliebeAlpenliebe
Alpenliebe
GauriSharma84
 
Emerging trends in marketing
Emerging trends in marketingEmerging trends in marketing
Emerging trends in marketing
viveksangwan007
 
project report on chocolate
project report on chocolate project report on chocolate
project report on chocolate
saurabh2somu
 
Report on Consumer behavior towards dairy milk
Report on Consumer behavior towards dairy milkReport on Consumer behavior towards dairy milk
Report on Consumer behavior towards dairy milk
Prateek Pawar
 
Product mix
Product mixProduct mix
Product mix
Akriti Gupta
 
CONSUMER PREFERENCE TOWARDS NESTLE AND CADBURY CHOCOLATES
CONSUMER PREFERENCE TOWARDS NESTLE   AND CADBURY CHOCOLATESCONSUMER PREFERENCE TOWARDS NESTLE   AND CADBURY CHOCOLATES
CONSUMER PREFERENCE TOWARDS NESTLE AND CADBURY CHOCOLATES
Anupama singh
 
STAGES OF NEW Product Development
STAGES OF  NEW Product DevelopmentSTAGES OF  NEW Product Development
STAGES OF NEW Product Development
Sundar B N
 
Project on marketing study of parle
Project on marketing study of parleProject on marketing study of parle
Project on marketing study of parlePayal Awere
 
Analysing consumer buying behaviour and industrial buying behaviour
Analysing consumer buying behaviour and industrial buying behaviourAnalysing consumer buying behaviour and industrial buying behaviour
Analysing consumer buying behaviour and industrial buying behaviour
SUJIT DAS
 
Brand startegies ppt
Brand startegies pptBrand startegies ppt
Sources Of Brand Equity
Sources Of Brand EquitySources Of Brand Equity
Sources Of Brand Equitywizkidrx
 
Consumer behavior towards Dark chocolate
Consumer behavior towards Dark chocolateConsumer behavior towards Dark chocolate
Consumer behavior towards Dark chocolateSHUBHADIP BISWAS
 
Brand positioning ppt (2)
Brand positioning ppt (2)Brand positioning ppt (2)
Brand positioning ppt (2)Swati Gautam
 

What's hot (20)

Cadbury cbbe model
Cadbury cbbe modelCadbury cbbe model
Cadbury cbbe model
 
STP marketing presentation OF Cadbury Dairy Milk
STP marketing presentation OF Cadbury Dairy MilkSTP marketing presentation OF Cadbury Dairy Milk
STP marketing presentation OF Cadbury Dairy Milk
 
Major Project Report on “STUDY ON BUYING BEHAVIOUR OF CONSUMERS FOR DIFFERENT...
Major Project Report on “STUDY ON BUYING BEHAVIOUR OF CONSUMERS FOR DIFFERENT...Major Project Report on “STUDY ON BUYING BEHAVIOUR OF CONSUMERS FOR DIFFERENT...
Major Project Report on “STUDY ON BUYING BEHAVIOUR OF CONSUMERS FOR DIFFERENT...
 
New Product Launch - Confectionery
New Product Launch - ConfectioneryNew Product Launch - Confectionery
New Product Launch - Confectionery
 
Product differentiation
Product differentiation Product differentiation
Product differentiation
 
Real juice
Real juiceReal juice
Real juice
 
Alpenliebe
AlpenliebeAlpenliebe
Alpenliebe
 
Emerging trends in marketing
Emerging trends in marketingEmerging trends in marketing
Emerging trends in marketing
 
project report on chocolate
project report on chocolate project report on chocolate
project report on chocolate
 
Report on Consumer behavior towards dairy milk
Report on Consumer behavior towards dairy milkReport on Consumer behavior towards dairy milk
Report on Consumer behavior towards dairy milk
 
Product mix
Product mixProduct mix
Product mix
 
CONSUMER PREFERENCE TOWARDS NESTLE AND CADBURY CHOCOLATES
CONSUMER PREFERENCE TOWARDS NESTLE   AND CADBURY CHOCOLATESCONSUMER PREFERENCE TOWARDS NESTLE   AND CADBURY CHOCOLATES
CONSUMER PREFERENCE TOWARDS NESTLE AND CADBURY CHOCOLATES
 
Word of mouth
Word of mouthWord of mouth
Word of mouth
 
STAGES OF NEW Product Development
STAGES OF  NEW Product DevelopmentSTAGES OF  NEW Product Development
STAGES OF NEW Product Development
 
Project on marketing study of parle
Project on marketing study of parleProject on marketing study of parle
Project on marketing study of parle
 
Analysing consumer buying behaviour and industrial buying behaviour
Analysing consumer buying behaviour and industrial buying behaviourAnalysing consumer buying behaviour and industrial buying behaviour
Analysing consumer buying behaviour and industrial buying behaviour
 
Brand startegies ppt
Brand startegies pptBrand startegies ppt
Brand startegies ppt
 
Sources Of Brand Equity
Sources Of Brand EquitySources Of Brand Equity
Sources Of Brand Equity
 
Consumer behavior towards Dark chocolate
Consumer behavior towards Dark chocolateConsumer behavior towards Dark chocolate
Consumer behavior towards Dark chocolate
 
Brand positioning ppt (2)
Brand positioning ppt (2)Brand positioning ppt (2)
Brand positioning ppt (2)
 

Similar to A study on effect of advertisement on confectionary product with special reference to tirupur city

126551270 project-report-on-advertising-effectiveness-doc
126551270 project-report-on-advertising-effectiveness-doc126551270 project-report-on-advertising-effectiveness-doc
126551270 project-report-on-advertising-effectiveness-doc
mohit gupta
 
Advertising, its role and importance in the marketing of consumer product
Advertising, its role and importance in the marketing of consumer productAdvertising, its role and importance in the marketing of consumer product
Advertising, its role and importance in the marketing of consumer product
ResearchWap
 
Marketing concepts pres1
Marketing concepts pres1Marketing concepts pres1
Marketing concepts pres1Virtu Institute
 
Market Research
Market Research Market Research
Market Research
Arun Khedwal
 
PROJECT REPORT ON advertisement(2012025)
PROJECT REPORT ON advertisement(2012025)PROJECT REPORT ON advertisement(2012025)
PROJECT REPORT ON advertisement(2012025)Arka Sengupta
 
Effectiveness of promotional mix element in the plastic piping business
Effectiveness of promotional mix element in the plastic piping businessEffectiveness of promotional mix element in the plastic piping business
Effectiveness of promotional mix element in the plastic piping business
mansingh rajput
 
Effectiveness of promotional mix element in the plastic piping business
Effectiveness of promotional mix element in the plastic piping businessEffectiveness of promotional mix element in the plastic piping business
Effectiveness of promotional mix element in the plastic piping business
mansingh rajput
 
Vdis10047 marketing concepts pres1
Vdis10047 marketing concepts pres1Vdis10047 marketing concepts pres1
Vdis10047 marketing concepts pres1
Virtu Institute
 
Lo1 workbook marketing & pr
Lo1 workbook marketing & prLo1 workbook marketing & pr
Lo1 workbook marketing & pr
abbydowning97
 
Project report on advertising effectiveness
Project report on advertising effectivenessProject report on advertising effectiveness
Project report on advertising effectivenessRajarshiSe
 
A STUDY ON EFFECTIVE BRAND PROMOTIONAL STRATEGIES INFLUENCING CUSTOMERS
A STUDY ON EFFECTIVE BRAND PROMOTIONAL STRATEGIES INFLUENCING CUSTOMERSA STUDY ON EFFECTIVE BRAND PROMOTIONAL STRATEGIES INFLUENCING CUSTOMERS
A STUDY ON EFFECTIVE BRAND PROMOTIONAL STRATEGIES INFLUENCING CUSTOMERS
IAEME Publication
 
Business research report
Business research reportBusiness research report
Business research report
PrinceVerma938105
 
PRODUCT MARKETING NOTES.pdf
PRODUCT MARKETING NOTES.pdfPRODUCT MARKETING NOTES.pdf
PRODUCT MARKETING NOTES.pdf
RohitJoshi749009
 
Marketing concepts.pptx
Marketing concepts.pptxMarketing concepts.pptx
Marketing concepts.pptx
Virtu Institute
 
Consumer Behavior notes mba unit number 1
Consumer Behavior notes mba unit number 1Consumer Behavior notes mba unit number 1
Consumer Behavior notes mba unit number 1
LubnaZurar
 
Study on the consumer buying behavior for shalimar paint
Study on the consumer buying behavior for shalimar paintStudy on the consumer buying behavior for shalimar paint
Study on the consumer buying behavior for shalimar paint
Prateek Gahlot
 
A study on customer satisfaction towards smartphone with special reference to...
A study on customer satisfaction towards smartphone with special reference to...A study on customer satisfaction towards smartphone with special reference to...
A study on customer satisfaction towards smartphone with special reference to...
RajaKrishnan M
 
38589161 advertising-effectiveness-research-project 2
38589161 advertising-effectiveness-research-project 238589161 advertising-effectiveness-research-project 2
38589161 advertising-effectiveness-research-project 2toufiquesano
 
principles of marketing
principles of marketingprinciples of marketing
principles of marketing
LavitaBidari
 

Similar to A study on effect of advertisement on confectionary product with special reference to tirupur city (20)

126551270 project-report-on-advertising-effectiveness-doc
126551270 project-report-on-advertising-effectiveness-doc126551270 project-report-on-advertising-effectiveness-doc
126551270 project-report-on-advertising-effectiveness-doc
 
Advertising, its role and importance in the marketing of consumer product
Advertising, its role and importance in the marketing of consumer productAdvertising, its role and importance in the marketing of consumer product
Advertising, its role and importance in the marketing of consumer product
 
Marketing concepts pres1
Marketing concepts pres1Marketing concepts pres1
Marketing concepts pres1
 
Market Research
Market Research Market Research
Market Research
 
PROJECT REPORT ON advertisement(2012025)
PROJECT REPORT ON advertisement(2012025)PROJECT REPORT ON advertisement(2012025)
PROJECT REPORT ON advertisement(2012025)
 
Effectiveness of promotional mix element in the plastic piping business
Effectiveness of promotional mix element in the plastic piping businessEffectiveness of promotional mix element in the plastic piping business
Effectiveness of promotional mix element in the plastic piping business
 
Effectiveness of promotional mix element in the plastic piping business
Effectiveness of promotional mix element in the plastic piping businessEffectiveness of promotional mix element in the plastic piping business
Effectiveness of promotional mix element in the plastic piping business
 
Vdis10047 marketing concepts pres1
Vdis10047 marketing concepts pres1Vdis10047 marketing concepts pres1
Vdis10047 marketing concepts pres1
 
Lo1 workbook marketing & pr
Lo1 workbook marketing & prLo1 workbook marketing & pr
Lo1 workbook marketing & pr
 
Project report on advertising effectiveness
Project report on advertising effectivenessProject report on advertising effectiveness
Project report on advertising effectiveness
 
A STUDY ON EFFECTIVE BRAND PROMOTIONAL STRATEGIES INFLUENCING CUSTOMERS
A STUDY ON EFFECTIVE BRAND PROMOTIONAL STRATEGIES INFLUENCING CUSTOMERSA STUDY ON EFFECTIVE BRAND PROMOTIONAL STRATEGIES INFLUENCING CUSTOMERS
A STUDY ON EFFECTIVE BRAND PROMOTIONAL STRATEGIES INFLUENCING CUSTOMERS
 
Business research report
Business research reportBusiness research report
Business research report
 
Consumer research
Consumer researchConsumer research
Consumer research
 
PRODUCT MARKETING NOTES.pdf
PRODUCT MARKETING NOTES.pdfPRODUCT MARKETING NOTES.pdf
PRODUCT MARKETING NOTES.pdf
 
Marketing concepts.pptx
Marketing concepts.pptxMarketing concepts.pptx
Marketing concepts.pptx
 
Consumer Behavior notes mba unit number 1
Consumer Behavior notes mba unit number 1Consumer Behavior notes mba unit number 1
Consumer Behavior notes mba unit number 1
 
Study on the consumer buying behavior for shalimar paint
Study on the consumer buying behavior for shalimar paintStudy on the consumer buying behavior for shalimar paint
Study on the consumer buying behavior for shalimar paint
 
A study on customer satisfaction towards smartphone with special reference to...
A study on customer satisfaction towards smartphone with special reference to...A study on customer satisfaction towards smartphone with special reference to...
A study on customer satisfaction towards smartphone with special reference to...
 
38589161 advertising-effectiveness-research-project 2
38589161 advertising-effectiveness-research-project 238589161 advertising-effectiveness-research-project 2
38589161 advertising-effectiveness-research-project 2
 
principles of marketing
principles of marketingprinciples of marketing
principles of marketing
 

More from RajaKrishnan M

Shortcomings of Demat Account
Shortcomings of Demat AccountShortcomings of Demat Account
Shortcomings of Demat Account
RajaKrishnan M
 
Demat Account Services
Demat Account ServicesDemat Account Services
Demat Account Services
RajaKrishnan M
 
Depository Participant
Depository ParticipantDepository Participant
Depository Participant
RajaKrishnan M
 
Services provided in Mobile Banking
Services provided in Mobile BankingServices provided in Mobile Banking
Services provided in Mobile Banking
RajaKrishnan M
 
Ombudsman scheme
Ombudsman scheme Ombudsman scheme
Ombudsman scheme
RajaKrishnan M
 
Factors affecting share price
Factors affecting share priceFactors affecting share price
Factors affecting share price
RajaKrishnan M
 
Rights of investors
Rights of investorsRights of investors
Rights of investors
RajaKrishnan M
 
Loss of Confidence of small investors
Loss of Confidence of small investorsLoss of Confidence of small investors
Loss of Confidence of small investors
RajaKrishnan M
 
Facilities by BSE
Facilities by BSEFacilities by BSE
Facilities by BSE
RajaKrishnan M
 
Technological forces fueling e-commerce
Technological forces fueling e-commerceTechnological forces fueling e-commerce
Technological forces fueling e-commerce
RajaKrishnan M
 
Encryption and Decryption
Encryption and DecryptionEncryption and Decryption
Encryption and Decryption
RajaKrishnan M
 
Meaning, Anatomy and Forces Fueling e-commerce
Meaning, Anatomy and Forces Fueling e-commerceMeaning, Anatomy and Forces Fueling e-commerce
Meaning, Anatomy and Forces Fueling e-commerce
RajaKrishnan M
 
Forces Fueling e-commerce
Forces Fueling e-commerceForces Fueling e-commerce
Forces Fueling e-commerce
RajaKrishnan M
 
Inter Organizational e-commerce
Inter Organizational e-commerceInter Organizational e-commerce
Inter Organizational e-commerce
RajaKrishnan M
 
Factors for the success of m-commerce
Factors for the success of m-commerceFactors for the success of m-commerce
Factors for the success of m-commerce
RajaKrishnan M
 
Advantages of E-Commerce
Advantages of E-CommerceAdvantages of E-Commerce
Advantages of E-Commerce
RajaKrishnan M
 
Types of E-Commerce
Types of E-CommerceTypes of E-Commerce
Types of E-Commerce
RajaKrishnan M
 
E-Commerce and E- Businesss
E-Commerce and E- BusinesssE-Commerce and E- Businesss
E-Commerce and E- Businesss
RajaKrishnan M
 
Electronic Data Interchange & Internet
Electronic Data Interchange & InternetElectronic Data Interchange & Internet
Electronic Data Interchange & Internet
RajaKrishnan M
 

More from RajaKrishnan M (20)

Shortcomings of Demat Account
Shortcomings of Demat AccountShortcomings of Demat Account
Shortcomings of Demat Account
 
Demat Account Services
Demat Account ServicesDemat Account Services
Demat Account Services
 
Depository Participant
Depository ParticipantDepository Participant
Depository Participant
 
Services provided in Mobile Banking
Services provided in Mobile BankingServices provided in Mobile Banking
Services provided in Mobile Banking
 
Ombudsman scheme
Ombudsman scheme Ombudsman scheme
Ombudsman scheme
 
Factors affecting share price
Factors affecting share priceFactors affecting share price
Factors affecting share price
 
Rights of investors
Rights of investorsRights of investors
Rights of investors
 
Loss of Confidence of small investors
Loss of Confidence of small investorsLoss of Confidence of small investors
Loss of Confidence of small investors
 
Facilities by BSE
Facilities by BSEFacilities by BSE
Facilities by BSE
 
Technological forces fueling e-commerce
Technological forces fueling e-commerceTechnological forces fueling e-commerce
Technological forces fueling e-commerce
 
Encryption and Decryption
Encryption and DecryptionEncryption and Decryption
Encryption and Decryption
 
Meaning, Anatomy and Forces Fueling e-commerce
Meaning, Anatomy and Forces Fueling e-commerceMeaning, Anatomy and Forces Fueling e-commerce
Meaning, Anatomy and Forces Fueling e-commerce
 
Forces Fueling e-commerce
Forces Fueling e-commerceForces Fueling e-commerce
Forces Fueling e-commerce
 
Inter Organizational e-commerce
Inter Organizational e-commerceInter Organizational e-commerce
Inter Organizational e-commerce
 
Factors for the success of m-commerce
Factors for the success of m-commerceFactors for the success of m-commerce
Factors for the success of m-commerce
 
Advantages of E-Commerce
Advantages of E-CommerceAdvantages of E-Commerce
Advantages of E-Commerce
 
Types of E-Commerce
Types of E-CommerceTypes of E-Commerce
Types of E-Commerce
 
E-Commerce and E- Businesss
E-Commerce and E- BusinesssE-Commerce and E- Businesss
E-Commerce and E- Businesss
 
RFID
RFIDRFID
RFID
 
Electronic Data Interchange & Internet
Electronic Data Interchange & InternetElectronic Data Interchange & Internet
Electronic Data Interchange & Internet
 

Recently uploaded

Adversarial Attention Modeling for Multi-dimensional Emotion Regression.pdf
Adversarial Attention Modeling for Multi-dimensional Emotion Regression.pdfAdversarial Attention Modeling for Multi-dimensional Emotion Regression.pdf
Adversarial Attention Modeling for Multi-dimensional Emotion Regression.pdf
Po-Chuan Chen
 
1.4 modern child centered education - mahatma gandhi-2.pptx
1.4 modern child centered education - mahatma gandhi-2.pptx1.4 modern child centered education - mahatma gandhi-2.pptx
1.4 modern child centered education - mahatma gandhi-2.pptx
JosvitaDsouza2
 
How libraries can support authors with open access requirements for UKRI fund...
How libraries can support authors with open access requirements for UKRI fund...How libraries can support authors with open access requirements for UKRI fund...
How libraries can support authors with open access requirements for UKRI fund...
Jisc
 
Phrasal Verbs.XXXXXXXXXXXXXXXXXXXXXXXXXX
Phrasal Verbs.XXXXXXXXXXXXXXXXXXXXXXXXXXPhrasal Verbs.XXXXXXXXXXXXXXXXXXXXXXXXXX
Phrasal Verbs.XXXXXXXXXXXXXXXXXXXXXXXXXX
MIRIAMSALINAS13
 
Biological Screening of Herbal Drugs in detailed.
Biological Screening of Herbal Drugs in detailed.Biological Screening of Herbal Drugs in detailed.
Biological Screening of Herbal Drugs in detailed.
Ashokrao Mane college of Pharmacy Peth-Vadgaon
 
The approach at University of Liverpool.pptx
The approach at University of Liverpool.pptxThe approach at University of Liverpool.pptx
The approach at University of Liverpool.pptx
Jisc
 
How to Make a Field invisible in Odoo 17
How to Make a Field invisible in Odoo 17How to Make a Field invisible in Odoo 17
How to Make a Field invisible in Odoo 17
Celine George
 
BÀI TẬP BỔ TRỢ TIẾNG ANH GLOBAL SUCCESS LỚP 3 - CẢ NĂM (CÓ FILE NGHE VÀ ĐÁP Á...
BÀI TẬP BỔ TRỢ TIẾNG ANH GLOBAL SUCCESS LỚP 3 - CẢ NĂM (CÓ FILE NGHE VÀ ĐÁP Á...BÀI TẬP BỔ TRỢ TIẾNG ANH GLOBAL SUCCESS LỚP 3 - CẢ NĂM (CÓ FILE NGHE VÀ ĐÁP Á...
BÀI TẬP BỔ TRỢ TIẾNG ANH GLOBAL SUCCESS LỚP 3 - CẢ NĂM (CÓ FILE NGHE VÀ ĐÁP Á...
Nguyen Thanh Tu Collection
 
Operation Blue Star - Saka Neela Tara
Operation Blue Star   -  Saka Neela TaraOperation Blue Star   -  Saka Neela Tara
Operation Blue Star - Saka Neela Tara
Balvir Singh
 
Honest Reviews of Tim Han LMA Course Program.pptx
Honest Reviews of Tim Han LMA Course Program.pptxHonest Reviews of Tim Han LMA Course Program.pptx
Honest Reviews of Tim Han LMA Course Program.pptx
timhan337
 
Unit 8 - Information and Communication Technology (Paper I).pdf
Unit 8 - Information and Communication Technology (Paper I).pdfUnit 8 - Information and Communication Technology (Paper I).pdf
Unit 8 - Information and Communication Technology (Paper I).pdf
Thiyagu K
 
The French Revolution Class 9 Study Material pdf free download
The French Revolution Class 9 Study Material pdf free downloadThe French Revolution Class 9 Study Material pdf free download
The French Revolution Class 9 Study Material pdf free download
Vivekanand Anglo Vedic Academy
 
TESDA TM1 REVIEWER FOR NATIONAL ASSESSMENT WRITTEN AND ORAL QUESTIONS WITH A...
TESDA TM1 REVIEWER  FOR NATIONAL ASSESSMENT WRITTEN AND ORAL QUESTIONS WITH A...TESDA TM1 REVIEWER  FOR NATIONAL ASSESSMENT WRITTEN AND ORAL QUESTIONS WITH A...
TESDA TM1 REVIEWER FOR NATIONAL ASSESSMENT WRITTEN AND ORAL QUESTIONS WITH A...
EugeneSaldivar
 
Guidance_and_Counselling.pdf B.Ed. 4th Semester
Guidance_and_Counselling.pdf B.Ed. 4th SemesterGuidance_and_Counselling.pdf B.Ed. 4th Semester
Guidance_and_Counselling.pdf B.Ed. 4th Semester
Atul Kumar Singh
 
"Protectable subject matters, Protection in biotechnology, Protection of othe...
"Protectable subject matters, Protection in biotechnology, Protection of othe..."Protectable subject matters, Protection in biotechnology, Protection of othe...
"Protectable subject matters, Protection in biotechnology, Protection of othe...
SACHIN R KONDAGURI
 
678020731-Sumas-y-Restas-Para-Colorear.pdf
678020731-Sumas-y-Restas-Para-Colorear.pdf678020731-Sumas-y-Restas-Para-Colorear.pdf
678020731-Sumas-y-Restas-Para-Colorear.pdf
CarlosHernanMontoyab2
 
Lapbook sobre os Regimes Totalitários.pdf
Lapbook sobre os Regimes Totalitários.pdfLapbook sobre os Regimes Totalitários.pdf
Lapbook sobre os Regimes Totalitários.pdf
Jean Carlos Nunes Paixão
 
Synthetic Fiber Construction in lab .pptx
Synthetic Fiber Construction in lab .pptxSynthetic Fiber Construction in lab .pptx
Synthetic Fiber Construction in lab .pptx
Pavel ( NSTU)
 
Language Across the Curriculm LAC B.Ed.
Language Across the  Curriculm LAC B.Ed.Language Across the  Curriculm LAC B.Ed.
Language Across the Curriculm LAC B.Ed.
Atul Kumar Singh
 
Welcome to TechSoup New Member Orientation and Q&A (May 2024).pdf
Welcome to TechSoup   New Member Orientation and Q&A (May 2024).pdfWelcome to TechSoup   New Member Orientation and Q&A (May 2024).pdf
Welcome to TechSoup New Member Orientation and Q&A (May 2024).pdf
TechSoup
 

Recently uploaded (20)

Adversarial Attention Modeling for Multi-dimensional Emotion Regression.pdf
Adversarial Attention Modeling for Multi-dimensional Emotion Regression.pdfAdversarial Attention Modeling for Multi-dimensional Emotion Regression.pdf
Adversarial Attention Modeling for Multi-dimensional Emotion Regression.pdf
 
1.4 modern child centered education - mahatma gandhi-2.pptx
1.4 modern child centered education - mahatma gandhi-2.pptx1.4 modern child centered education - mahatma gandhi-2.pptx
1.4 modern child centered education - mahatma gandhi-2.pptx
 
How libraries can support authors with open access requirements for UKRI fund...
How libraries can support authors with open access requirements for UKRI fund...How libraries can support authors with open access requirements for UKRI fund...
How libraries can support authors with open access requirements for UKRI fund...
 
Phrasal Verbs.XXXXXXXXXXXXXXXXXXXXXXXXXX
Phrasal Verbs.XXXXXXXXXXXXXXXXXXXXXXXXXXPhrasal Verbs.XXXXXXXXXXXXXXXXXXXXXXXXXX
Phrasal Verbs.XXXXXXXXXXXXXXXXXXXXXXXXXX
 
Biological Screening of Herbal Drugs in detailed.
Biological Screening of Herbal Drugs in detailed.Biological Screening of Herbal Drugs in detailed.
Biological Screening of Herbal Drugs in detailed.
 
The approach at University of Liverpool.pptx
The approach at University of Liverpool.pptxThe approach at University of Liverpool.pptx
The approach at University of Liverpool.pptx
 
How to Make a Field invisible in Odoo 17
How to Make a Field invisible in Odoo 17How to Make a Field invisible in Odoo 17
How to Make a Field invisible in Odoo 17
 
BÀI TẬP BỔ TRỢ TIẾNG ANH GLOBAL SUCCESS LỚP 3 - CẢ NĂM (CÓ FILE NGHE VÀ ĐÁP Á...
BÀI TẬP BỔ TRỢ TIẾNG ANH GLOBAL SUCCESS LỚP 3 - CẢ NĂM (CÓ FILE NGHE VÀ ĐÁP Á...BÀI TẬP BỔ TRỢ TIẾNG ANH GLOBAL SUCCESS LỚP 3 - CẢ NĂM (CÓ FILE NGHE VÀ ĐÁP Á...
BÀI TẬP BỔ TRỢ TIẾNG ANH GLOBAL SUCCESS LỚP 3 - CẢ NĂM (CÓ FILE NGHE VÀ ĐÁP Á...
 
Operation Blue Star - Saka Neela Tara
Operation Blue Star   -  Saka Neela TaraOperation Blue Star   -  Saka Neela Tara
Operation Blue Star - Saka Neela Tara
 
Honest Reviews of Tim Han LMA Course Program.pptx
Honest Reviews of Tim Han LMA Course Program.pptxHonest Reviews of Tim Han LMA Course Program.pptx
Honest Reviews of Tim Han LMA Course Program.pptx
 
Unit 8 - Information and Communication Technology (Paper I).pdf
Unit 8 - Information and Communication Technology (Paper I).pdfUnit 8 - Information and Communication Technology (Paper I).pdf
Unit 8 - Information and Communication Technology (Paper I).pdf
 
The French Revolution Class 9 Study Material pdf free download
The French Revolution Class 9 Study Material pdf free downloadThe French Revolution Class 9 Study Material pdf free download
The French Revolution Class 9 Study Material pdf free download
 
TESDA TM1 REVIEWER FOR NATIONAL ASSESSMENT WRITTEN AND ORAL QUESTIONS WITH A...
TESDA TM1 REVIEWER  FOR NATIONAL ASSESSMENT WRITTEN AND ORAL QUESTIONS WITH A...TESDA TM1 REVIEWER  FOR NATIONAL ASSESSMENT WRITTEN AND ORAL QUESTIONS WITH A...
TESDA TM1 REVIEWER FOR NATIONAL ASSESSMENT WRITTEN AND ORAL QUESTIONS WITH A...
 
Guidance_and_Counselling.pdf B.Ed. 4th Semester
Guidance_and_Counselling.pdf B.Ed. 4th SemesterGuidance_and_Counselling.pdf B.Ed. 4th Semester
Guidance_and_Counselling.pdf B.Ed. 4th Semester
 
"Protectable subject matters, Protection in biotechnology, Protection of othe...
"Protectable subject matters, Protection in biotechnology, Protection of othe..."Protectable subject matters, Protection in biotechnology, Protection of othe...
"Protectable subject matters, Protection in biotechnology, Protection of othe...
 
678020731-Sumas-y-Restas-Para-Colorear.pdf
678020731-Sumas-y-Restas-Para-Colorear.pdf678020731-Sumas-y-Restas-Para-Colorear.pdf
678020731-Sumas-y-Restas-Para-Colorear.pdf
 
Lapbook sobre os Regimes Totalitários.pdf
Lapbook sobre os Regimes Totalitários.pdfLapbook sobre os Regimes Totalitários.pdf
Lapbook sobre os Regimes Totalitários.pdf
 
Synthetic Fiber Construction in lab .pptx
Synthetic Fiber Construction in lab .pptxSynthetic Fiber Construction in lab .pptx
Synthetic Fiber Construction in lab .pptx
 
Language Across the Curriculm LAC B.Ed.
Language Across the  Curriculm LAC B.Ed.Language Across the  Curriculm LAC B.Ed.
Language Across the Curriculm LAC B.Ed.
 
Welcome to TechSoup New Member Orientation and Q&A (May 2024).pdf
Welcome to TechSoup   New Member Orientation and Q&A (May 2024).pdfWelcome to TechSoup   New Member Orientation and Q&A (May 2024).pdf
Welcome to TechSoup New Member Orientation and Q&A (May 2024).pdf
 

A study on effect of advertisement on confectionary product with special reference to tirupur city

  • 1. 1 CHAPTER - I INTRODUCTION OF THE STUDY 1.1. MARKETING: MEANING OF MARKETING: Marketing is communicating the value of a product or service to customers, for the purpose of selling that product or service. Marketing techniques include choosing target markets through market analysis and market segmentation, as well as understanding consumer behaviour and advertising a product's value to the customer. From a societal point of view, marketing is the link between a society's material requirements and its economic patterns of response. Marketing satisfies these needs and wants through exchange processes and building long-term relationships. Marketing blends art and applied science (such as behavioural sciences) and makes use of technology. Marketing is applied in enterprise and organizations through marketing management. MARKETTING-DEFINITION: According to Philip kotlar “any inter personal or inter organizational relationship involving an exchange (a transaction) is marketing. According to American Marketing Association (AMA) the term marketing is concerned with the place and the activities Involved in the flow of goods and services from the producer to consumer. According to W.J.Standon marketing is “a total system of business activities designed to plan, price, promote and distribute want satisfying goods and services to present and potential customer
  • 2. 2 1.2 ADVERTISING: The word advertising is derived from the Latin word viz, "advertero" "ad" meaning towards and "verto" meeting towards and "verto" meaning. "I turn" literally specific thing". Simply stated advertising is the art "says green." Advertising is a general term for and all forms of publicity, from the cry of the street boy selling newspapers to the most celebrate attention attracts device. The object always is to bring to public notice some articles or service, to create a demand to stimulate buying and in general to bring logethel the man with something to sell and the man who has means or desires to buy". Advertising has been defined by different experts. Some of the quoted definition are American marketing association has defined advertising as "any paid form of non-personal presentation and promotion of ideas, goods or services by an identified sponsor. The medium used are print broad cast and direct. Stanton deserves that “Advertising consists of all the activities involved in presenting to a group a non- personal, oral or visual openly, sponsored message regarding a product, service, or idea. This message called an advertisement is disseminated through one or more media and is paid for by the identified sponsor. Advertising is any paid form of non – personal paid of presentation of ideas goods or services by an identified sponsor. Basic Features of Advertising On the basis of various definitions it has certain basic features such as: 1. It is a mass non-personal communication. 2. It is a matter of record. 3. It persuades buyers to purchase the goods advertised. 4. It is a mass paid communication. 5. The communication media is diverse such as print (newspapers and magazines) 6. It is also called printed salesmanship because information is spread by means of the written and printed work and pictures so that people may be induced to act upon it.
  • 3. 3 Functions of Advertising For many firms advertising is the dominant element of the promotional mix – particulars for those manufacturers who produce convenience goods such as detergent, non – prescription drugs, cosmetics, soft drinks and grocery products. Advertising is also used extensively by maters of automobiles, home appliances, etc., to introduce new product and new product features its uses its attributes, pt. availability etc. Advertising can also help to convince potential buyers that a firm’s product or service is superior to competitor’s product in make in quality, in price etc. it can create brand image and reduce the likelihood of brand switching even when competitors lower their prices or offer some attractive incentives. Advertising is particularly effective in certain other spheres too such as: i) When consumer awareness of products or service is at a minimum. ii) When sales are increasing for all terms in an industry. iii) When a product is new and incorporates technological advance not strong and. iv) When primary buying motive exists. It performance the following functions: i) Promotion of sales ii) Introduction of new product awareness. iii) Mass production facilitation iv) Carry out research v) Education of people.
  • 4. 4 1.3 ADVERTISING OBJECTIVES: The long term objectives of advertising are broad and general, and concern the contribution advertising should make to the achievement of overall company objectives. Most companies regard advertising main objective as hat of proving support to personal selling and other forms of promotion. But advertising is a highly versatile communications tools and may therefore by used for achieving various short and long term objectives. Among these objectives are the following: 1. To do the entire selling job (as in mail order marketing). 2. To introduce a new product (by building brand awareness among potential buyers). 3. To force middlemen to handle the product (pull strategy). 4. To build brand preference 9by making it more difficult for middleman to sell substitutes). 5. To remind users to buy the product (retentive strategy). 6. To publicize some change in marketing strategy (e.g., a price change, a new model or an improvement in the product). 7. To provide rationalization (i.e. socially acceptable excuses). 8. To combat or neutralize competitors advertising. 9. To improve the moral of dealers and/or sales people (by showing that the company is doing its share of promotion). 10. To acquaint buyers and prospects with the new uses of the product (to extend the PLC).
  • 5. 5 1.4. STATEMENT OF PROBLEM: To find out how consumers are influenced by the advertisements especially of confectionary products. So the statement of this project would be ‘Effect of Advertisements on confectionary products with special reference to Tirupur city’ the research process goes within the following confectionary products:  Biscuit  Chocolates  Noodles  Health Drinks
  • 6. 6 1.5 SCOPE OF THE STUDY: This study has been under taken to find out the effectiveness of advertisement on confectionary products among the people in Tirupur city. This study is confined to the city of Tirupur only considering the ultimate of the local customer.
  • 7. 7 1.6 OBJECTIVES OF THE STUDY:  To know about the awareness of confectionary product.  To know about the awareness of confectionary product advertisement.  To study the impact of advertisement of confectionary product.  To examine the impact of advertisement on buying behaviour.  To find out the influence level of television advertisement.  To offer suggestion and conclusion on the basis of finding of the study.
  • 8. 8 1.7. RESEARCH METHODOLOGY: MEANING FOR RESEARCH Research in common parlance refers to search for knowledge. One can also define research as a scientific and systematic search for pertinent information on a specific topic. The advanced leaner’s dictionary of current English lays down the meaning of research as “a careful investigation or inquiry especially through search for new facts in any branch of knowledge. MEANING FOR RESEARCH METHODOLOGY Research methodology is a way to systematically solve the research problem. It may be understood as a science of studying how research is done scientifically. In it we study the various steps that are generally adopted by a researcher in studying his research problem along with the logic behind them. RESEARCH DESIGN Research design is the blue print of the proposed study. It represents the overall scheme of the study. “All research design is the logical and systematic planning and it helps directing piece of research. “The research design of this descriptive research studies. DESCRIPTIVE RESEARCH DESIGN Descriptive research studies are those studies concerned with describing the characteristics of a particular group. Such studies are concerned with specific predictions, with narration of facts and characteristics concerning group or situation. SAMPLE DESIGN A sample design is a definite plan for obtaining a sample from a given population. It refers to the technique or the procedure the researcher would adopt in selecting items for the sample. Sample design may as well lay down the number of items to be included in the sample i.e., the size of the sample. Sample design is determined before data are collected. SAMPLE SIZE An important decision that has to be taken in adopting a sampling technique is about the size of the sample means number of 120 sampling units selected from the population for investigation. Different opinion have expressed by experts on this point.
  • 9. 9 PERIOD OF DATA COLLECTION The data collection was made during the month of December 14 to January 15. Every respondent was given with a separate questionnaire and generally the respondent took 25-30 minutes to fill-up the questionnaire. To enable the respondents for clear understanding of each and every question asked in the questionnaire, various terms used in the questions such as comparing the effectiveness of confectionary product were clearly explained by the researcher.
  • 10. 10 1.8. ANALYSIS AND TOOLS: PERCENTAGE ANALYSIS Percentages are often used in data presentation for them simply numbers, reducing all of them to a 0 to 120 range. Through the use of percentages, the data are reduced in the standard form with base to 120 which fact facilitates relative comparisons. No of respondents Percentage analysis = ---------------------------- * 100 Total no of respondents LIKERT SCALE METHOD Scaling technique Scaling describe the procedures of assessing numbers of various degrees of opinion, attitude and other concepts. This can be done in two ways via,  Marketing a judgments about some characteristics of an individual and then placing him directory on a scale that has been defined in terms of that characteristics, and  Constructing questionnaires in such a way that the score of individual and responses assigns him a place on scale. It may be stated here that the scale is a continuum, consisting of the highest point and the lowest points along with several intermediate point between these two extreme points.  Scaling may be defined as “procedure for the assignment of numbers to a property of objects in order to impart some of the characteristics of number of the properties in the question”. LIKERT-TYPE SCALES Summated scales or Likert-type scales is one of the scaling technique. They are developed by utilizing the item analysis approach where in a particular item is evaluated on the basis of how well it discriminates between those persons whose total scores is high and those whose score is low. Each response is given a numerical score, indicating its favourableness or Unfavourableness and the scores are totalled to measure the respondent’s attitude. In a linkert scale the respondents is asked to respond to each of statement in term of several degree of agreement.
  • 11. 11 For example: When asked to express opinion whether one considered his job satisfaction of the respondent may respondent in any following ways,  Highly satisfaction  Satisfaction  Neutral  Highly dissatisfaction  Dissatisfaction
  • 12. 12 1.9 LIMITATION OF THE STUDY:  The finding of the respondents does not in constant, one so it is not a real result or real opinion.  Time of the study was limited only 6 months.  The number of the respondents was limited to 120 only.  The study was conducted at Tirupur. So it is applicable only to Tirupur.  In this study some statistical tools like, percentages were applied for working some analysis; these statistical tools have their own limitations.
  • 13. 13 1.10 CHAPTER SCHEME: Chapter I This chapter deals with introduction of the study , meaning of marketing, advertising, advertising objectives, statement of problem, scope of the study, objectives of the study, research methodology, analysis and tools and limitation of the study. Chapter II This chapter deals with the review of literature. Chapter III This chapter deals with the role of advertising and confectionary product. Chapter IV This chapter contains analysis and interpretation of data. The analysis consists of simple percentage analysis, Likert scale method. Chapter V This chapter deals with finding, suggestions and conclusion.
  • 14. 14 CHAPTER II REVIEW OF LITERATURE: Review of literature is the study of the prevalent materials related to topic of research .This helps the researcher to get a clear idea about the particular field. It is important for the researcher to carry out the research successfully. It is further intended to serve as a means of exchanging information with the hope that it could prevent further implications of the respondents to determine what is already known from similar research. The knowledge of other research literature is very important for marketing research. Either to prove or disprove his findings with those or others certain number of literature has been review of enlisted. Halan (2012)1 and Singh have pointed out that advertisement constitute a major consumer market, with direct purchasing power for snacks and sweets, and indirect purchase influence while shopping. Ahuja et al. (2013)2 have found that in western countries, consumers have reported to wield a lot of influence in purchase decisions for children products such as snacks. Mehrotra et al. (2010)3 have noted that no particular attitude or set of attitude can be applied for all products. Confectionery purchases are affected due to festival seasons (The confectioner-2006 issue by Jey zemke). According to Seiter (2011)4 the most common persuasive strategy employed in advertising to associate the product with fun and happiness, rather than to provide any factual product related information. 1 . Halan, Deepak. (2002). “Why Kids Mean Business,” Indian Management, December, 46-49. 2 Ahuja, R. D. B. andK.M. Stinson. (1993). “Female-Headed Single Parent Families: An Exploratory Study of Children’s Influence in Family Decision Making.” Advances in Consumer Research, 20, 469-474. 3 Mehrotra, S. andS. Torges. (1977). “Determinationof Children’s Influence on Mothers’ Buying Behavior.” In Advances in Consumer Research, 4, William D. Perreault Jr. (Ed.), Atlanta, GA: Association for Consumer Research, 56 -60. 4 Seiter, E. 1993. Sold Separately: Children and Parents in Consumer Culture. New Brunswick, NJ: Rutgers University Press.
  • 15. 15 According to Singh (2013)5 Indian market is not by a large space, an easy audience to target for the advertisers. The one billion people of the country are speckled in terms of beliefs, ethnicity, states, culture, language, dialects, norms and values. Other aspects such as the economic discrepancy in the country separates it in a way which has resulted in a large number of lower and upper middle class, with a very small class falling under in the middle class. This demonstrates a vast disparity in the buying power and decision making clout, one which the advertisers should keep in mind. Indian advertisement has been placing a vital amount of importance on both recall and persuasion as brand differentiating messages. (Dixit, 2011)6 Very often, various advertising styles are used by advertisers to influence consumer brand choice behaviour and among these different available choices one very popular choice is Advertisement Endorsements. Surabhi B. Prasad & Ravi Girdhar (2014)7 have come up with a model that is a function of several input parameters, their priorities and the correlation score between the parameter and endorsement effectiveness. The paper first examines the various facets of advertisement and the impact on brand equity. A through literature survey has been made in light of which the arguments have been substantiated. Neha Taleja, (2001)8 studied the impact of advertisement on brands. While the magnitude of the impact of effectiveness of advertisement remains under the purview of gray spectacles, the research has established reasoning to the impact of advertisement on brands and reveals that the level and the magnitude of the effect vary with the advertisement and the product category and that most of the endorsements have a favourable impact. 5 Singh, D. (1998).“Childrenas Consumers.” Indian Management, September, 78- 81. 6 Dixit, Daneshvary,R, Schwer, RK (2000) „The association endorsement andconsumers intentiontopurchase, Journal of Consumer Marketing, Volume: 17Issue: 3 Page: 203– 213ISSN: 0736-3761 7 Kelly, K.J.; Slater, M.D. andKaran,D. (2002).Image advertisements influence onadolescents perception of the desirability of beer and cigarettes. Journal of Public Policy and Marketing 21 (2), pp. 295-304. 8 Farrell, KA, Karels, GV, Montfort,KW andMcClatchy, CA 2000, Managerial Finance,Volume: 26 Issue: 7 Page: 1 – 15 ISSN: 0307-4358
  • 16. 16 A study conducted by Irene Roozen (2008)9 analysed two aspects one was to find the implication that the advertisement endorser brings to the product and to the consumer for different product categories and Arabian Journal of Business and Management Review (OMAN Chapter) Vol. 1, No.7; February 2012 86 the other was the extent to which these effects vary across different product categories. The research was based on written questionnaires and the study analysed the impact of female international advertisement endorsers in respect of three different product categories namely, high involvement, low involvement and the beauty products and concluded that the celebrities are considered to have the highest expertise for beauty products with much lower scores for candy bars (low involvement) and lap-tops (high involvement). Kalliny, Morris; Beydoun, Abdul-Rahman; Saran, Anshu; Gentry, Lance (2009)10 the research has investigated into the use of advertisement in TV commercial endorsements. The study has compared the use of effectiveness of advertisement in terms of two fundamental cultural dimensions: 1) low versus high context and 2) individualism versus collectivism. This paper has also an attempted to find out the frequency of advertisement use and identify the characteristics of celebrities used and the products their use is associated with. Angela Byrne, Maureen Whitehead, Steven Breen (2014)11 study the process of transference of advertisement images to the products image by examining the usage of effectiveness of advertisement in the formation of the retail image of a leading European grocery distribution group. The analysis relates to a field research with consumers and interviews with advertising agency personnel who have identified the criterion for the choice of a celebrity. The extent to which the market place recognizes and consumers associate themselves with the image of a advertisement endorser is explored. 9 Alsmadi, Amos, C, Holmes, G and Strutton, D (2008), International Journal of Advertising, Vol.27, No. 2, pp.209 -234 10 Kelly, K.J.; Slater, M.D. andKaran,D. (2002).Image advertisements influence onadolescents perception of the desirability of beer and cigarettes. Journal of Public Policy and Marketing 21 (2), pp. 295-304. 11 Confectionerypurchases are affected due to festival seasons (The confectioner -2006 issue by Angela Byrne, Maureen Whitehead).
  • 17. 17 In a survey, titled “Impact of Effectiveness of advertisement on Buying Behaviour of Customers” the focus was laid on the risks and returns involved in using advertisement to influence the purchase behaviour of the consumers. The outcome of the research was that, it substantiated the fact that advertisement do have an impact in the Indian scenario. The critical analysis of the research convinced that the consumers seek variety of aspects like credibility, likeability, fit between the brand and the celebrity. The research also concluded that from the viewpoint of the celebrity, it is not only the financial gains that matters but also the impact that the endorsement might do to their image. The research findings also laid stress on the fact that the association of the advertisement with any type of controversy or ill- behaviour did have a negative impact on the endorsement.
  • 18. 18 CHAPTER III THE ROLE OF ADVERTISING: Advertising is the means by which goods or services are promoted to the public. The advertiser’s goal is to increase sales of these goods or services by drawing people’s attention to them and showing them in a favourable light. The mission of advertiser is to reach prospective customers and influence their awareness, attitudes and buying behaviour. They spend a lot of money to keep individuals (markets) interested in their products. To succeed, they need to understand what makes potential customers behave the way they do. For advertising to exist, a number of factors have to be in place The goods and services to be advertised Advertising is a marketing function, and Kotler claims that advertising can have a number of different, possible objectives. One objective can be to inform customers about new product or a price change. The main objective here is to build primary demand. Another objective can be to persuade the customer to purchase the product. The use advertising as a way to build preference and to encourage customers to change brand. The fundamental purpose of advertising is to influence people to purchase various goods and products. In this sense advertising is a phenomenon that aims to persuade or influence people. What is the role of advertising in the demand function? One response of this question is that a company can sell more of its product by informing consumers about the product. The information may include its existence, price, promotion, quality, etc. Therefore advertising is seen as providing information to consumers. The other response is that advertising searches the way of persuading consumers to purchase the advertised products by appeals to snobbery, associations of the product with favoured people or situations, repetition of the same message and so on. Advertising shows the last style and the new popular products in the market. It displays ideal individuals wearing the new clothes and looking good. Customers are jealous of this perfection. So that, they go out and purchase in hopes of reaching perfection. There is a time dimension at advertising. Advertisement’s influence on sales is immediate (i.e. it is mostly felt within seven days of an advertisement’s exposure). A repetition of such effects, measured at the end of a year, amounts to a medium-term influence. The immediate influence of
  • 19. 19 advertising on sales plays a gatekeeper role to all further effects. Without it there will not be medium term effect (i.e. a repetition of short-term effects); and long-term effect. Advertisement’s full effect can be only valued if its long-term influence is taken into account as well as its short and medium-term effects on sales. These terms make it possible to evaluate the productivity of an advertising campaign; to measure if the campaign shows a financial return on the investment and is thus accountable According to Doole & Lowe (2004), advertising is the most important part of the whole marketing strategy. There are many channels of media to use for advertising, for example television, printed media, radio, cinema, outdoor and transport poster. Marketers use television as the most powerful medium of communication INDIAN ADVERTISING INDUSTRY The Indian advertising industry is talking business today. It has evolved from being a small-scale business to a full-fledged industry. It has emerged as one of the major industries and tertiary sectors and has broadened its horizons be it the creative aspect, the capital employed or the number of personnel involved. Indian advertising industry in very little time has carved a niche for itself and placed itself on the global map. Indian advertising industry with an estimated value of 13, 200-crore has set eyeballs gazing with some astonishing pieces of work that it has given in the recent past. The creative minds that the Indian advertising industry incorporates have come up with some mind- boggling concepts and work that can be termed as masterpieces in the field of advertising. Advertising agencies in the country too have taken a leap. They have come a long way from being small and medium sized industries to becoming well known brands in the business. Mudra, Ogilvy and Mather (O&M), Mccann Ericsonn, Rediffussion, Leo Burnett are some of the top agencies of the country.
  • 20. 20 Indian economy is on a boom and the market is on a continuous trail of expansion. With the market gaining grounds Indian advertising has every reason to celebrate. Businesses are looking up to advertising as a tool to cash in on lucrative business opportunities. Growth in business has lead to a consecutive boom in the advertising industry as well. The Indian advertising today handles both national and international projects. This is primarily because of the reason that the industry offers a host of functions to its clients that include everything from start to finish that include client servicing, media planning, media buying, creative conceptualization, pre and post campaign analysis, market research, marketing, branding, and public relation services. Keeping in mind the current pace at which the Indian advertising industry is moving the industry is expected to witness a major boom in the times ahead. If the experts are to be believed then the industry in the coming times will form a major contribution to the GDP. With all this there is definitely no looking back for the Indian advertising industry that is all set to win accolades from the world over. With development in the technology, various avenues are opening up in advertising industry. It is estimated that about 2.2 billion dollars are generated in this industry every year. Be it is print, radio, television or Internet, every medium plays a significant role in the growth of this industry. Today, Advertising Industry in India is surging with revenues. To meet all the demands in adverting sector, many agencies are coming to the scene. India is a hub of creativity and this is evident from the fact that more and more people from Indian advertising industry are being accepted world over and imposing a lot of respect in international advertising community. Visibility is the mantra of success these days and advertising makes sure that your product, service is visible; thus saleable. Today Advertising Industry in India is booming with revenue. It is a very successful industry which generates lot of revenue. The Advertising Industry in India is getting recognized worldwide with its superior quality work and innovation. It ensures tremendous growth and scope for the employees.
  • 21. 21 During fiscal 2005, the gross advertising spend in India is estimated at Rs 111 billion, and is expected to grow at 14.2% to reach Rs. 127 billion by fiscal 2006. The key factors which have contributed to growth of the Indian advertising industry include: - Growth in media vehicles leading to increase in media infiltration. - Higher degree of competitive concentration among consumer companies - Entry of global consumer companies with large advertising budgets CONFECTIONARY PRODUCT Confections are defined by the presence of sweeteners. These are usually sugars, but it is possible to buy sugar-free sweets, such as sugar-free peppermints. The most common sweetener for home cooking is table sugar, which is chemically a disaccharide containing both sucrose and fructose. Hydrolysis of sucrose gives a mixture called invert sugar, which is sweeter and is also a common commercial ingredient. Finally confections, especially commercial ones, are sweetened by a variety of syrups obtained by hydrolysis of starch. These sweeteners include all types of corn syrup Confectionery, also called sweets or biscuits, is sweet food. The term varies among English-speaking countries. In general, though, confectionery is divided into two broad and somewhat overlapping categories, bakers' confections and sugar confections. Bakers' confectionery, also called flour confections, includes principally sweet pastries, cakes, and similar baked goods. In the Middle East and Asia, flour-based confections are more dominant. Sugar confectionery includes sweets, candied nuts, chocolates, chewing gum and bubble-gum, sweetmeats, pastillage, and other confections that are made primarily of sugar. In some cases, chocolate confections (confections made of chocolate) are treated as a separate category, as are sugar-free versions of sugar confections. The words candy (US and Canada), sweets (UK and Ireland), and lollies (Australia and New Zealand) are common words for the most common varieties of sugar confectionery.
  • 22. 22 The confectionery industry also includes specialized training schools and extensive historical records. Traditional confectionery goes back to ancient times, and continued to be eaten through the middle Ages into the modern era Chocolate is a typically sweet, usually brown food preparation of Theobroma cacao seeds, roasted and ground, and often flavoured with vanilla. It is made in the form of a liquid, paste, or in a block, or used as a flavouring ingredient in other foods. Cacao has been cultivated by many cultures for at least three millennia in Mesoamerica. The earliest evidence of use traces to the Mokaya, with evidence of chocolate beverages dating back to 1900 BCE. CHOCOLATE Chocolate is a confection made from cacao beans, the seeds of the cacao plant. There are a large number of products made from it on the market, from powdered cocoa for making drinks to white chocolate, and most markets carry a cross-section of confections for their customers. In addition to being available at general markets and grocery stores, chocolate can also be purchased from specialty companies which make luxury and distinctive confections. Cacao originated in Central America. Today, cacoa is mostly grown in South and Central America and in West Africa. Some countries in Asia are also starting to grow the crop. There are actually several varieties of the cacao plant, all of which produce chocolates with slightly different flavours. The flavour is also impacted by where the plant it grown, how it is handled after harvest, and how it is processed. Companies invest a great deal of money in developing ideal blends of cacao beans to create the flavours their consumers are used to. Cacao beans grow in large pods which are harvested once they ripen and then allowed to ferment. Initially, the cacao beans are extremely bitter; the fermentation process softens the bitterness, allowing producers to move on the next steps, roasting and hulling. Roasting helps to develop the flavour of the beans, while shelling exposes the cacao nibs, the portion of the bean which has all the flavour.
  • 23. 23 BISCUITS Biscuit is a term used for a diverse variety of baked, commonly flour-based food products. The term is applied to two distinct products in North America and the Commonwealth of Nations and Europe. The North American biscuit is typically a soft, leavened quick bread, and is covered in the article Biscuit. This article covers the other type of biscuit, which is typically hard, flat and unleavened.
  • 24. 24 NOODLES Noodles are a staple food in many cultures made from unleavened dough which is stretched, extruded, or rolled flat and cut into one of a variety of shapes. While long, thin strips may be the most common, many varieties of noodles are cut into waves, helices, tubes, strings, or shells, or folded over, or cut into other shapes. Noodles are usually cooked in boiling water, sometimes with cooking oil or salt added. They are often pan-fried or deep-fried. Noodles are often served with an accompanying sauce or in a soup. Noodles can be refrigerated for short-term storage, or dried and stored for future use. The material composition or geocultural origin must be specified when discussing noodles. The word derives from the German word Nudel. Wheat noodles in Japan (udon) were adapted from a Chinese recipe by a Buddhist monk as early as the 9th century[citation needed]. Rested noodles were eaten by the people of Persia by the 13th century. Innovations continued, as for example, noodles made from buckwheat (naengmyeon) were developed in the Joseon Dynasty of Korea (1392–1897). Ramen noodles, based on Chinese noodles, became popular in Japan by 1900. The origin of noodles has been disputed, but the evidence heavily favours its origin in China. Claims have been made that the noodle was of Chinese, Arabian and Mediterranean origin. A Nature article claimed the oldest evidence of noodle consumption was from 4,000 years ago in China. In 2005, a team of archaeologists working in the People's Republic of China reported finding an earthenware bowl that contained foxtail millet and broomcorn millet noodles at the Lajia archaeological site, arguably hailing from the late neolithic period, but this claim was disputed by later research, which suggested that noodles simply cannot be produced from millet, which lacks gluten. The earliest written record of noodles is found in a book dated to the Eastern Han period (25– 220). Noodles, often made from wheat dough, became a staple food for people of the Han Dynasty (206 BCE - 220 CE). During the Tang Dynasty, the noodles were first cut into strips, and in the Yuan Dynasty the making of dried noodles began.
  • 25. 25 HEALTH DRINKS A drink or beverage is a liquid intended for human consumption. In addition to their basic function of satisfying thirst, drinks play important roles in human culture. Common types of drinks include plain water, milk, juices, coffee, tea, and soft drinks. In addition, alcoholic drinks such as wine, beer, and liquor, which contain the drug ethanol, have been part of human culture and development for 8,000 years Non-alcoholic drinks often signify drinks that would normally contain alcohol, such as beer and wine but are made with less than .5 percent alcohol by volume. The category includes drinks that have undergone an alcohol removal process such as non-alcoholic beers and de- alcoholised wines. Horlicks is a malted milk hot drink developed by founders James and William Horlicks. It is now marketed and manufactured by GlaxoSmithKline in the United Kingdom, New Zealand, Hong Kong, Bangladesh, Pakistan, India, and Jamaica. Bournvita, previously called Bourn-vita, is a brand of malted and chocolate malt drink mixes sold in Europe and North America, as well as India, Nepal, Nigeria, Ghana, Kenya, South Africa, Benin and Togo, and manufactured by Cadbury. Bournvita was developed in England in the late 1920s and was marketed as a health food. The original recipe included full-cream milk, fresh eggs, malt and chocolate. It was first manufactured and sold in Australia in 1933 Bournvita was discontinued in the UK market in 2008. The drink was named by Cadbury which was derived from Bournvita, the model village which is the site of
  • 26. 26 the Cadbury factory. It was first sold in India in 1948, the same year Cadbury India was established.
  • 27. 27 CHAPTER IV ANALYSIS AND INTERPRETATION 4.1 PERCENTAGE ANALYSIS: The percentage method is used for comparing certain features, the data represented in the form of table and graphs in order to give effective visualization of comparison made. Number of respondents Percentage analysis = ------------------------------------------- * 100 Total number of respondents
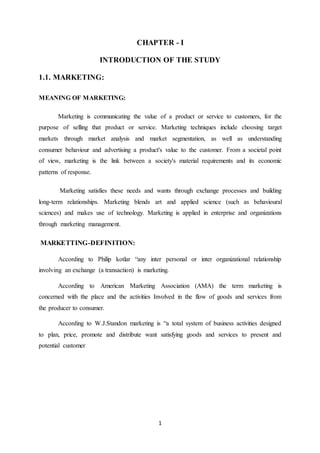
  • 28. 28 TABLE NO 4.1.1 TABLE SHOWING GENDER OF THE RESPONDENTS S.NO. GENDER NO.OF PERSON PERCENTAGE 1 Male 73 60 2 Female 47 40 Total 120 100 INTERPRETATION The above table shows that, 60% of the respondents are male and remaining 40% are female respondents. INFERENCE The majority, 60% of the respondents are male.
  • 29. 29 CHART NO 4.1.1 CHART SHOWING GENDER OF THE RESPONDENTS (Source: primary data) 73, 61% 47, 39% GENDER OF THE RESPONDENTS MALE FEMALE
  • 30. 30 TABLE NO 4.1.2 TABLE SHOWING AGE OF THE RESPONDENTS S.NO. AGE NO.OF RESPONDENTS PERCENTAGE 1 Below 25 20 16 2 Between 26 – 30 42 35 3 Between 31 - 40 47 39 4 Above 40 11 10 Total 120 100 INTERPRETATION From the above table shows that, 16% of the respondents are in the age group of below 25 years,35% of the respondents are in the age group of 26 – 30 years,39% of the respondents are in the age group of 31 – 40 years,11% of the respondents belongs to the age group of above 40 years. INFERENCE The majority, 39% of the respondents are in the age group of 31 – 40.
  • 31. 31 CHART NO 4.1.2 CHART SHOWING AGE OF THE RESPONDENTS (Source: primary data) below 25 between 26 to 30 between 31 to 40 above 40 AGE OF THE RESPONDENDS 20 42 47 11 20 42 47 11 AGE OF THE RESPONDENDS AGE OF THE RESPONDENDS
  • 32. 32 TABLE NO 4.1.3 TABLE SHOWING MARITAL STATUS OF THE RESPONDENTS S.NO MARITAL STATUS NO.OF RESPONDENTS PERCENTAGE 1 Married 120 100 2 Unmarried 0 0 Total 120 100 INFERENCE From the above table all the respondents are married
  • 33. 33 CHART NO 4.1.3 CHART SHOWING MARITAL STATUS OF THE RESPONDENTS (Source: primary data) 0% 10% 20% 30% 40% 50% 60% 70% 80% 90% 100% Married unmarried Married, 120 unmarried, 0 MARITAL STATUS MARITAL STATUS
  • 34. 34 TABLE NO 4.1.4 TABLE SHOWING MARITAL STATUS OF THE RESPONDENTS S.NO. CHILDREN HAVE CHILD PERCENTAGE 1 Yes 120 100 2 No 0 0 Total 120 100 INFERENCE From the above table all the respondents are having children.
  • 35. 35 CHART NO 4.1.4 CHART SHOWING CHILDREN OF THE RESPONDENTS (Source: primary data) yes 100% no 0% children yes no
  • 36. 36 TABLE NO 4.1.5 TABLE SHOWING NO.OF CHILDREN OF THE RESPONDENTS S.NO. NO.OF CHILDREN NO.OF PERSON PERCENTAGE 1 Only one 23 19 2 Two 71 59 3 Three 26 22 Total 120 100 INTERPRETATION From the above table shows that, 19% of the respondents are have only one child,59% of the respondents are have two children,22% of the respondents are have three children. INFERENCE The majority, 59% of the respondents are have two children.
  • 37. 37 CHART NO 4.1.5 CHART SHOWING NO OF CHILDREN OF THE RESPONDENTS (Source: primary data) 23, 19% 71, 59% 26, 22% NO OF CHILD only one two three
  • 38. 38 TABLE NO 4.1.6 TABLE SHOWING MONTHLY INCOME OF THE RESPONDENTS S.NO. MONTHLY INCOME NO.OF RESPONDENTS PERCENTAGE 1 Less than 10000 44 36 2 Between 10001- 15000 41 34 3 Between 15001- 20000 27 22 4 Above 20000 8 8 Total 120 100 INTERPRETATION In the above table shows that, 36% of the respondents salary is less than 10000,34% of the respondents salary is between 10001 - 15000,22% of the respondents salary is between 15001 - 20000,8% of the respondents salary were above 20000. INFERENCE The majority, 36% of the respondents salary is less than 10000.
  • 39. 39 CHART NO 4.1.6 CHART SHOWING MONTHLY INCOME OF THE RESPONDENTS (Source: primary data) 44 41 27 8 0 5 10 15 20 25 30 35 40 45 50 LESS THEN 10000 BETWEEN 10001-15000 BETWEEN 15001-20000 ABOVE 20000 less then 10000 between 10001-15000 between 15001-20000 above 20000 MONTHLY INCOME 44 41 27 8 MONTHLY INCOME MONTHLY INCOME
  • 40. 40 TABLE NO 4.1.7 TABLE SHOWING TYPE OF CABLE CONNECTION OF THE RESPONDENTS S.NO. TYPE OF CONNECTION NO.OF RESPONDENTS PERCENTAGE 1 Cable 74 61 2 Dish 46 39 Total 120 100 INTERPRETATION The above table shows that, 61% of the respondents are using cable and remaining 39% are dish using respondents. INFERENCE The majority, 61% of the respondents are using cable connection.
  • 41. 41 CHART NO 4.1.7 CHART SHOWING TYPE OF CABLE CONNECTION OF THE RESPONDENTS (Source: primary data) 74 46 0 10 20 30 40 50 60 70 80 cable dish TYPE OF CONNECTION TYPE OF CONNECTION
  • 42. 42 TABLE NO 4.1.8 TABLE SHOWING NO.OF HOURS TO WATCH TV OF THE RESPONDENTS S.NO. HOURS NO.OF RESPONDENTS PERCENTAGE 1 Less than 1 hour 22 18 2 1-2 hours 58 48 3 2-3 hours 24 20 4 Above 3 hours 16 14 Total 120 100 INTERPRETATION From the above table shows that, 18% of the respondents les then 1 hour to watch TV, 48% of the respondents are 1 – 2 hours, 20% of the respondents are 2 – 3 hours, 14% of the respondents are above 3 hours. INFERENCE The majority, 48% of the respondents are 1 – 2 hours to watch TV.
  • 43. 43 CHART NO 4.1.8 CHART SHOWING NO OF HOURS TO WATCH TV OF THE RESPONDENTS (Source: primary data) Less then 1 hour 1-2 hours 2-3 hours more then 3 hours HOURS OF WATCHING TV 22 58 24 16 22 58 24 16 0 10 20 30 40 50 60 70 HOURS OF WATCHING TV HOURS OF WATCHING TV
  • 44. 44 TABLE NO 4.1.9 TABLE SHOWING CHILD LIKE TO WATCH TV PROGRAM S.NO. CHILD LIKE TO WATCH TV NO.OF RESPONDENTS PERCENTAGE 1 Cartoons 32 26 2 Reality shows 52 43 3 Movies 27 22.5 4 Others 9 8.5 Total 120 100 INTERPRETATION In the above table shows that, 26% of the children like to watch cartoons,43% of the children like to watch reality shows,22.5% of the children like to watch movies,8.5% of the children like to watch others. INFERENCE The majority, 43% of the children like to watch reality shows.
  • 45. 45 CHART NO 4.1.9 CHART SHOWING CHILD LIKE TO WATCH TV PROGRAM (Source: primary data) cartoons 27% Reality shows 43% Movies 22% others 8% CHILD LIKE TO WATCH TV cartoons Reality shows Movies others
  • 46. 46 TABLE NO 4.1.10 TABLE SHOWING CHILD FAVORITE CONFECTIONARY PRODUCTS S.NO. FAVOURITE CONFECTIONARY PRODUCT NO.OF RESPONDENTS PERCENTAGE 1 Biscuits 31 25 2 Chocolates 33 27.5 3 Noodles 37 32 4 Health drinks 19 15.5 Total 120 100 INTERPRETATION From the above table shows that, 25% of the children favourite confectionary product is biscuits, 27.5% of the children like chocolates, 32% of the children like noodles, 15.5% of the children favourite confectionary product is health drinks.. INFERENCE The majority, 32% of the children favourite confectionary product is noodles.
  • 47. 47 CHART NO 4.1.10 CHART SHOWING CHILD FAVORITE CONFECTIONARY PRODUCTS (Source: primary data) Biscuits chocolates noodles health drinks FAVORITE CONFECTIONARY PRODUCTS 31 33 37 19 31 33 37 19 FAVORITE CONFECTIONARYPRODUCTS FAVORITE CONFECTIONARY PRODUCTS
  • 48. 48 TABLE NO 4.1.11 TABLE SHOWING FAMILIER WITH ADVERTISEMENT S.NO. FAMILIAR WITH ADVERTISEMENT NO.OF RESPONDENTS PERCENTAGE 1 Biscuits 22 18 2 Chocolates 57 48 3 Noodles 31 26 4 Health drinks 10 8 Total 120 100 INTERPRETATION In the above table shows that, 18% of the children confectionary product is biscuits, 48% of the children like chocolates, 26% of the children like noodles, 8% of the children familiar with advertisement of confectionary product is health drinks. INFERENCE The. Majority, 48% of the children familiar with advertisement of confectionary product is chocolate.
  • 49. 49 CHART NO 4.1.11 CHART SHOWING FAMILIER WITH ADVERTISEMENT (Source: primary data) 0 20 40 60 Biscui ts Choc olate s Nood les Healt h drink s FAMILIAR WITH ADVERTISEMENT 22 57 31 10 Biscuits, 22 Chocolates, 57 Noodles, 31 Healthdrinks, 10 FAMILIAR WITH ADVERTISEMENT FAMILIAR WITH ADVERTISEMENT
  • 50. 50 TABLE NO 4.1.12 TABLE SHOWING TRIED TO PURCHASE WHICH PRODUCT S.NO. TRIED TO PURCHASE NO.OF RESPONDENTS PERCENTAGE 1 Biscuits 45 37.5 2 Noodles 33 27.5 3 Chocolates 32 27 4 Health drinks 10 8 Total 120 100 INTERPRETATION From the above table shows that, 37.5% of the children tried to purchase biscuits after seeing advertisement,27.5% of the ,27.5% of the children like noodles,27% of the children are like to purchase chocolates,8% of the children like to purchase health drinks. INFERENCE The majority, 37.5% of the children tried to purchase a biscuits after seeing advertisement.
  • 51. 51 CHART NO 4.1.12 CHART SHOWING TRIED TO PURCHASE WHICH PRODUCT (Source: primary data) Biscuits noodles chocolates health drinks TRIED TO PURCHASE 45 33 32 10 0 5 10 15 20 25 30 35 40 45 50 TRIED TO PURCHASE TRIED TO PURCHASE
  • 52. 52 TABLE NO 4.1.13 TABLE SHOWING MEDIA OF ADVERTISEMENT S.NO. MEDIA OF ADVERTISEMENT NO.OF RESPONDENTS PERCENTAGES 1 TV 22 18 2 Magazine 40 33 3 Newspaper 42 35 4 Pamphlet 16 14 Total 120 100 INTERPRETATION In the above table shows that, 18% of the respondent seeing advertisement in tv,33% of the respondent seeing advertisement in Magazine,35% of the respondent seeing advertisement in Newspaper,14% of the respondent seeing advertisement pamphlet. INFERENCE The majority, 35 % of the respondent seeing advertisement in Newspaper.
  • 53. 53 CHART NO 4.1.13 CHART SHOWING MEDIA OF ADVERTISEMENT (Source: primary data) 45 33 32 4.5 0 5 10 15 20 25 30 35 40 45 50 Tv Magazine Newspaper pamphlet MEDIA OF ADVERTISEMENT MEDIA OF ADVERTISEMENT
  • 54. 54 TABLE NO 4.1.14 TABLE SHOWING INFLUENCE OF PURCHASE S.NO. INFLUENCE TO PURCHASE NO.OF RESPONDENTS PERCENTAGE 1 It gives free tattoo 37 31 2 Your friend have that product 34 28 3 Your favourite cartoon character 26 22 4 You want to be like that character 23 19 Total 120 100 INTERPRETATION The above table shows that, 31% of the respondent are purchase because of give free tattoos,28% of the respondents is our friend have that product,22% of the respondent our favourite cartoon character,19% of the respondent are purchase because of they want to be like that character. INFERENCE The majority,. 28% of the respondents is our friend have that product.
  • 55. 55 CHART NO 4.1.14 CHART SHOWING INFLUENCE OF PURCHASE (Source: primary data) 32% 29% 21% 18% INFLUENCE TO PURCHASE It gives fre tatto your friends have that product your favorite cartoon character you want to be like tht character
  • 56. 56 TABLE NO 4.1.15 TABLE SHOWING WHO INFLUENCE THE RESPONDENTS PURCHASE S.NO. WHO INFLUENCES YOUR PURCHASE NO.OF RESPONDENTS PERCENTAGE 1 Advertisement 38 31 2 Friends 45 39 3 Self 30 25 4 Children 7 5 Total 120 100 INTERPRETATION From the above table shows that, 38% of the respondent are influences for purchase decision in advertisement,45% of the respondents for friends ,30% of the respondent for self- decision,7% of the respondent for children decision. INFERENCE The majority, 39 % of the respondent are influences our purchase decision is friends.
  • 57. 57 CHART NO 4.1.15 CHART SHOWING INFLUENCE YOUR PURCHASE DECISION (Source: primary data) 0 5 10 15 20 25 30 35 40 45 Advertisement Friends Self Children 38 45 30 7 INFLUENCES YOUR PURCHASE DECISION INFLUENCES YOUR URCHASE DECISION
  • 58. 58 TABLE NO 4.1.16 TABLE SHOWING ADVERTISEMNET OF CONFECTIONARY PRODUCT S.NO. ADVERTISEMENT OF CONFECTIONARY PRODUCT NO.OF RESPONDENTS PERCENTAGE 1 Often 13 10 2 Rarely 45 38.5 3 Sometimes 37 31.5 4 Not at all 25 20 Total 120 100 INTERPRETATION The above table shows that, 13% of the respondent are often in influence of advertisement to confectionary product, 45% of the respondents for rarely, 37% of the respondent for sometimes, 25% of the respondent for not at all. INFERENCE The majority, .45 % of the respondent are rarely influences of advertisement to confectionary product.
  • 59. 59 CHART NO 4.1.16 CHART SHOWING ADVERTISEMNET OF CONFECTIONARY PRODUCT (Source: primary data) 0 5 10 15 20 25 30 35 40 45 Often Rarely Sometimes not at all ADVERTISEMENTOF CONFECTIONARYPRODUCT INFLUENCEPURCHASEDECISION ADVERTISEMENT OF CONFECTIONARY PRODUCT INFLUENCE PURCHASE DECISION
  • 60. 60 TABLE NO 4.1.17 TABLE SHOWING PURCHASE AFTER WATCHING ADVERTISEMENT S.NO. AFTER WATCHING ADVERTISEMENT NO.OF RESPONDENTS PERCENTAGE 1 Often 9 8 2 Rarely 36 30 3 Sometimes 55 46 4 Not at all 20 16 Total 120 100 INTERPRETATION From the above table shows that, 9% of the respondent are often in purchase after watching advertisement ,36% of the respondents for rarely,55% of the respondent for sometimes,20% of the respondent for not at all. INFERENCE The majority, 55% of the respondent are sometimes in purchase after watching advertisement.
  • 61. 61 CHART NO 4.1.17 CHART SHOWING PURCHASE AFTER WATCHING ADVERTISEMENT (Source: primary data) 7% 30% 46% 17% 63% PURCHASE OF PRODUCT AFTER WATCHING ADVERTISEMENT Often rarely sometimes not at all
  • 62. 62 TABLE NO 4.1.18 TABLE SHOWING ADVERTISEMENT HELP TO MAKE BETTER SELECTION S.NO. ADVERTISEMENT HELP TO BETTER SELECTION NO.OF RESPONDENTS PERCENTAGE 1 Agree 22 17 2 Disagree 39 38 3 Indifferent 59 45 Total 120 100 INTERPRETATION In the above table shows that, 22% of the respondent are agree in advertisement help to make better selection ,39% of the respondents for disagree,59% of the respondent for indifferent. INFERENCE The majority, 59% of the respondent are indifferent in advertisement help to make better selection.
  • 63. 63 CHART NO 4.1.18 CHART SHOWING ADVERTISEMENT HELP TO MAKE BETTER SELECTION (Source: primary data) AG R EE D I S AG REE I N D I F FEREN T 22 39 59 ADVERTISEMENT HELP TO BETTER SELECTION Advertisement help to better selection
  • 64. 64 TABLE NO 4.1.19 TABLE SHOWING OVERALL SATISFACTION S.NO. OVERALL SATISFACTION NO.OF RESPONDENTS PERCENTAGE 1 Highly satisfied 13 11 2 Satisfied 50 42 3 Neutral 30 25 4 Dissatisfied 17 14 5 Highly dissatisfied 10 8 Total 120 100 INTERPRETATION In the above table shows that, 13% of the respondent are highly satisfied in overall satisfaction for advertisement of confectionary product, 50% of the respondents are satisfied, 30% of the respondent are neutral. 17% of the respondents are dissatisfied and 10% of the respondent are highly dissatisfied. INFERENCE The majority, 50% of the respondents are satisfied in overall satisfaction.
  • 65. 65 CHART NO 4.1.19 CHART SHOWING OVERALL SATISFACTION (Source: primary data) 11% 42% 25% 14% 8% OVERALL SATISFACTION Highly satisfied satisfied neutral dissatisfied highly dissatisfied
  • 66. 66 TABLE NO 4.1.20 TABLE SHOWING RECOMMENED THE PRODUCT TO YOUR FRIENDS S.NO. RECOMMEND THE PRODUCT TO YOUR FRIENDS NO.OF RESPONDENTS PERCENTAGE 1 Yes 51 43 2 No 69 57 Total 120 100 INTERPRETATION The above table shows that, 51% of the respondent are say yes in Recommend the product to your friends, 69% of the respondents for say no. INFERENCE The majority, 69% of the respondents for say no recommend the product to your friends.
  • 67. 67 CHART NO 4.1.20 CHART SHOWING RECOMMENED THE PRODUCT TO YOUR FRIENDS (Source: primary data) 0 10 20 30 40 50 60 70 YES NO 51 69 Recommendthe product to your friends Recommend the product to your friends
  • 68. 68 TABLE NO 4.1.21 TABLE SHOWING INFLUENCE OF PURCHASE FACTORS HIGHLY SATISFIED SATISFIED NEUTRAL DISSATISFIED HIGHLY DISSATISFIED NOOF RESPONDENTS PERCENTAGE Advertisement influences 31 27 50 7 5 120 100% 26% 22% 42% 6% 4% Necessary information 9 60 23 26 2 120 100% 8% 50% 19% 21% 2% Advertisement Are exaggerated 19 35 48 16 2 120 100% 16% 29% 40% 13% 2% Irrelevant to product 15 38 48 17 2 120 100% 12% 32% 40% 14% 2% Influenced by an advertisement 10 30 45 24 11 120 100% 8% 25% 38% 20% 9% Helps us to raise our standard of living 11 15 42 41 11 120 100% 9% 13% 35% 34% 9% Truthful and ethical 9 21 41 33 16 120 100% 8% 16% 34% 28% 14% Results in better product 10 26 43 28 13 120 100% 8% 22% 36% 23% 11% Result in lower price 4 24 44 30 18 120 100% 3% 20% 37% 25% 15% Good value of society 13 14 38 28 27 120 100% 11% 12% 32% 23% 22%
  • 69. 69 INTERPRETATION: It is observed from the above table that out of the total respondents 26% were highly satisfied with Advertisement influences whereas 22% of respondents are satisfied, 42% were neutral, 6% were dissatisfied and 4% were highly dissatisfied. From the above table 8% were highly satisfied with necessary information whereas 50% of respondents are satisfied, 19% were neutral, 21% were dissatisfied and 2% were highly dissatisfied. In the above table 16 % were highly satisfied with Advertisement Are exaggerated whereas 29% of respondents are satisfied, 40% were neutral, 13% were dissatisfied and 2% were highly dissatisfied. The above table 12% were highly satisfied with Irrelevant to product whereas 32% of respondents are satisfied, 40% were neutral, 14% were dissatisfied and 2% were highly dissatisfied. From the above table 8% were highly satisfied with Influenced by an advertisement whereas 25% of respondents are satisfied, 38% were neutral, 20% were dissatisfied and 9% were highly dissatisfied. The above table 9% were highly satisfied with helps us to raise our standard of living whereas 13% of respondents are satisfied, 35% were neutral, 34% were dissatisfied and 9% were highly dissatisfied. The above table 8% were highly satisfied with Truthful and ethical whereas 16% of respondents are satisfied, 34% were neutral, 28% were dissatisfied and 14% were highly dissatisfied. 8% were highly satisfied with Results in better product whereas 22% of respondents are satisfied, 36% were neutral, 23% were dissatisfied and 11% were highly dissatisfied. The above table 3% were highly satisfied with Result in lower price whereas 20% of respondents are satisfied, 37% were neutral, 25% were dissatisfied and 15% were highly dissatisfied. From the above table 11% were highly satisfied with Good value of society whereas 12% of respondents are satisfied, 32% were neutral, 23% were dissatisfied and 22% were highly dissatisfied. The survey reveals that the majority of the respondents are satisfied with the advertisement provide necessary information.
  • 70. 70 TABLE 4.2 TABLE SHOWING RANK ANALYSIS FACTORS RANK TOTAL MEAN VALUE RANK I II II IV V VI VII VIII Price 19 33 18 17 11 7 9 10 447 3.72 I 19 66 54 68 55 42 63 80 Taste 17 9 11 16 23 14 18 12 553 4.60 V 17 18 33 64 11 84 12 6 96 Quality 28 6 8 11 27 14 15 11 520 4.33 III 28 12 24 44 13 84 10 5 88 Advertisement 36 7 12 10 14 7 13 22 121 1.00 II 36 7 12 10 14 7 13 22 Quantity 9 24 17 10 10 14 21 15 549 4.57 IV 9 48 51 40 50 84 14 7 120 Brand 9 23 24 25 26 27 28 29 947 7.89 VIII 9 46 72 10 13 16 19 6 232 Packing 1 7 18 20 19 25 16 14 618 5.15 VII 1 14 54 80 95 15 11 2 112 Offer and discount 3 13 21 22 14 19 8 21 588 4.9 VI 3 26 63 88 70 11 56 168
  • 71. 71 INTERPRETATION It is observed from the above table that, the factor price was ranked first by selected sample respondents, advertisement was ranked second, quality was ranked third, and quantity was ranked fourth. Taste was ranked fifth, offer and discount was ranked sixth, packing was ranked seventh, brand was eighth rank by the selected sample respondents.
  • 72. 72 CHAPTER V FINDING, SUGGESSTIONAND CONCLUTION 5.1 PERCENTAGE ANALYSIS:  The majority, 60% of the respondents are male.  Most of the respondents are in the age group of 31 – 40.  The majority, 100% of the respondents are married.  The majority, 100% of the respondents are have children.  The majority, 59% of the respondents are have two children.  Most of the respondent’s salary is less than 10000.  The majority, 61% of the respondents are using cable connection.  The majority, 52% of the respondents are 1 – 2 hours to watch TV.  Most of the children like to watch reality shows.  Most of the children favourite confectionary product is noodles.  The majority, 50% of the children familiar with advertisement of confectionary product is chocolate.  Most of the children tried to purchase a biscuits after seeing advertisement.  Most of the respondent seeing advertisement in Newspaper.  Most of the respondents are purchase because our friend have that product.  Most of the respondent are influences our purchase decision is friends.
  • 73. 73  Most of the respondent are rarely influences of advertisement to confectionary product.  The majority, 55% of the respondent are sometimes in purchase after watching advertisement.  The majority, 59% of the respondent are indifferent in advertisement help to make better selection.  The majority, 50% of the respondents are satisfied in overall satisfaction.  The majority, 69% of the respondents for say no recommend the product to your friends. LEVEL OF SATISFACTION  The majority ,42% of the respondents were neutral in Advertisement influences, 50% of respondents are satisfied with necessary information, 40% of the respondents were neutral in Advertisement Are exaggerated, 40% of the respondents were neutral in irrelevant to product, 38% of the respondents were neutral in Influenced by an advertisement, 34% of the respondents were neutral in Helps us to raise our standard of living, 35% of the respondents are neutral in advertisement is Truthful and ethical, 36% of the respondents were neutral in Results in better product, 37% of the respondents were neutral in Result in lower price, 32% of the respondents were neutral in Good value of society.
  • 74. 74 5.2 SUGGESTIONS: On the basis of above conclusions following suggestions can be given:  To some extent children have limited understanding so advertisers should not directly persuade children to buy the product which is shown in the advertisement.  Advertisement must not misuse children relative inexperience.  Children can be easily attracted by the cartoon and jingles so, as for as confectionary products are concerned children should know all the pros and cons of that particular product.  It is the duty of parents to see what their children are watching on television and if they are highly influenced by the advertisement especially of confectionary products then parents should try to explain them what are the pros and cons of that product by using it.  It is suggested that parents may be educated and they educate their children about advantages of eating healthy and disadvantages of unhealthy food.  It is suggested that Government may also take care while formation of rules and regulations in advertisements taking.
  • 75. 75 5.3 CONCLUSION: Today, particularly young children play an important role as consumers. Especially confectionary products (Biscuits, chocolate, noodles and health drinks) are concerned they do not care price of which they want to buy. Also they do not care whether these products are healthy for them or not. While they are shopping .the first thing comes in their mind to purchase the advertised products. In this station, the advertising has a stronger effect on younger children than the older children. Nowadays it seems that children’s impact on family decision in shopping has been steadily increased. After the research, I was found as far as confectionary products are concerned children sometime insist their parents to purchase to those product for them. As far as confectionary are concerned, children are influenced more by television advertisements than by the other medium of advertising, Even though there are lots of tools to show the goods are services, television was chosen as the best way that enhance the company’s profits greatly by most of researchers. Also this research validated that among many communication tools, television advertisements have more impact and effect on children then other medium of advertising, children ages are important to understand the television advertisements. Children comprehension of TV.
  • 76. 76 BIBLIOGRAPHY: BOOKS:  P.Saravanavel, Research methodology 2001.Pub: Keshav Prakasham. Allahabad  S.P.Gupta, Statistical method 1992, Pub: Sultan Chand & sons, New Delhi.  Henry E-Garrett, Statistical method and Education, 2004 Vakils, Feffer and Bombay.  S.C Gupta Fundamentals of statistics, 2007 Himalaya publishing house, New Delhi.  Kothari C.R Research Methodology-Method & techniques, Wishwa, Prakahsan (India), Edition-2, PP-23, 1. JOURNALS:  Advertisement and Sales Promotion Management,6th Edition  Ogilvy David’ Ogilvy on advertisement’ by, prion books London 2000  Indian journal of marketing ,June 2015  Effect of advertisement on children  Marketing Promos Targeting Children  International Journal of marketing
  • 77. 77 WEBSITES:  http://www.wikipedia.com  http://www.chocomize.com  http://www.biscuitsandcompany.com  http://www.media-awareness.com  http://www.indiamart.com  http://www.globaldata.com  http://www.noodlehouse.com  http://www.internetworldstats.com
  • 78. 78 A STUDY ON EFFECT OF ADVERTISEMENT ON CONFECTIONARY PRODUCT WITH SPECIAL REFERENCE TO TIRUPUR CITY QUESTIONNAIRE Q1 Name : Q2 Gender : a) Male ( ) b) Female ( ) Q3 Age : a) Below 25 b) Between 26 to 30 c) Between 31-40 d) Above 40 Q4 What is your marital status? a) Married b) unmarried Q5 Do you have child? a) Yes b) No Q6 If yes then how many child you have? a) 1 b) 2 c) 3 Q7 What is your monthly income? a) Less then 10000 c) Between 10001 to 15000 b) Between 15001 to 20000 d) Above 20000 Q8 Do you have TV at home? a) Yes b) No Q9 If yes what type of connection at home? a) Cable b) dish Q10 How many hours a day do you watch TV? a) Less than 1 hour b)1-2hours c) 2-3hours d) Morethan3hours Q11 what your child like to watch on TV? a) Cartoons b) Reality shows c) Movies TV serials d)Others_________________ Q12 which is your child’s favorite confectionary products? a) Biscuits b) Chocolates c) Noodles d) HealthDrinks Q13 Are you familiar with advertisements of which of the following confectionary products? a) Biscuits b) Chocolates c) Noodles d) Health Drinks Q14 After watching advertisement of any confectionary products, have you ever tried to purchasethat
  • 79. 79 Product? a) Yes b) No Q15 If yes then which confectionary product you have tried to purchase after seeing advertisement? a) Biscuit b) Noodles c) Chocolate d) Health Drink Q16 In which media you seeing most of the advertisements? a) TV b) Magazine c) Newspaper d) Pamphlet Q17 What influence you to purchase the particular confectionaryproduct? a) It gives free tattoo or any other thing b) Your friend has that product c) Yourfavoritecartoon character d) Youwanttobelikethecharacterofthatadvertisement Q18 What influences your purchase decisions? a) Advertisement b) friends c) Self d) children Q19 How often advertisements of confectionary products influence purchase decision? a) Often b) Rarely c) Sometimes d) not at all Q20 How often does your child insist you to purchase any confectionary product after watching advertisement of the same? a) Often b) Rarely c) Sometimes d) not at all Q21 Advertisement helps to make better selection ? a) Agree b) disagree c) indifferent Q22 Overall satisfaction towards confectionary product? a) Highly satisfied b) satisfied c) Neutral d) Dissatisfied e) highly dissatisfied Q23 Will you recommend the confectionary product which you purchased to your friends? a) Yes b) No 24.Influence of advertisement on purchase Statement Very high (1) High (2) Neutral (3) Low (4) Very low (5) Advertisement influences purchase decisions Advertisements provides necessary information Advertisements are exaggerated Advertisement are irrelevant to the product Most of my purchase are influenced by an advertisements Advertising helps us to raise our standard of living
  • 80. 80 Advertising is truthful and ethical Advertising results in better product for public In general advertising result in lower price Advertising promotes good value in the society 25.Rank the influencing factors for purchasing confectionaryproduct FACTORS RANK (1 to 8) Price Taste Quality Advertisement Quantity Brand Packing Offer and discount